Copyright
©The Author(s) 2004.
World J Gastroenterol. Jan 1, 2004; 10(1): 53-57
Published online Jan 1, 2004. doi: 10.3748/wjg.v10.i1.53
Published online Jan 1, 2004. doi: 10.3748/wjg.v10.i1.53
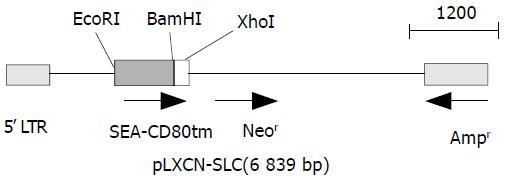
Figure 1 Gene map of expression vector.
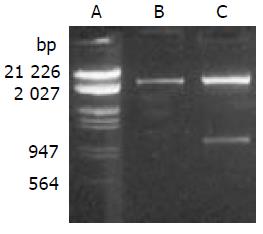
Figure 2 Enzyme digestion analysis of expression vector.
A. Lambda DNA (EcoRI, HindIII); B. pLXSN (EcoRI, xhoI); C. pLXSN-SLC (EcoRI, xhoI).
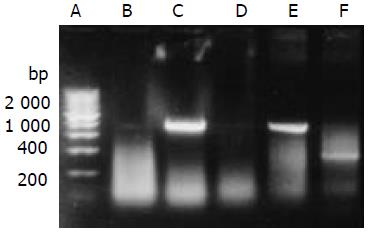
Figure 3 RT-PCR detected the transcription of SEA gene.
A. 200 bp DNA marker; B. HepG2; C. HepG2 transfected with pLXSN-SLC; D. HepG2 transfected with pLXSN; E. Positive control; F.β-actin (RNA of C).
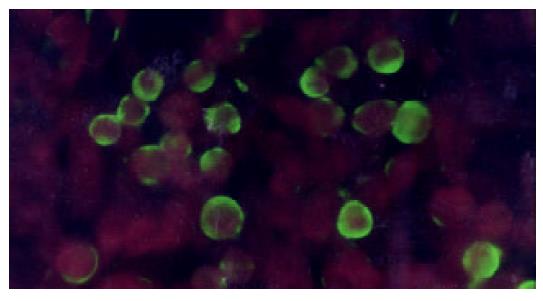
Figure 4 SEA expressed on the membrane of HepG2 (indirect immunofluorescence).
HepG2-SEA cells were stained accord-ing to the standard protocol of indirect immunofluorescence. First antibody is mouse anti-SEA IgG and second antibody is FITC labeled sheep anti-mouse IgG diluted in 0.1‰ evan blue. Positive signal is green while the background is red. SEA was located on the membrane of HepG2. Untransfected HepG2 cells did not express SEA (data not show).
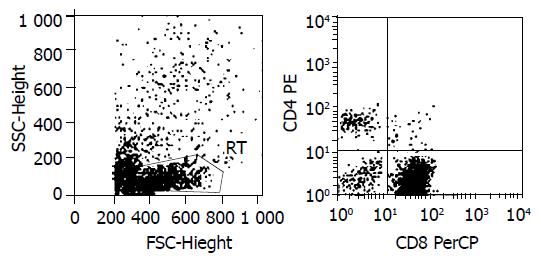
Figure 5 Lymphocyte phenotype analysis.
1 × 10⁵ SEA-T cells were stained with BD TriTEST™ antibody CD4 FITC/CD8 PE/ CD3 PerCP, and assayed by FACS. CD3+90.75%, CD8+84.46%, CD4+6.29%.
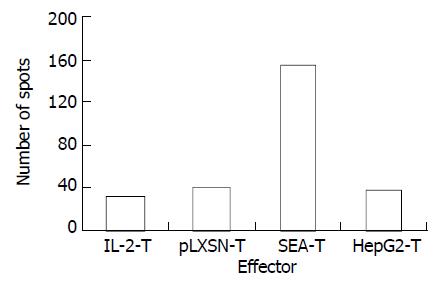
Figure 6 HepG2-SEA increased the number of hepG2 specific CTL in T lymphocyte line.
Each bar represents average of spots in triplicate wells.
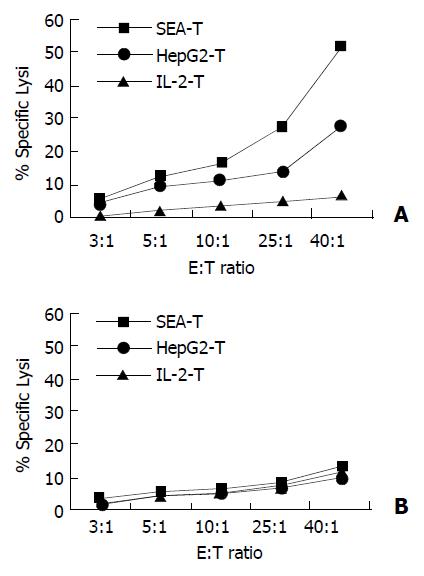
Figure 7 Membrane expressed SEA enhanced specific lysis on autologous tumor cells.
Cytotoxicity was measured in a stan-dard 4-hour 51Cr-release assay. Target cells (HepG2, SMMC-7721) were seeded in triplicate in v-bottomed microtiter plates at a concentration of 5 × 10³ cells per well. Effector cells were added at an effector-to-target (E:T) cell ratio of 40:1, 25:1, 10:1, 5:1 and 3:1 respectively. A: SEA-T was highly efficient in di-recting specific lysis of HepG2 cells (squares), HepG2-T has moderate cytotoxicity on HepG2 (cross) cells (P < 0.001). B: None of T cell line has killing effect on SMMC-7721 cells.
- Citation: Lu SY, Sui YF, Li ZS, Ye J, Dong HL, Qu P, Zhang XM, Wang WY, Li YS. Superantigen-SEA gene modified tumor vaccine for hepatocellular carcinoma: An in vitro study. World J Gastroenterol 2004; 10(1): 53-57
- URL: https://www.wjgnet.com/1007-9327/full/v10/i1/53.htm
- DOI: https://dx.doi.org/10.3748/wjg.v10.i1.53


