Copyright
©The Author(s) 2004.
World J Gastroenterol. Jan 1, 2004; 10(1): 117-121
Published online Jan 1, 2004. doi: 10.3748/wjg.v10.i1.117
Published online Jan 1, 2004. doi: 10.3748/wjg.v10.i1.117
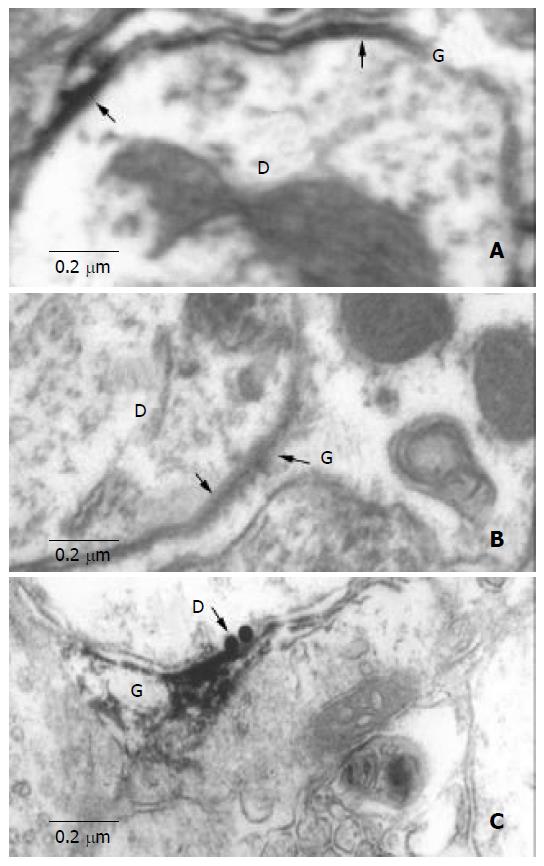
Figure 1 Electron microscopic observation of HGJ.
A: A dendrite (D) contacts with the process of ASs (G), the arrow indicates the thickened and dark stained cellmembrane, and there is a narrow cleft between them. B: Peroxidase labeling shows a dendrite (D) and a process of astrocyte (G). C: Located between the Cx32-LI dendrites (D) (5 nm black gold particles labeling, black arrow) and astrocytic process (G) (peroxidase labeling).
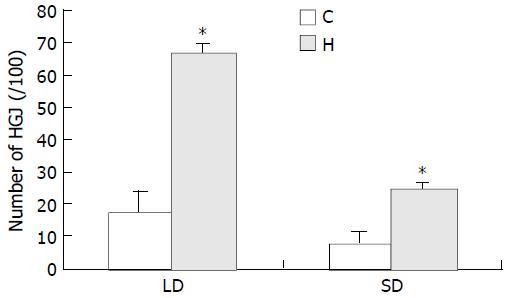
Figure 2 Histogram comparison between hyperosmotic group (H) and control group (C) demonstrating percentages of HGJ formed by processes of astrocytes with neuronal dendrites (LD: large dendrites, SD: small dendrites).
The percentage indicated the ratio of positive LD or SD bearing HGJ in the total number of LD or SD, respectively. Significant difference was seen be-tween the experimental group and control group (P < 0.001).
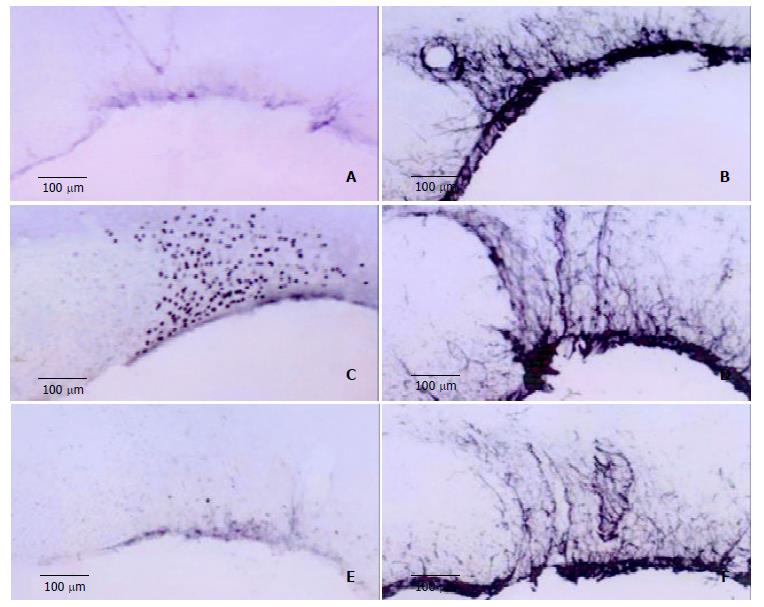
Figure 3 A,B: Expression of Fos-LI neurons and GFAP-LI ASs in SON of control group rats.
C, D: Number of Fos-LI neurons and GFAP-LI ASs in hyperosmotic stimulation group compared to that of control group. E, F: Inhibited expression of Fos-LI neurons in CBX-injected rats, and uninhited GFAP-LI ASs.
- Citation: Duan L, Yuan H, Su CJ, Liu YY, Rao ZR. Ultrastructure of junction areas between neurons and astrocytes in rat supraoptic nuclei. World J Gastroenterol 2004; 10(1): 117-121
- URL: https://www.wjgnet.com/1007-9327/full/v10/i1/117.htm
- DOI: https://dx.doi.org/10.3748/wjg.v10.i1.117


