Copyright
©The Author(s) 2019.
World J Meta-Anal. Jun 30, 2019; 7(6): 323-338
Published online Jun 30, 2019. doi: 10.13105/wjma.v7.i6.323
Published online Jun 30, 2019. doi: 10.13105/wjma.v7.i6.323
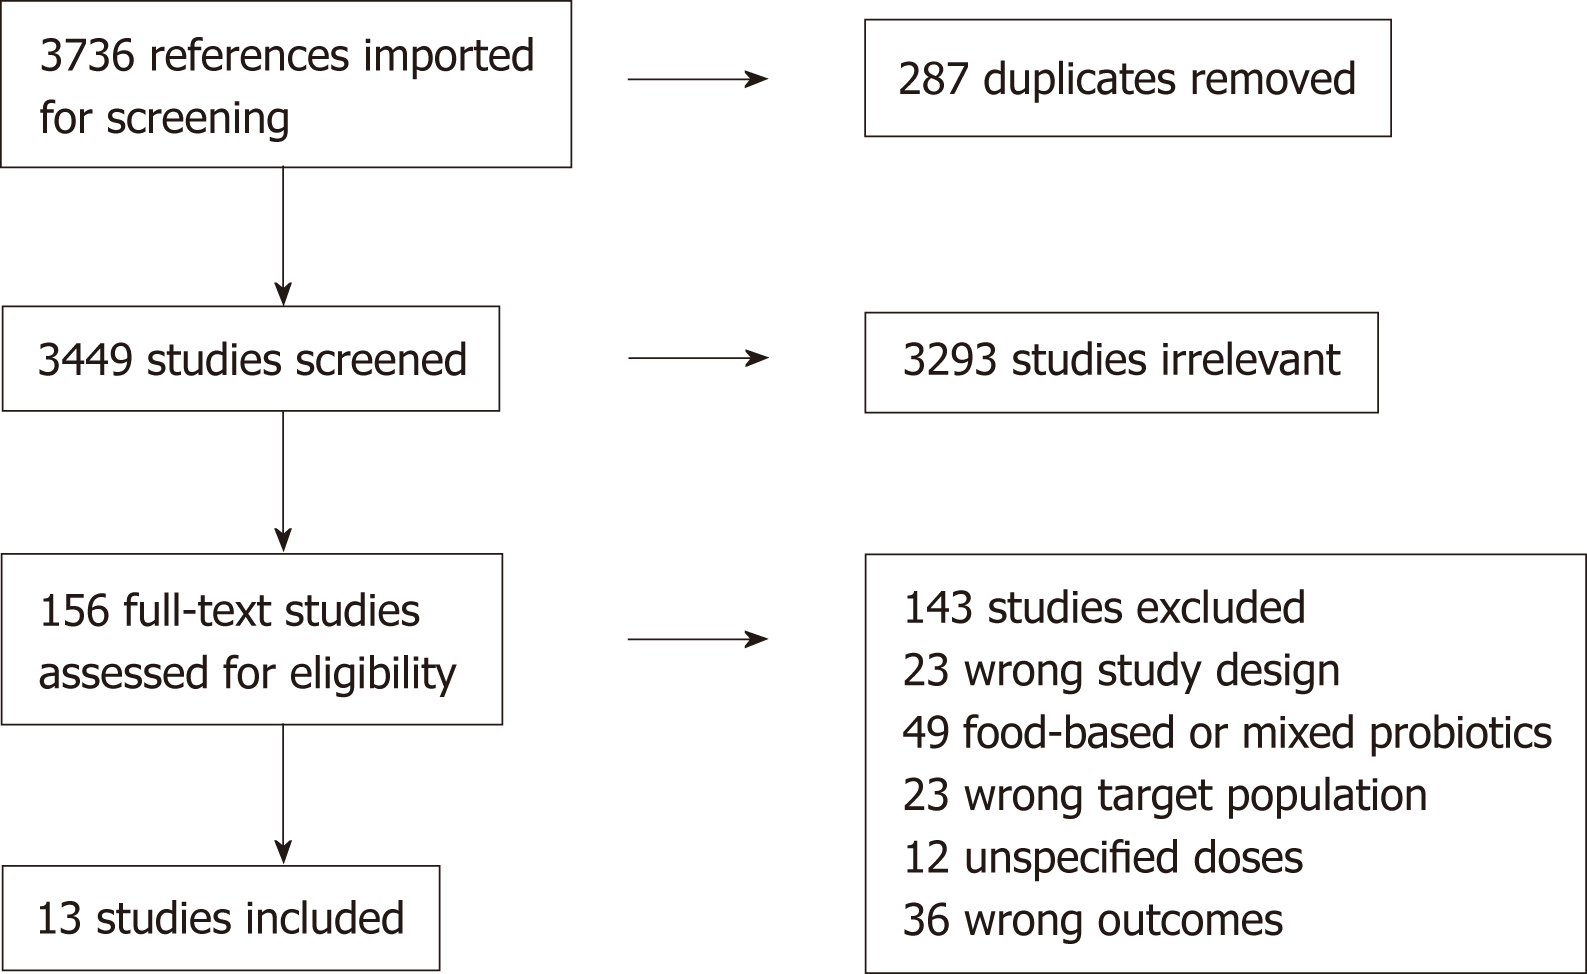
Figure 1 Study selection.
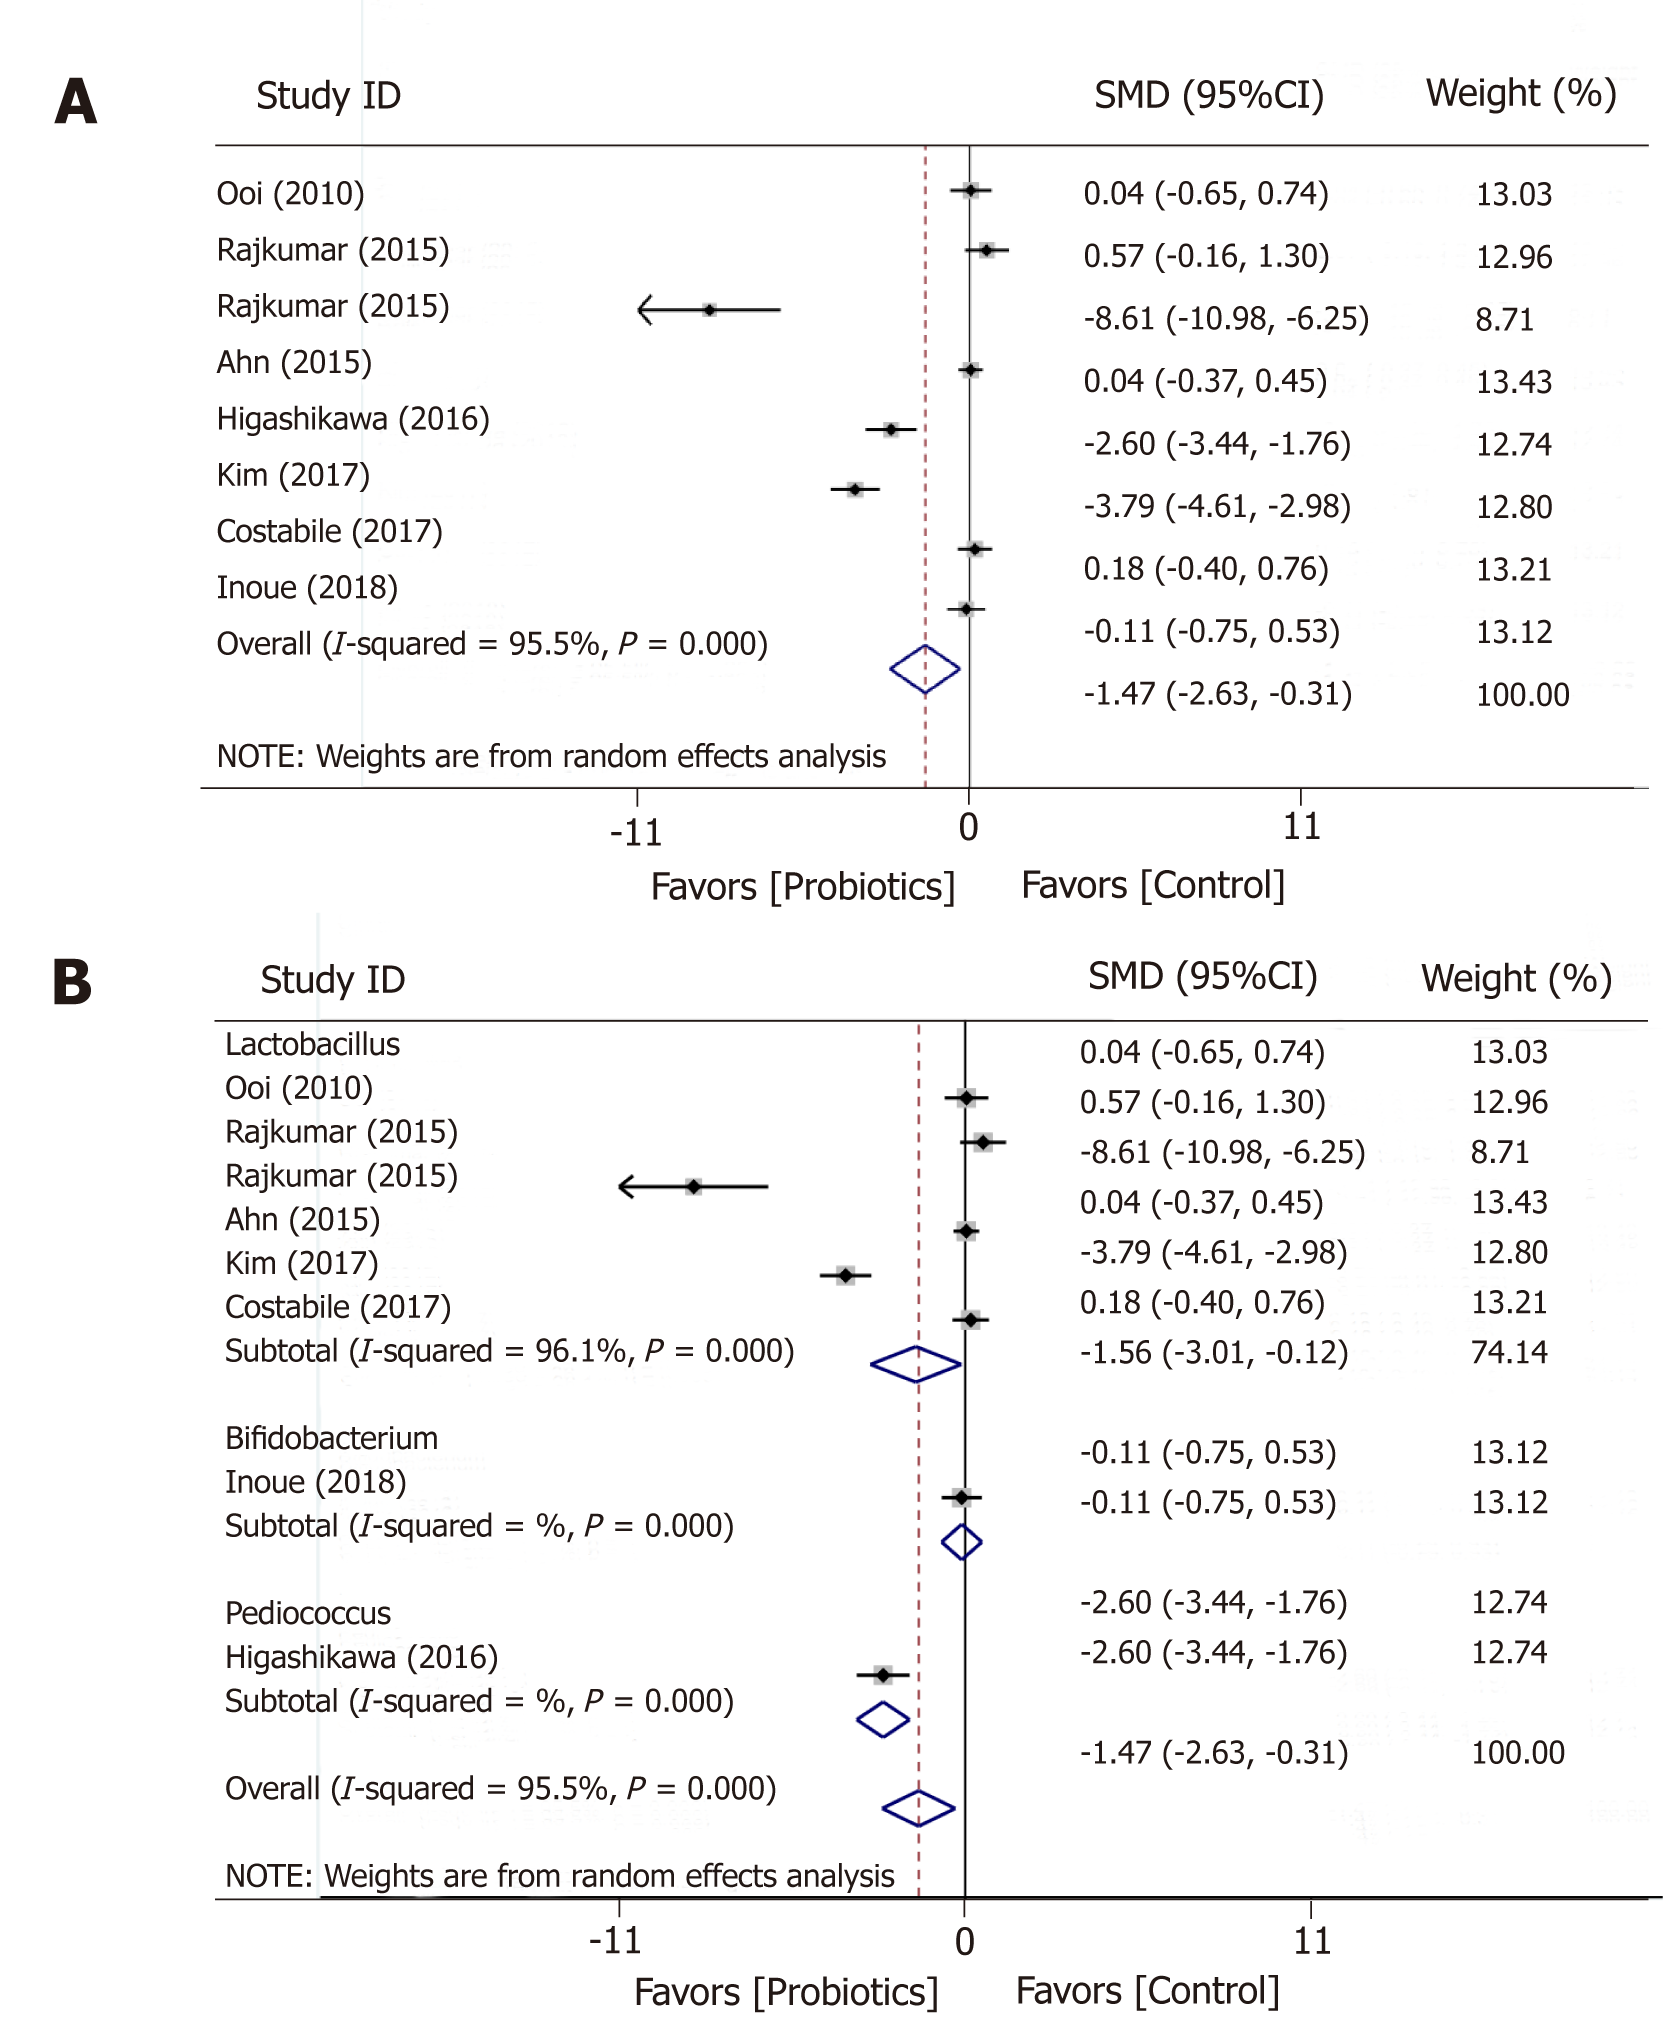
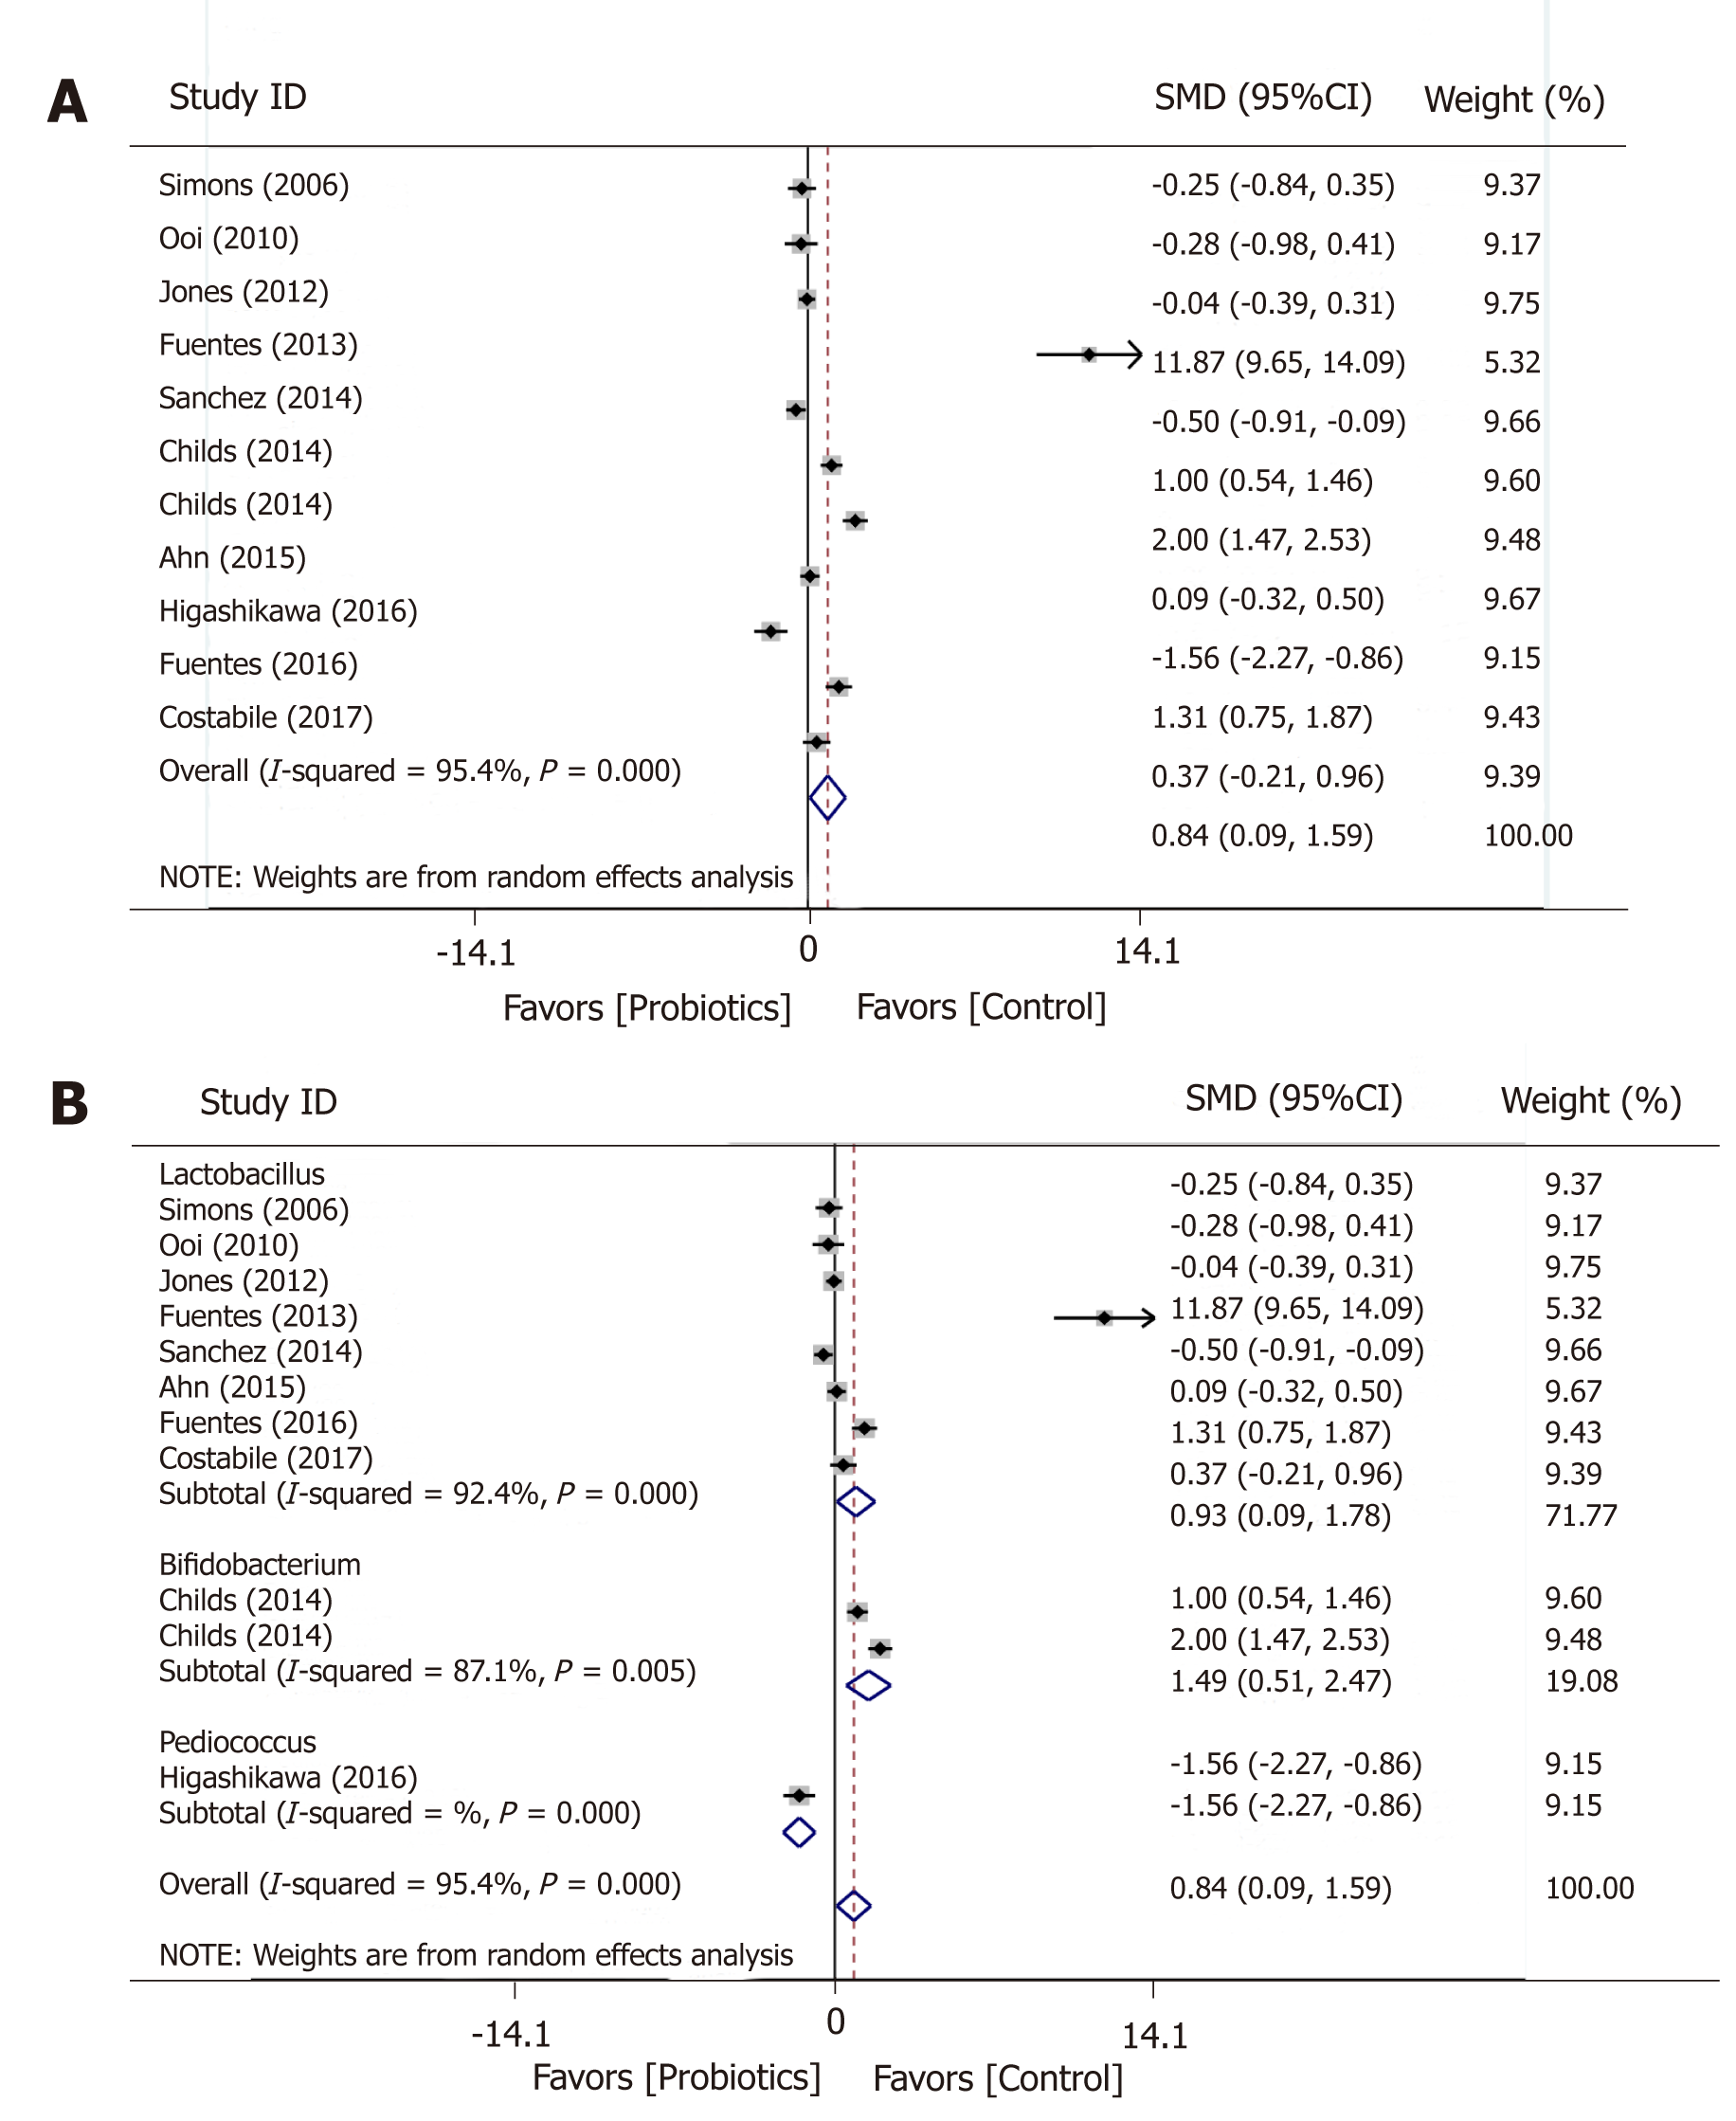
Figure 2 Meta-analysis forest plot concerning body mass index (A) and body mass index by genus (B).
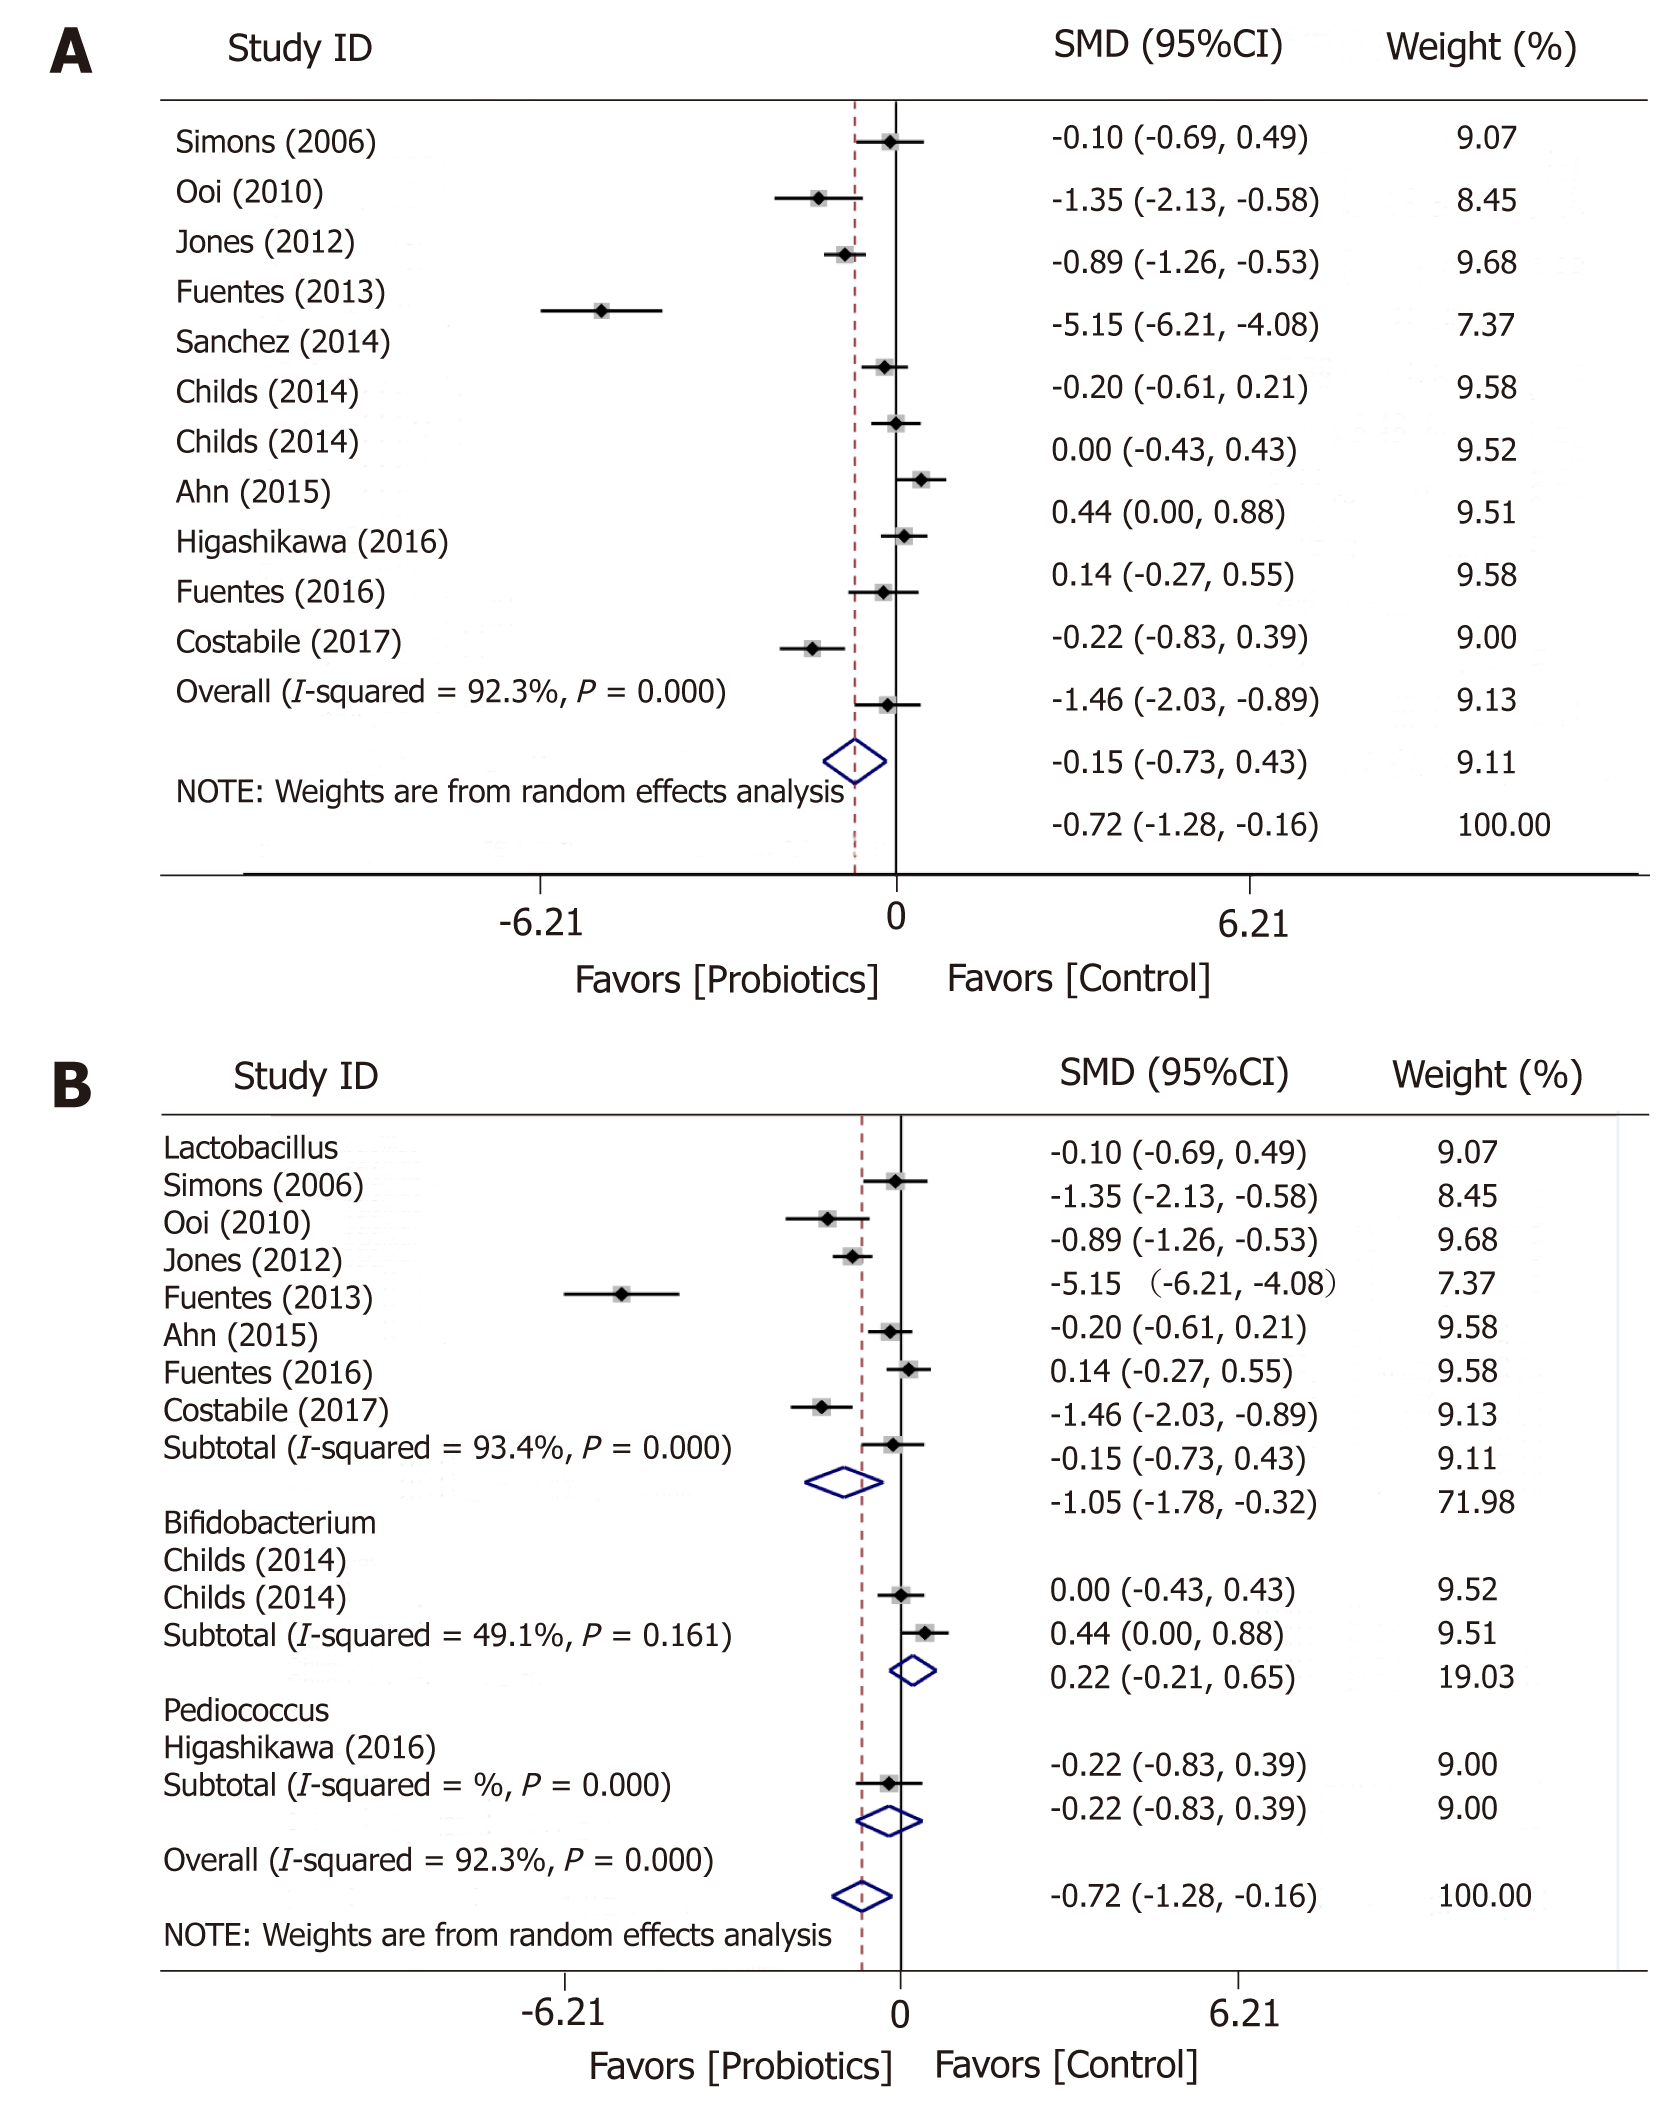
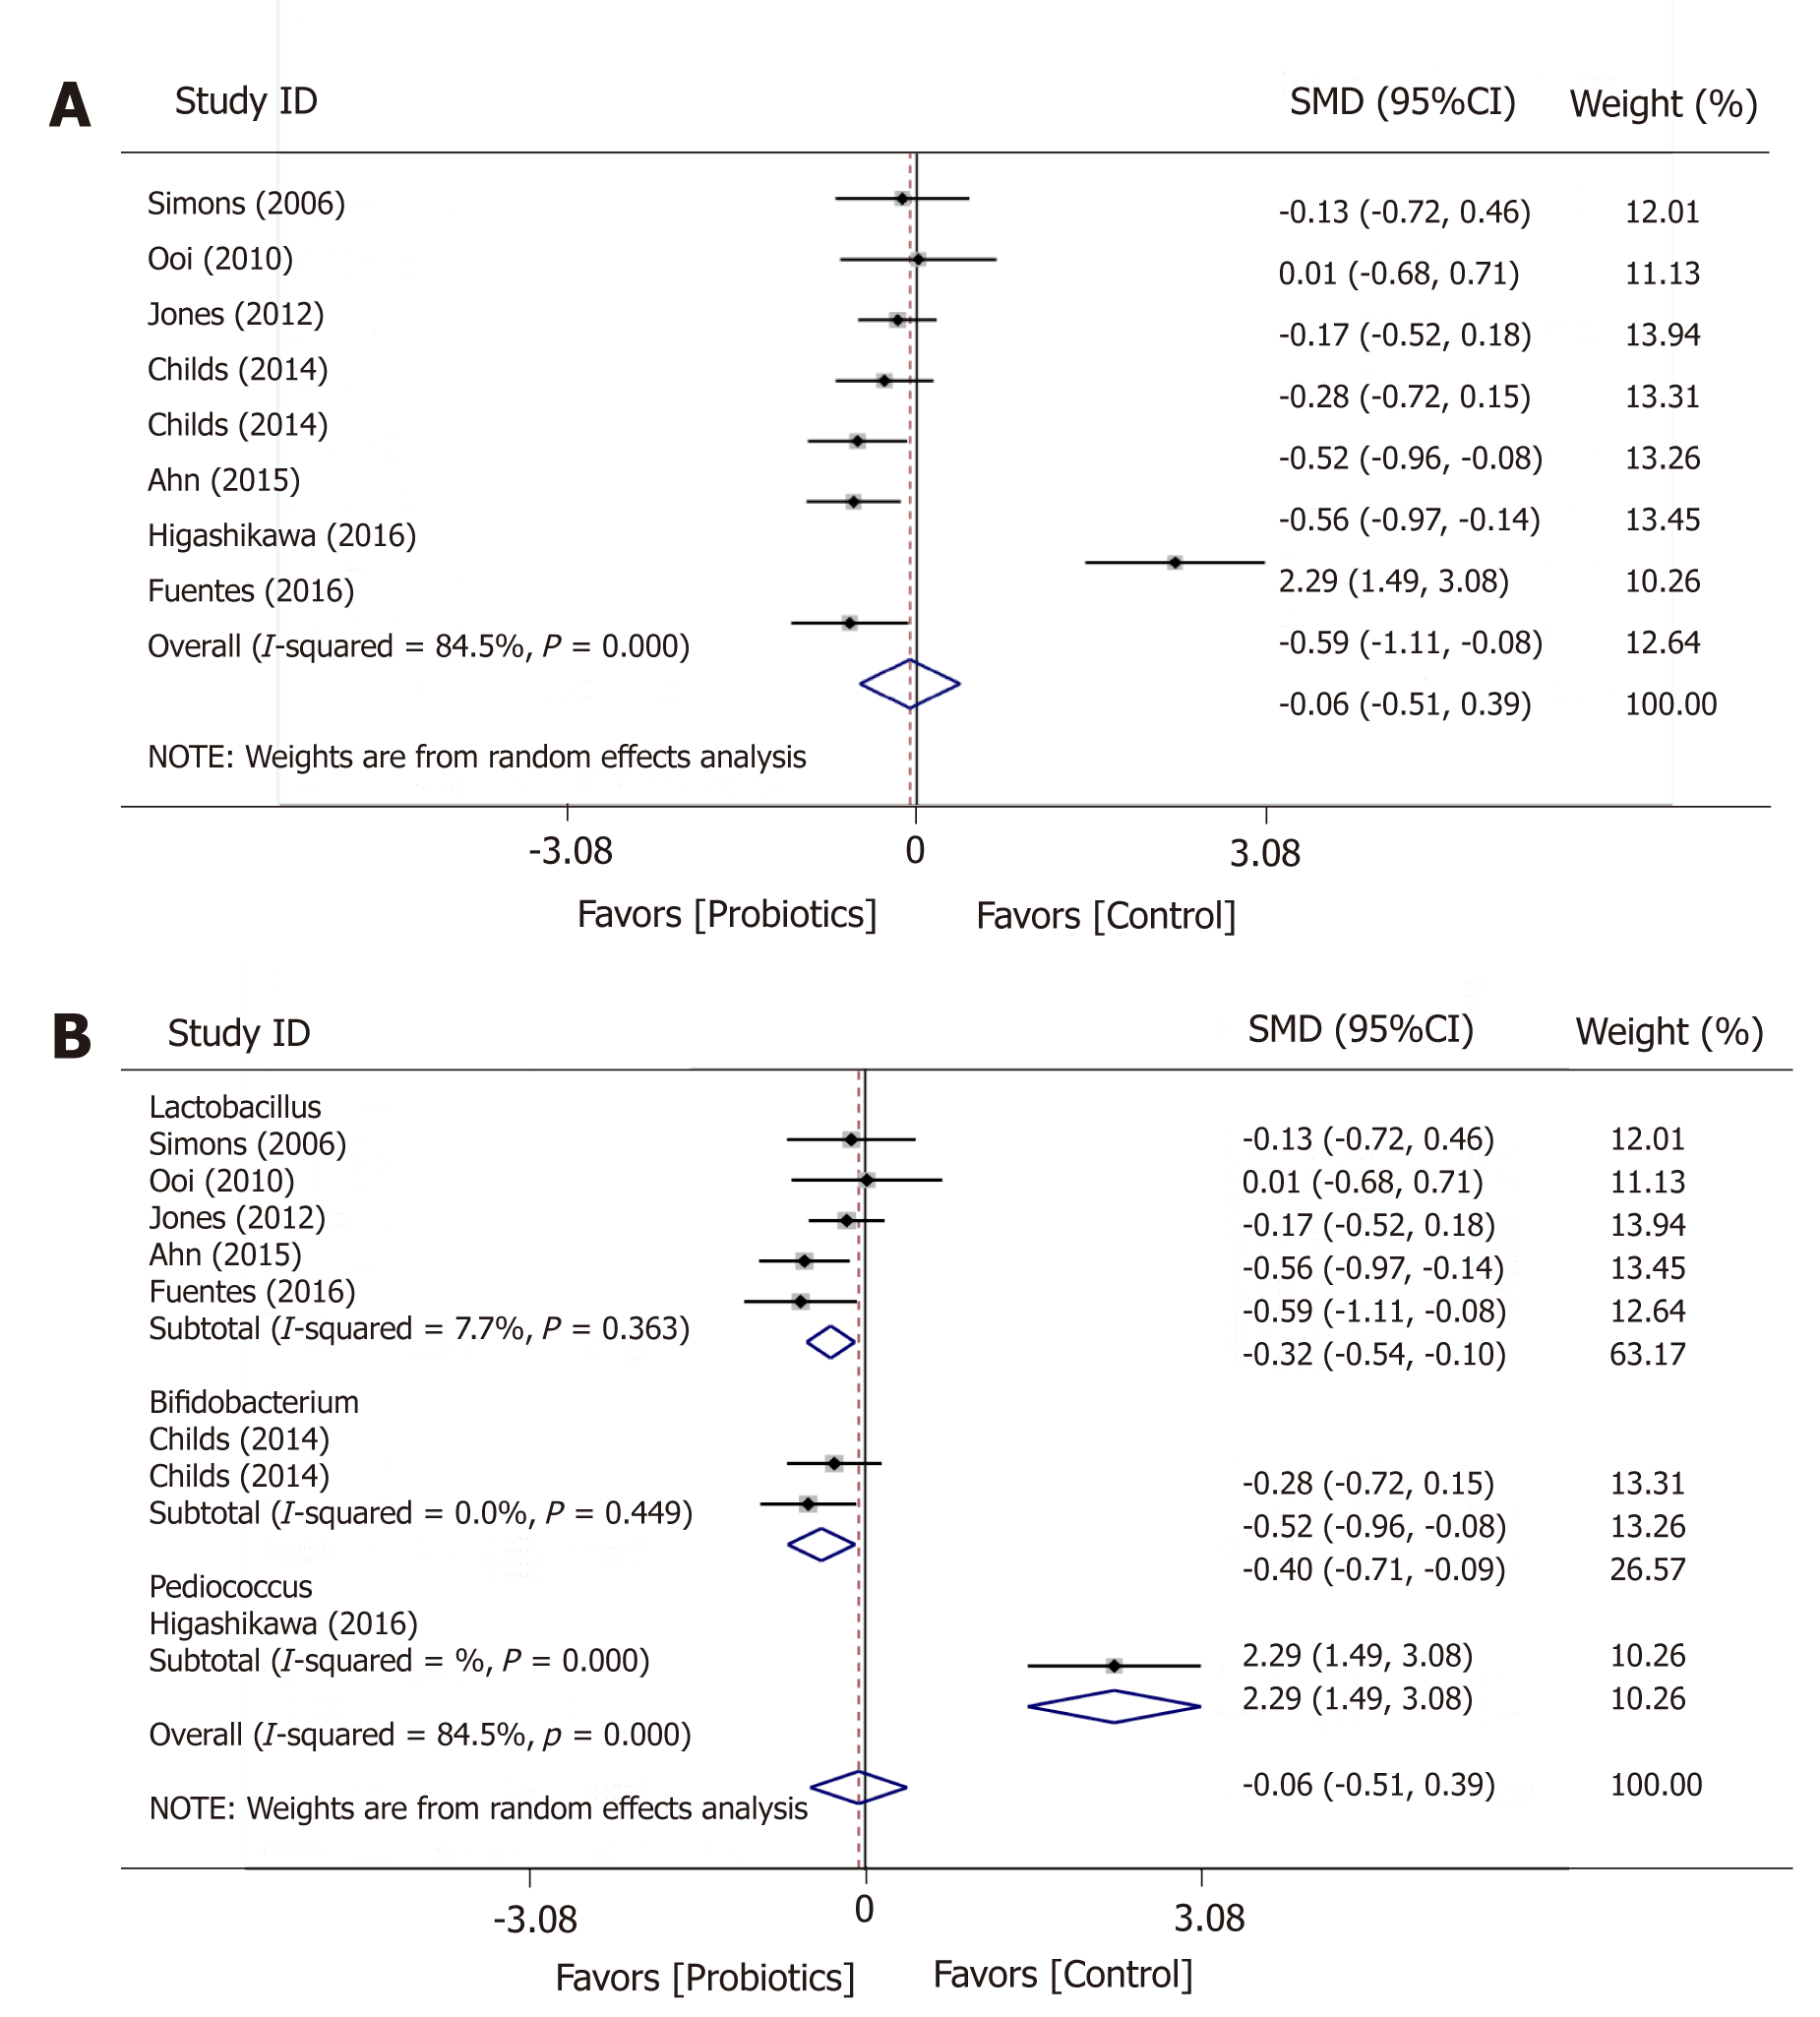
Figure 3 Meta-analysis forest plot concerning total cholesterol (A) and total cholesterol by genus (B).
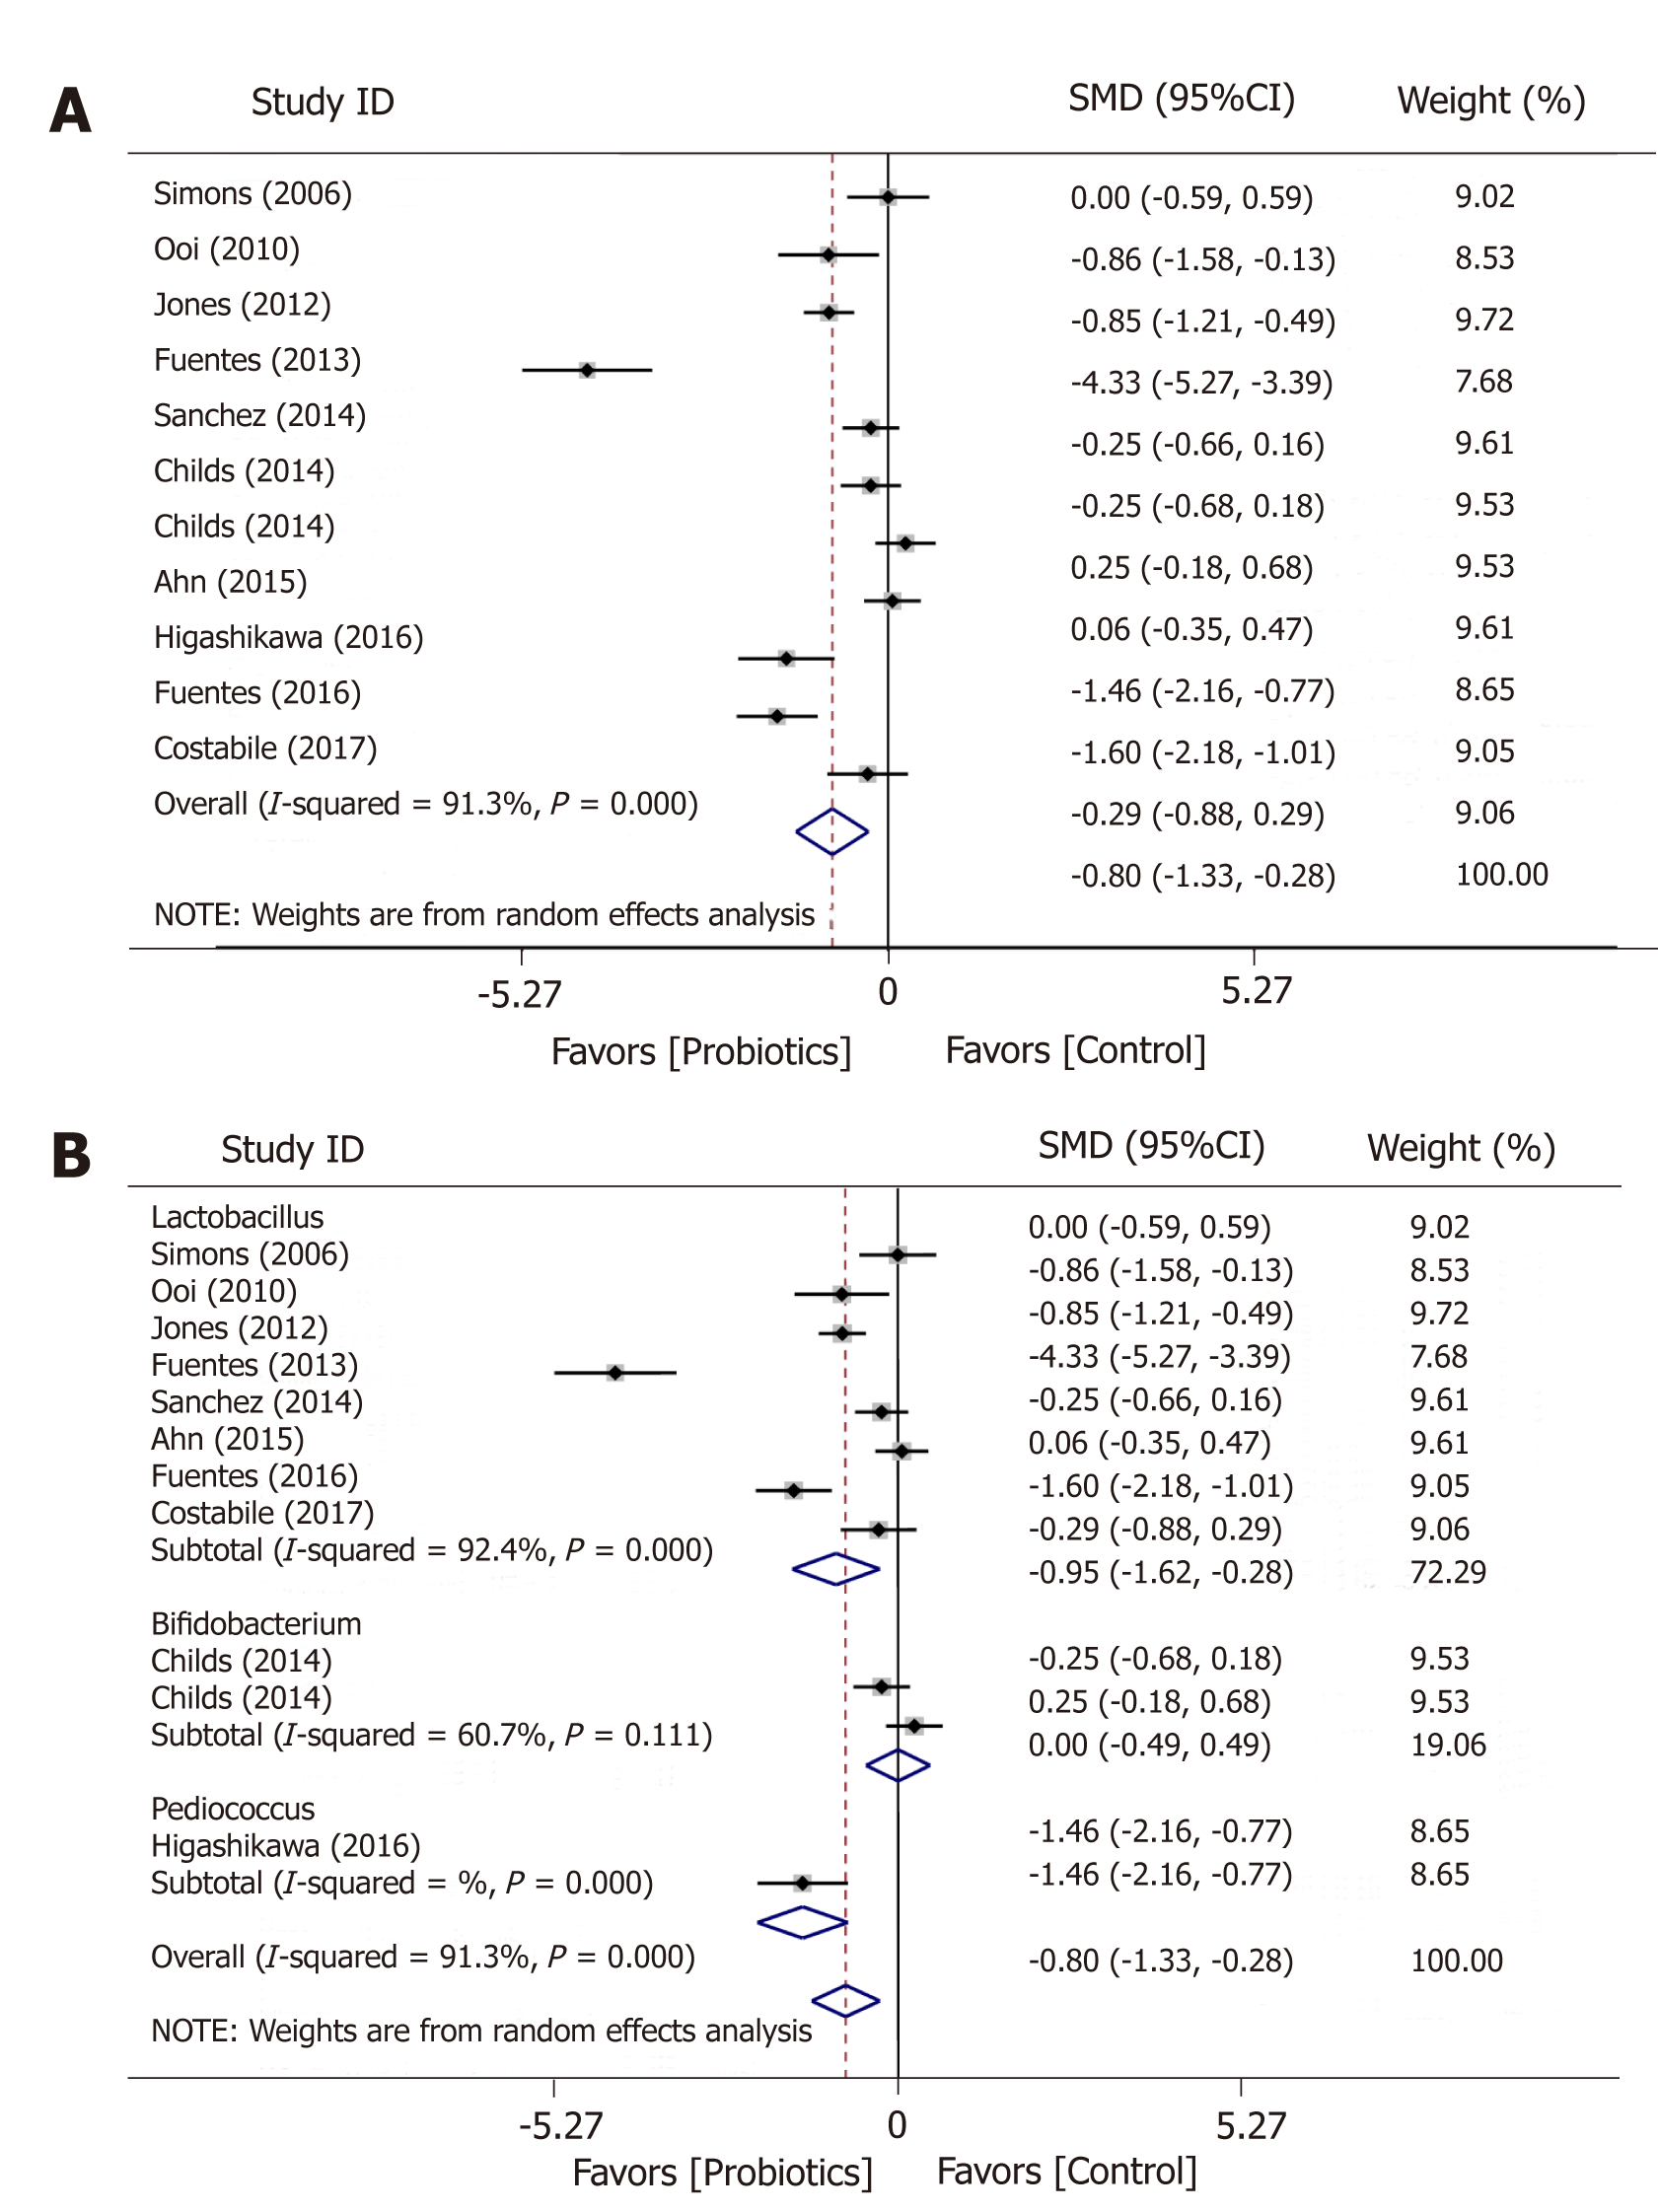
Figure 4 Meta-analysis forest plot concerning low density lipoprotein (A) and low density lipoprotein by genus (B).
Figure 5 Meta-analysis forest plot concerning high density lipoprotein (A) and high density lipoprotein by genus (B).
Figure 6 Meta-analysis forest plot concerning triglycerides (A) and triglycerides by genus (B).
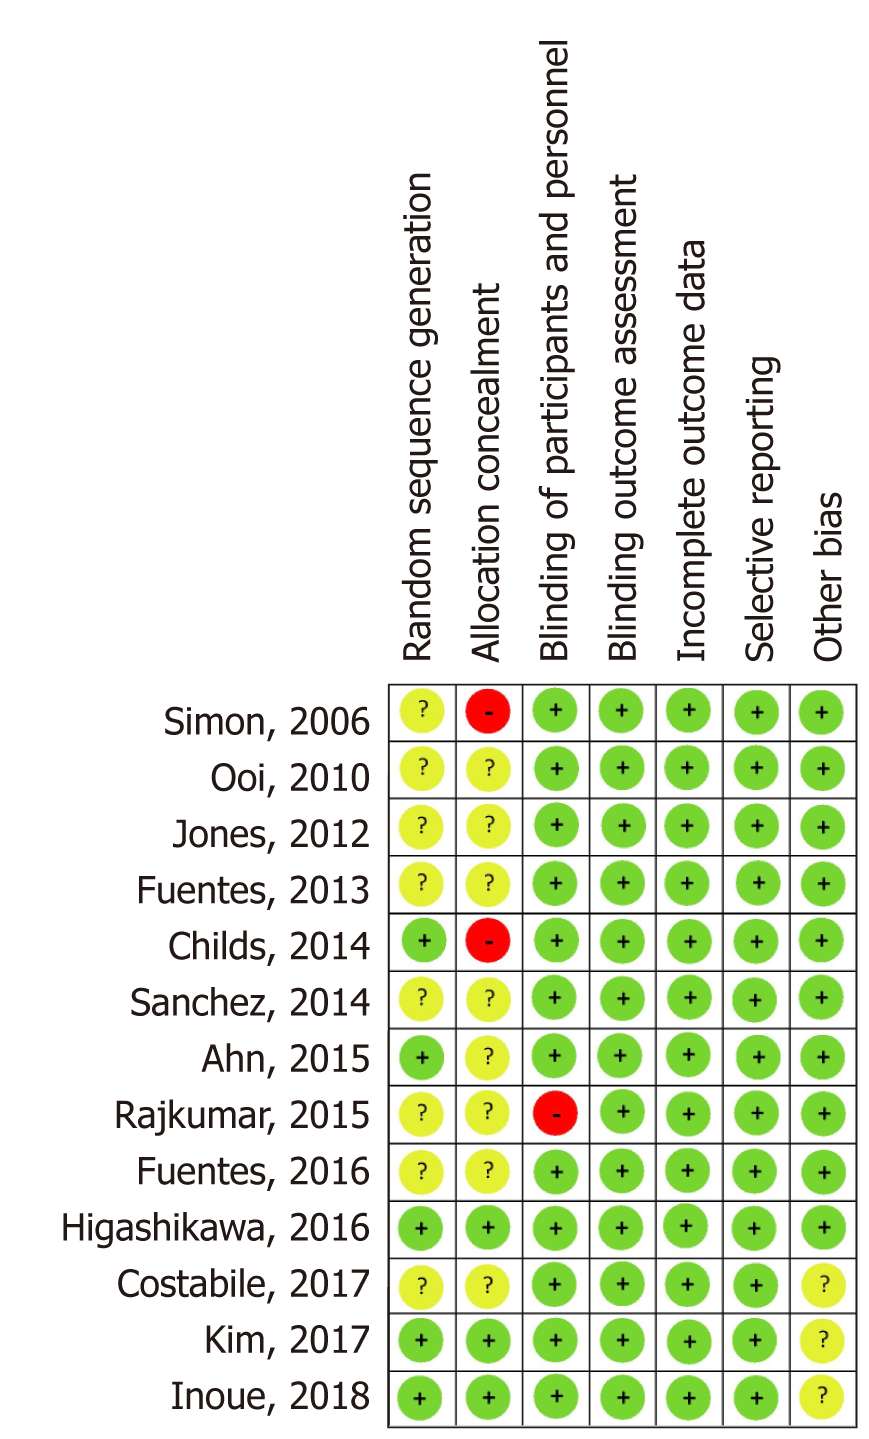
Figure 7 Risk of bias of the included studies.
- Citation: Pongpirul K, Janchot K, Dai Y. Single strain probiotics for dyslipidemia, fatty liver, and obesity: A systematic review and meta-analysis. World J Meta-Anal 2019; 7(6): 323-338
- URL: https://www.wjgnet.com/2308-3840/full/v7/i6/323.htm
- DOI: https://dx.doi.org/10.13105/wjma.v7.i6.323


