Copyright
©The Author(s) 2017.
World J Meta-Anal. Dec 26, 2017; 5(6): 150-166
Published online Dec 26, 2017. doi: 10.13105/wjma.v5.i6.150
Published online Dec 26, 2017. doi: 10.13105/wjma.v5.i6.150
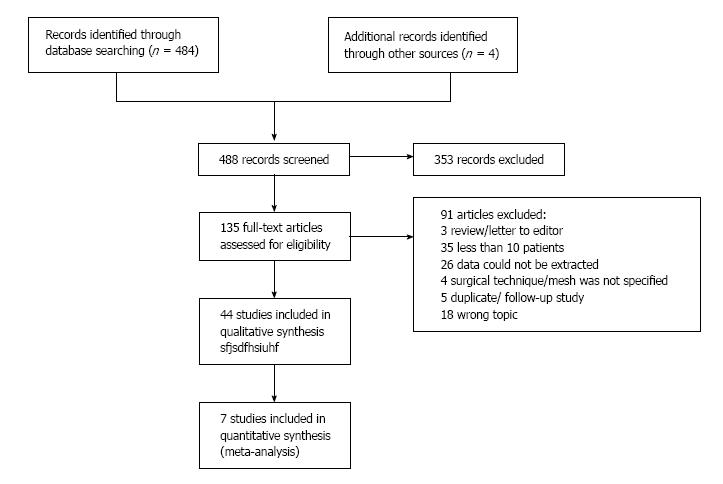
Figure 1 Search flow-chart following PRISMA.
Figure 2 Incidence of parastomal hernia after prophylactic mesh placement vs no mesh placement.
A: Random sequence generation (selection bias); B: Allocation concealment (selection bias); C: Blinding of participants and personnel (performance bias); D: Blinding of outcome assessment (detection bias); E: Incomplete outcome data (attrition bias); F: Selective reporting (reporting bias); G: Other bias.
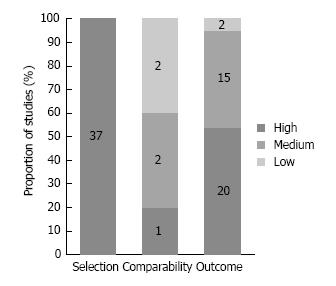
Figure 3 Quality assessment using the Newcastle-Ottawa Scale for risk of bias included in the systematic review.
The absolute numbers of the studies are shown in boxes.
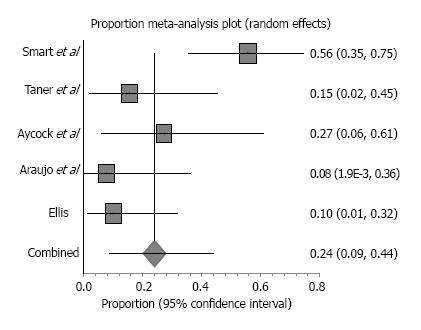
Figure 4 Proportion of hernia recurrences after biologic mesh repair of parastomal hernia.
The square shape represents the weight of the study, and the horizontal line through the square represents the confidence interval of the effect estimate (random effects model; Cochran’s Q test = 15.8; I2 = 74.7%; P = 0.0033).
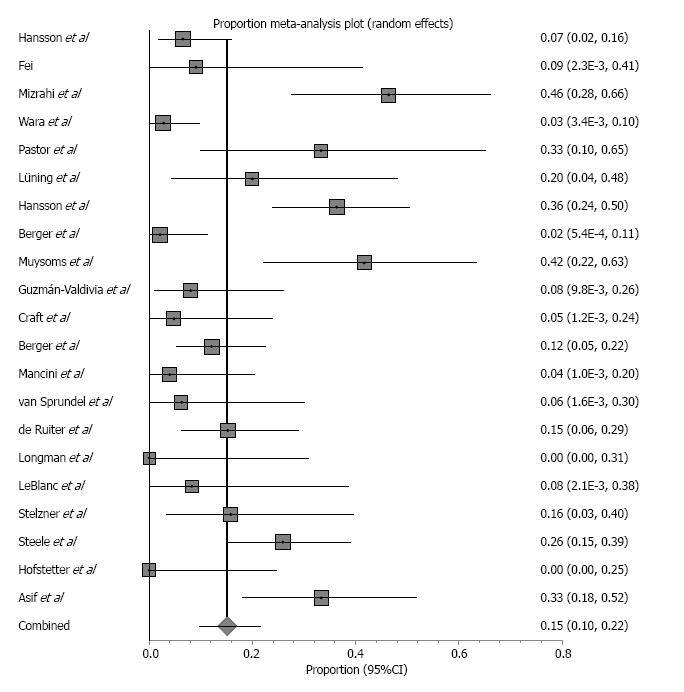
Figure 5 Proportion of hernia recurrences after synthetic mesh repair of parastomal hernia.
The square shape represents the weight of the study, and the horizontal line through the square represents the confidence interval of the effect estimate (random-effects model; Cochran’s Q test = 90.8; I2 = 78%; P ≤ 0.0001).
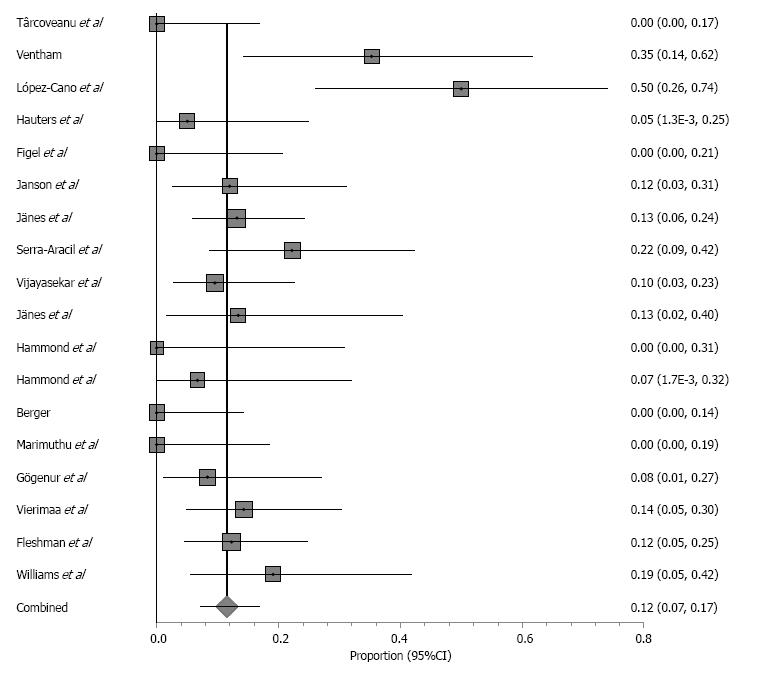
Figure 6 Proportion of hernia occurrence after prophylactic mesh placement.
The square shape represents the weight of the study, and the horizontal line through the square represents the confidence interval of the effect estimate (random-effects model; Cochran’s Q test = 45.5; I2 = 62.7%; P = 0.0002).
- Citation: Knaapen L, Buyne O, van Goor H, Slater NJ. Synthetic vs biologic mesh for the repair and prevention of parastomal hernia. World J Meta-Anal 2017; 5(6): 150-166
- URL: https://www.wjgnet.com/2308-3840/full/v5/i6/150.htm
- DOI: https://dx.doi.org/10.13105/wjma.v5.i6.150


