Copyright
©The Author(s) 2017.
World J Meta-Anal. Dec 26, 2017; 5(6): 150-166
Published online Dec 26, 2017. doi: 10.13105/wjma.v5.i6.150
Published online Dec 26, 2017. doi: 10.13105/wjma.v5.i6.150
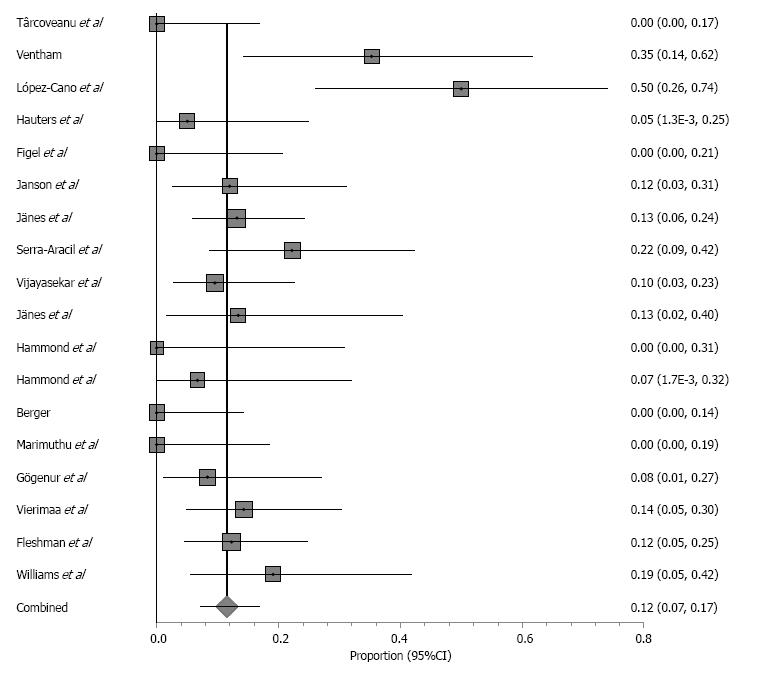
Figure 6 Proportion of hernia occurrence after prophylactic mesh placement.
The square shape represents the weight of the study, and the horizontal line through the square represents the confidence interval of the effect estimate (random-effects model; Cochran’s Q test = 45.5; I2 = 62.7%; P = 0.0002).
- Citation: Knaapen L, Buyne O, van Goor H, Slater NJ. Synthetic vs biologic mesh for the repair and prevention of parastomal hernia. World J Meta-Anal 2017; 5(6): 150-166
- URL: https://www.wjgnet.com/2308-3840/full/v5/i6/150.htm
- DOI: https://dx.doi.org/10.13105/wjma.v5.i6.150


