Copyright
©The Author(s) 2017.
World J Meta-Anal. Jun 26, 2017; 5(3): 71-79
Published online Jun 26, 2017. doi: 10.13105/wjma.v5.i3.71
Published online Jun 26, 2017. doi: 10.13105/wjma.v5.i3.71
Figure 1 Normal images of hepatic diffusion tensor imaging.
A: Diffusion image (b value of 0), mainly presenting the anatomic profiles; B: Fractional anisotropy map of the liver, presenting as the pseudo-colored image; C: Apparent diffusion coefficient map of the liver, presenting as the pseudo-colored image as well (Li et al[10], 2015; open access from PlosOne, permission confirmed).
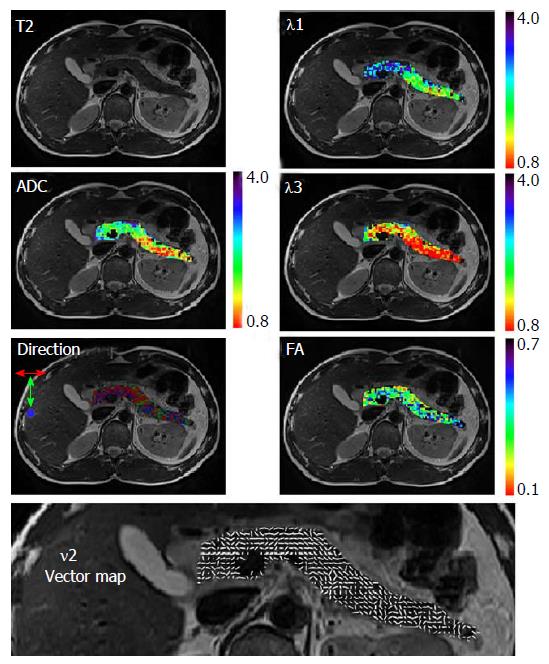
Figure 2 Normal images of pancreatic diffusion tensor imaging.
Maps were overlaid on the corresponding T2 weighted image. The direction map presents in three colors the direction of the 1st principal eigenvector; red: Left to right direction; green: Head to feet direction; and blue: Anterior to posterior direction. Vector map presents in white sticks the direction of the 1st principal eigenvector (Nissan et al[17], 2014; open access from PlosOne, permission confirmed). FA: Fractional anisotropy; ADC: Apparent diffusion coefficient.
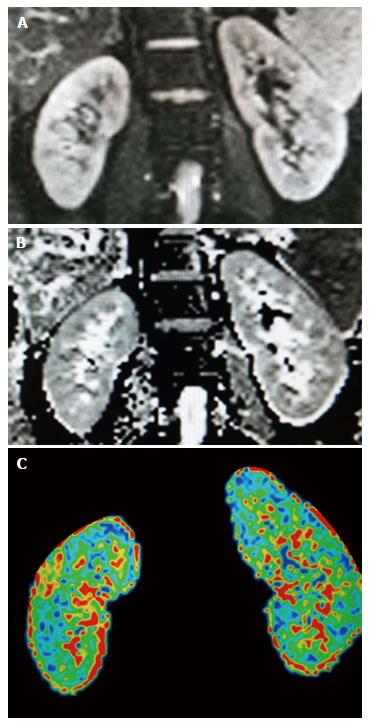
Figure 3 Normal images of renal diffusion tensor imaging.
A: Diffusion image (b-value of 0), mainly presenting the anatomic profiles; B: Apparent diffusion coefficient map of the kidneys; C: Fractional anisotropy map of the kidneys, presenting as the pseudo-colored image.
- Citation: Wang YT, Li YC, Kong WF, Yin LL, Pu H. Diffusion tensor imaging beyond brains: Applications in abdominal and pelvic organs. World J Meta-Anal 2017; 5(3): 71-79
- URL: https://www.wjgnet.com/2308-3840/full/v5/i3/71.htm
- DOI: https://dx.doi.org/10.13105/wjma.v5.i3.71


