Copyright
©The Author(s) 2016.
World J Meta-Anal. Aug 26, 2016; 4(4): 95-104
Published online Aug 26, 2016. doi: 10.13105/wjma.v4.i4.95
Published online Aug 26, 2016. doi: 10.13105/wjma.v4.i4.95
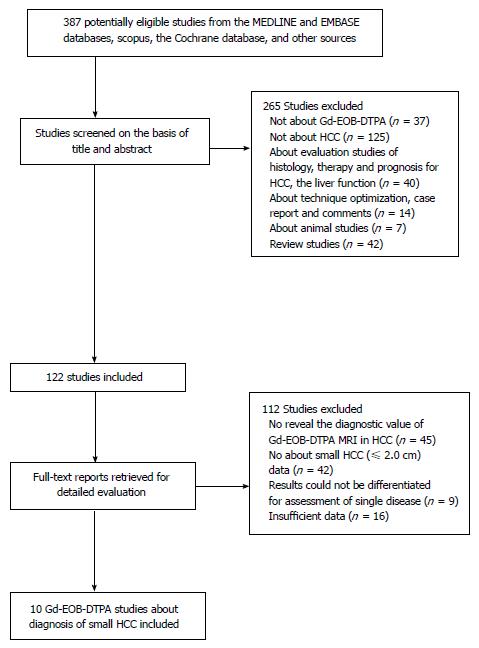
Figure 1 Flow chart for articles identified and included in this meta-analysis.
HCC: Hepatocellular carcinoma.
Figure 2 Grouped bar charts showing results of study quality assessment with the QUADAS-2 tool.
The charts show the cumulative results of the 10 included studies in terms of risk of bias (left) and concerns regarding applicability (right) according to each QUADAS-2 domain.
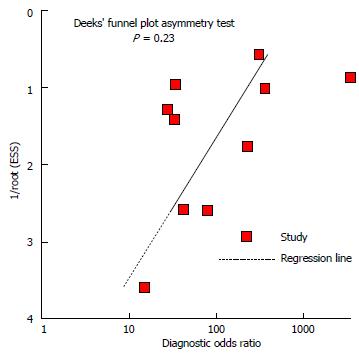
Figure 3 Results of Deeks’ funnel plot asymmetry test for publication bias.
The nonsignificant slope indicates that no significant bias was found. ESS: Effective sample size (P = 0.23).
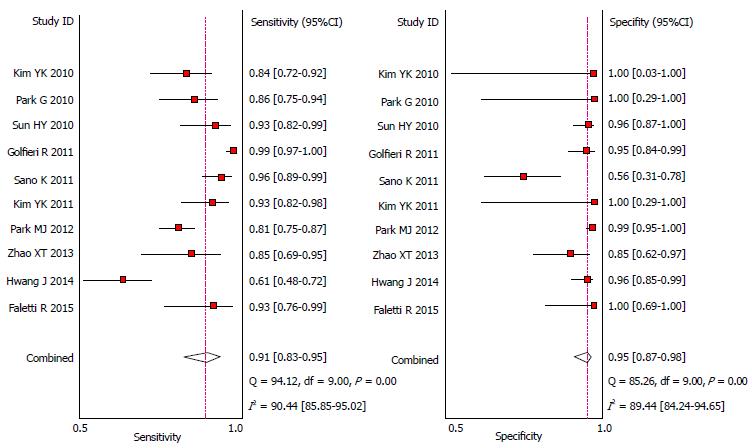
Figure 4 Forest plot of pooled sensitivity and specificity of gadoxetic acid-enhanced magnetic resonance imaging in detecting small hepatocellular carcinoma among patients with chronic liver disease.
Summary sensitivity and specificity were 0.91 (95%CI: 0.83-0.95) and 0.95 (95%CI: 0.87-0.98), respectively.
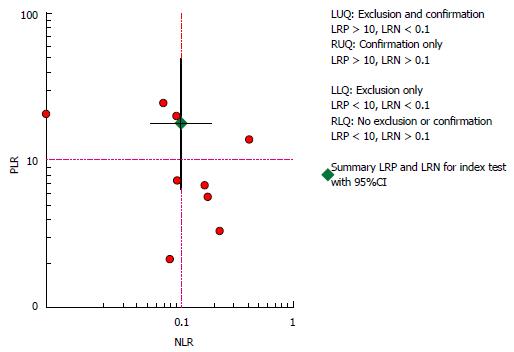
Figure 5 Scattergram of positive likelihood ratio and negative likelihood ratio.
Pooled estimates for gadoxetic acid-enhanced MRI in the detection of small HCC were: PLR of 18.1 (95%CI: 6.6-49.4) and NLR of 0.10 (95%CI: 0.05-0.19). PLR: Positive likelihood ratio; NLR: Negative likelihood ratio.
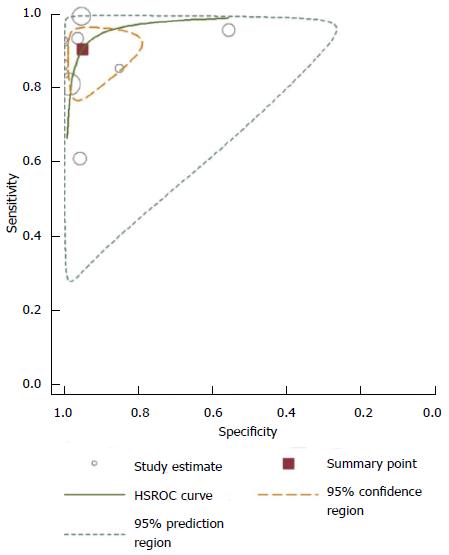
Figure 6 Hierarchical summary receiver operating characteristic plot of per-lesion diagnostic accuracy for gadoxetic acid-enhanced magnetic resonance imaging detection of small hepatocellular carcinoma in patients with chronic liver disease for the 10 included studies.
The 95% confidence region and 95% prediction region around the pooled estimates illustrate the precision with which the pooled values were estimated (confidence ellipse of a mean) and to show the extent of between-study variation (prediction ellipse; likely range of values for a new study). HSROC: Hierarchical summary receiver operator characteristic.
- Citation: Shan Y, Gao J, Zeng MS, Lin J, Xu PJ. Gadoxetic acid-enhanced magnetic resonance imaging for the detection of small hepatocellular carcinoma (≤ 2.0 cm) in patients with chronic liver disease: A meta-analysis. World J Meta-Anal 2016; 4(4): 95-104
- URL: https://www.wjgnet.com/2308-3840/full/v4/i4/95.htm
- DOI: https://dx.doi.org/10.13105/wjma.v4.i4.95


