Copyright
©2013 Baishideng.
World J Meta-Anal. Aug 26, 2013; 1(2): 90-96
Published online Aug 26, 2013. doi: 10.13105/wjma.v1.i2.90
Published online Aug 26, 2013. doi: 10.13105/wjma.v1.i2.90
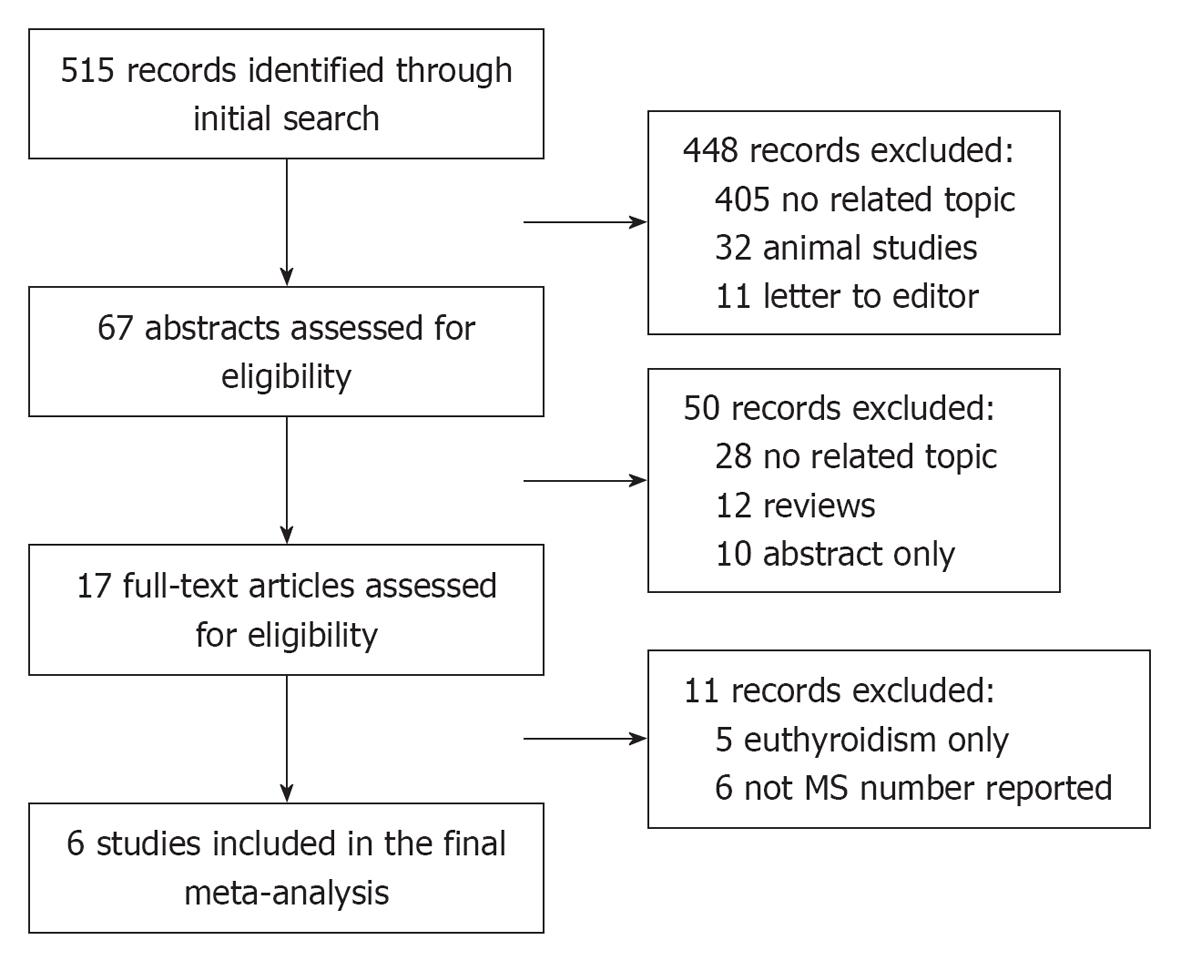
Figure 1 Flowchart of study selection.
MS: Metabolic syndrome.
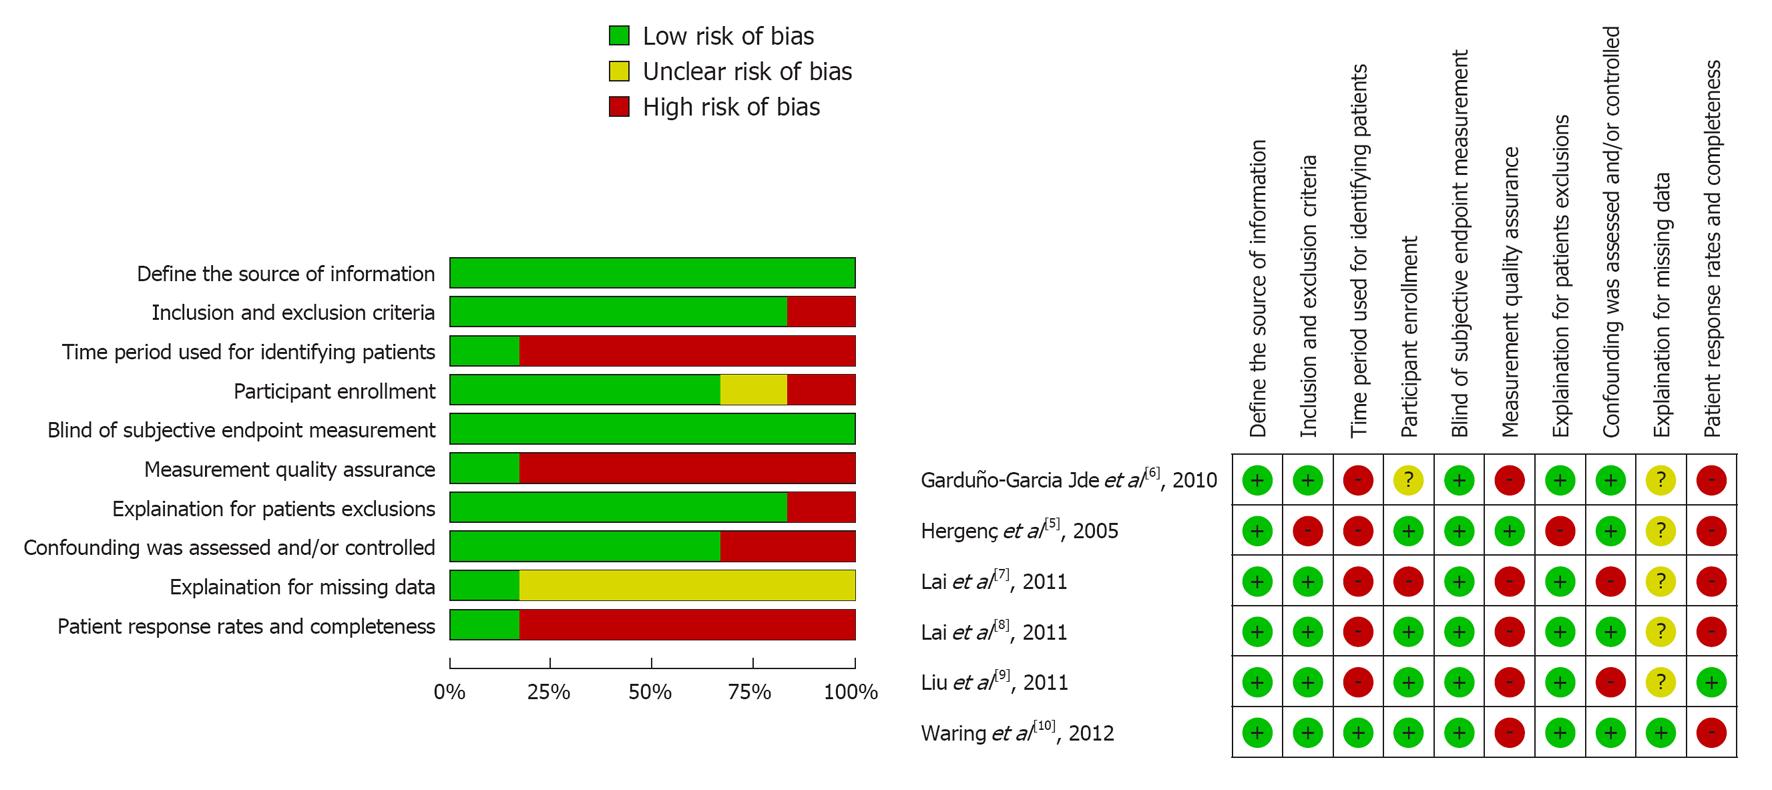
Figure 2 Risk of bias assessment.
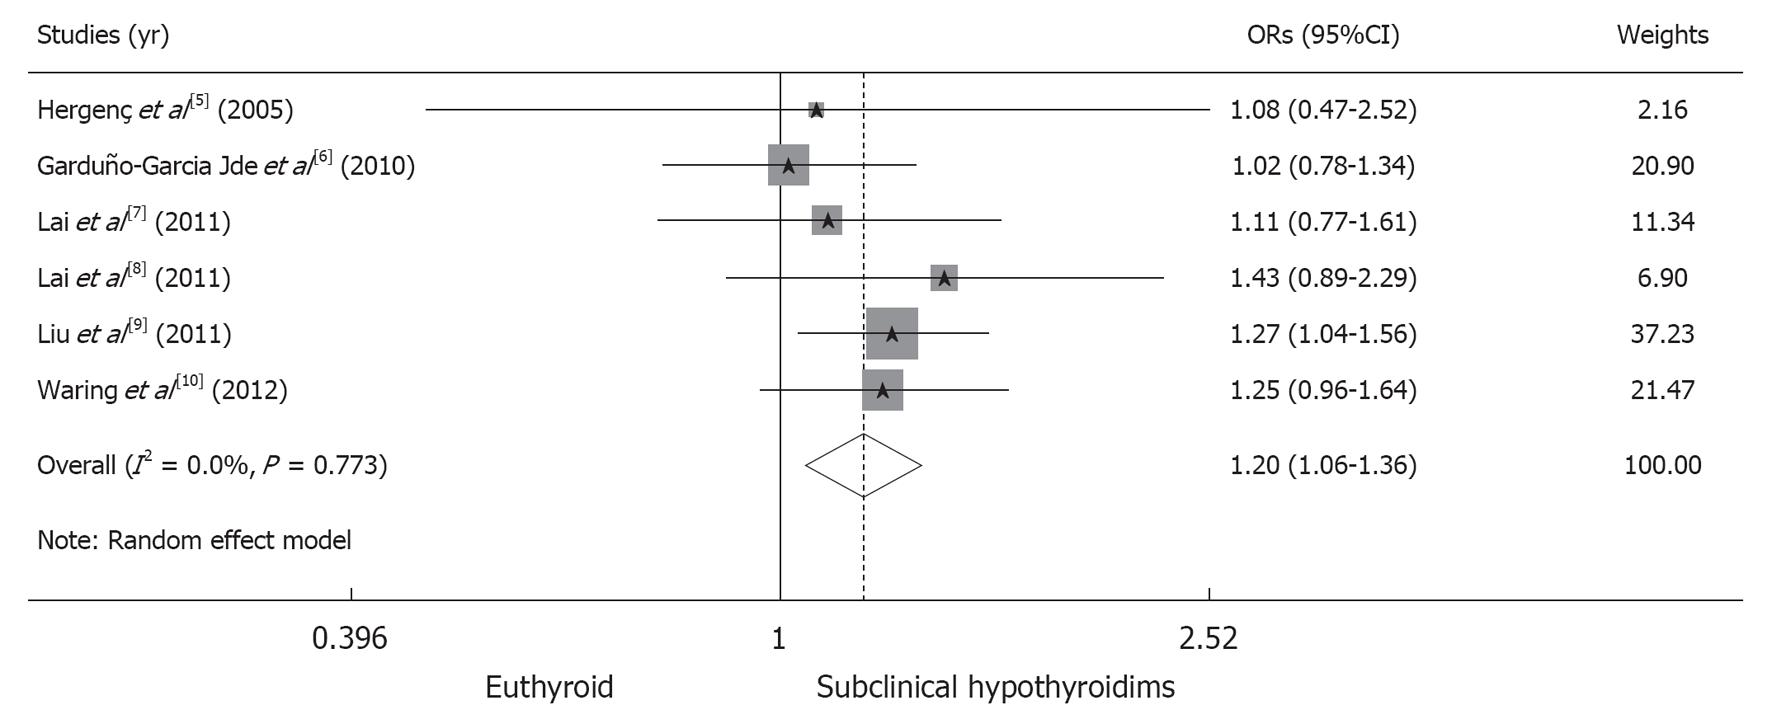
Figure 3 Subclinical hypothyroidism vs euthyroid on pooled ORs for the metabolic syndrome.
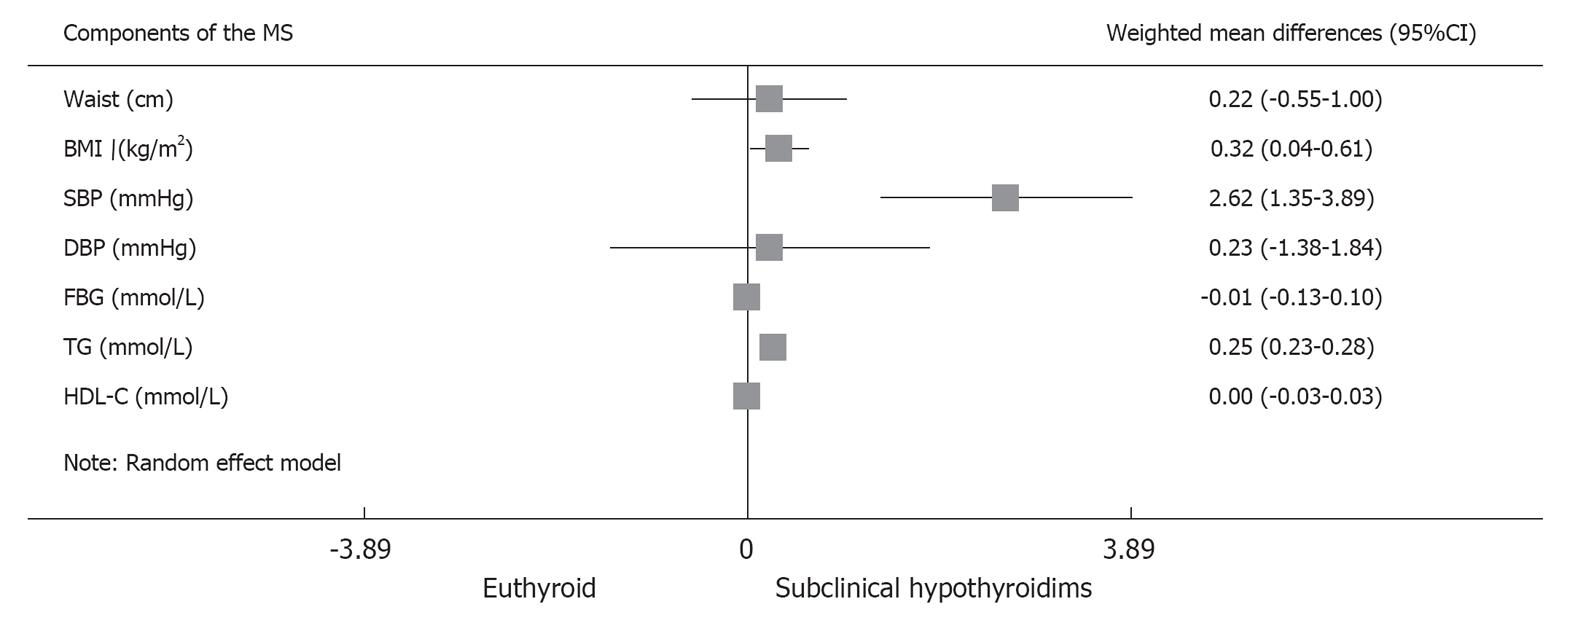
Figure 4 Weighted mean differences for the components of the metabolic syndrome.
MS: Metabolic syndrome; BMI: Body mass index; SBP: Systolic blood pressure; DBP: Diastolic blood pressure; FBG: Fasting blood glucose; TG: Triglyceride; HDL-C: High-density lipoprotein cholesterol.
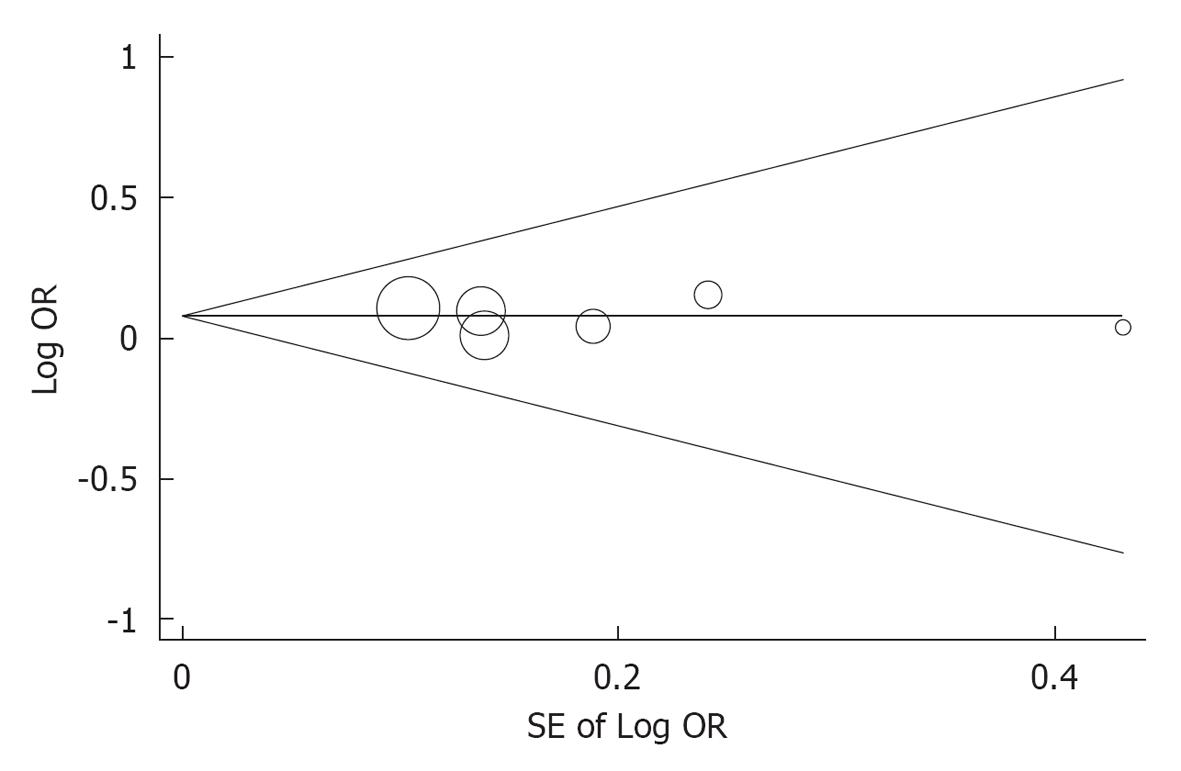
Figure 5 Begg’s funnel plot with pseudo 95%CI for publication bias.
- Citation: Ye YC, Xie HZ, Zhao XL, Zhang SY. Subclinical hypothyroidism and the metabolic syndrome: A meta-analysis of cross-sectional studies. World J Meta-Anal 2013; 1(2): 90-96
- URL: https://www.wjgnet.com/2308-3840/full/v1/i2/90.htm
- DOI: https://dx.doi.org/10.13105/wjma.v1.i2.90


