Copyright
©The Author(s) 2022.
World J Methodol. May 20, 2022; 12(3): 148-163
Published online May 20, 2022. doi: 10.5662/wjm.v12.i3.148
Published online May 20, 2022. doi: 10.5662/wjm.v12.i3.148
Figure 1 The threshold approach to clinical decision-making.
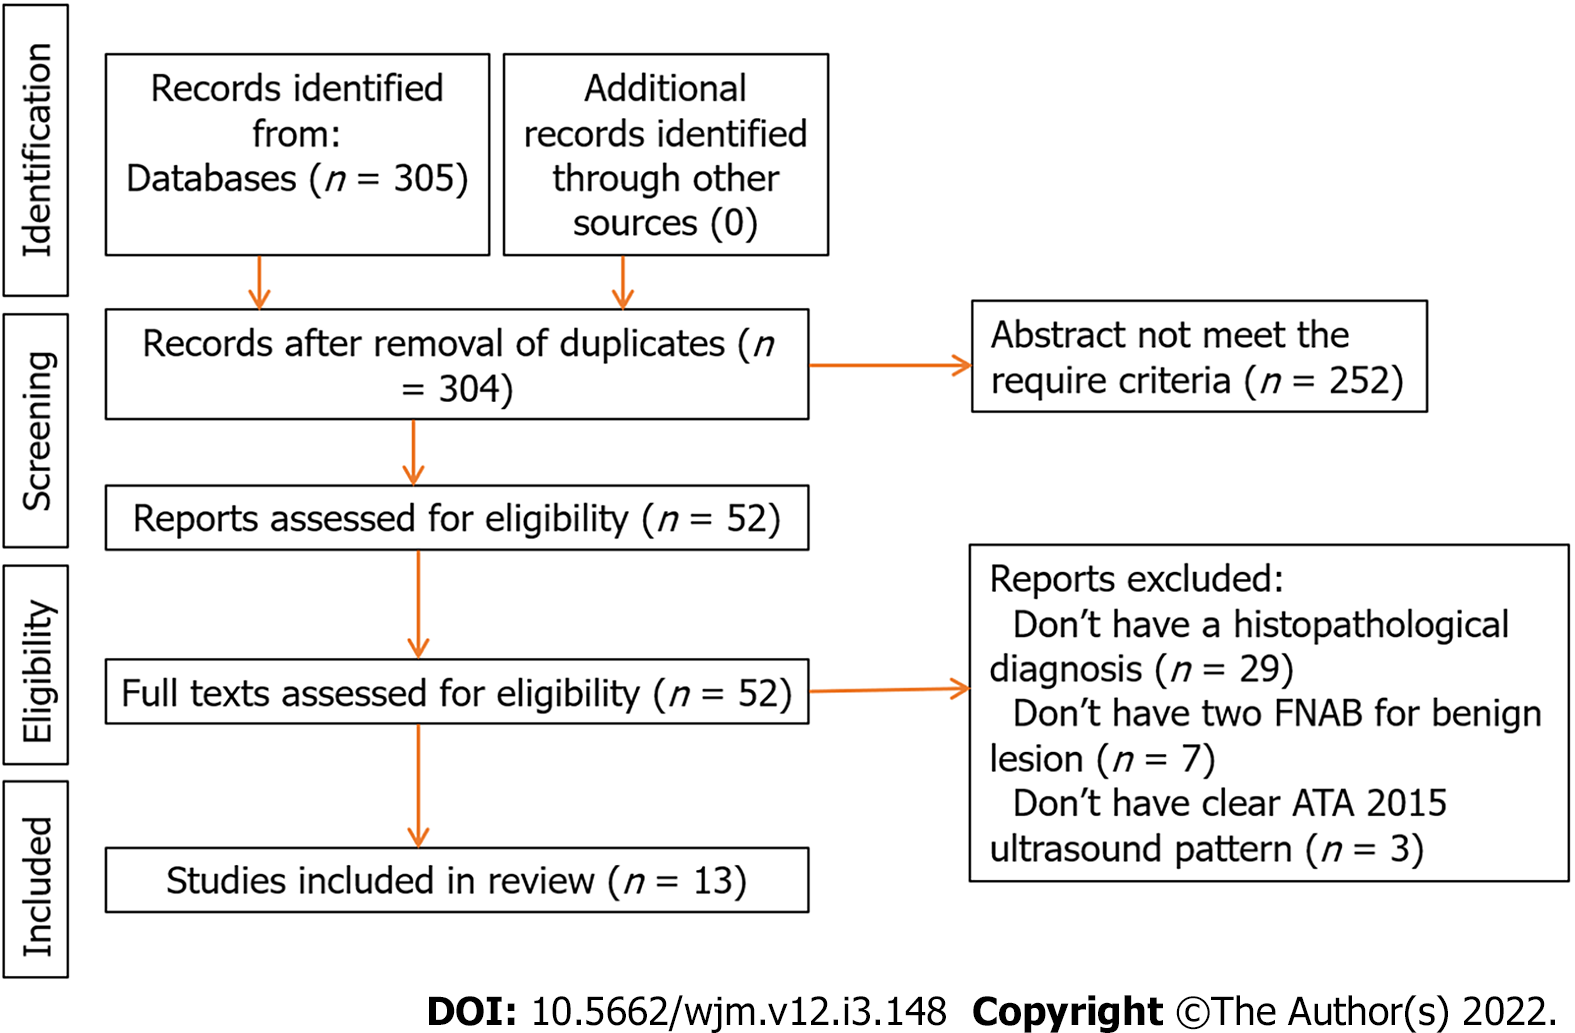
Figure 2 Flowchart of study selection process.
Figure 3 Test-treatment threshold formula.
Ttrx: Test-treatment threshold; Pneg/nd: Probability of a negative result in patients without disease; Rrx: Risk of treatment in patients without disease; Rt: Risk of diagnostic test; Pneg/d: Probability of a negative result in patients with disease; Brx: Benefit of treatment in patients with disease.
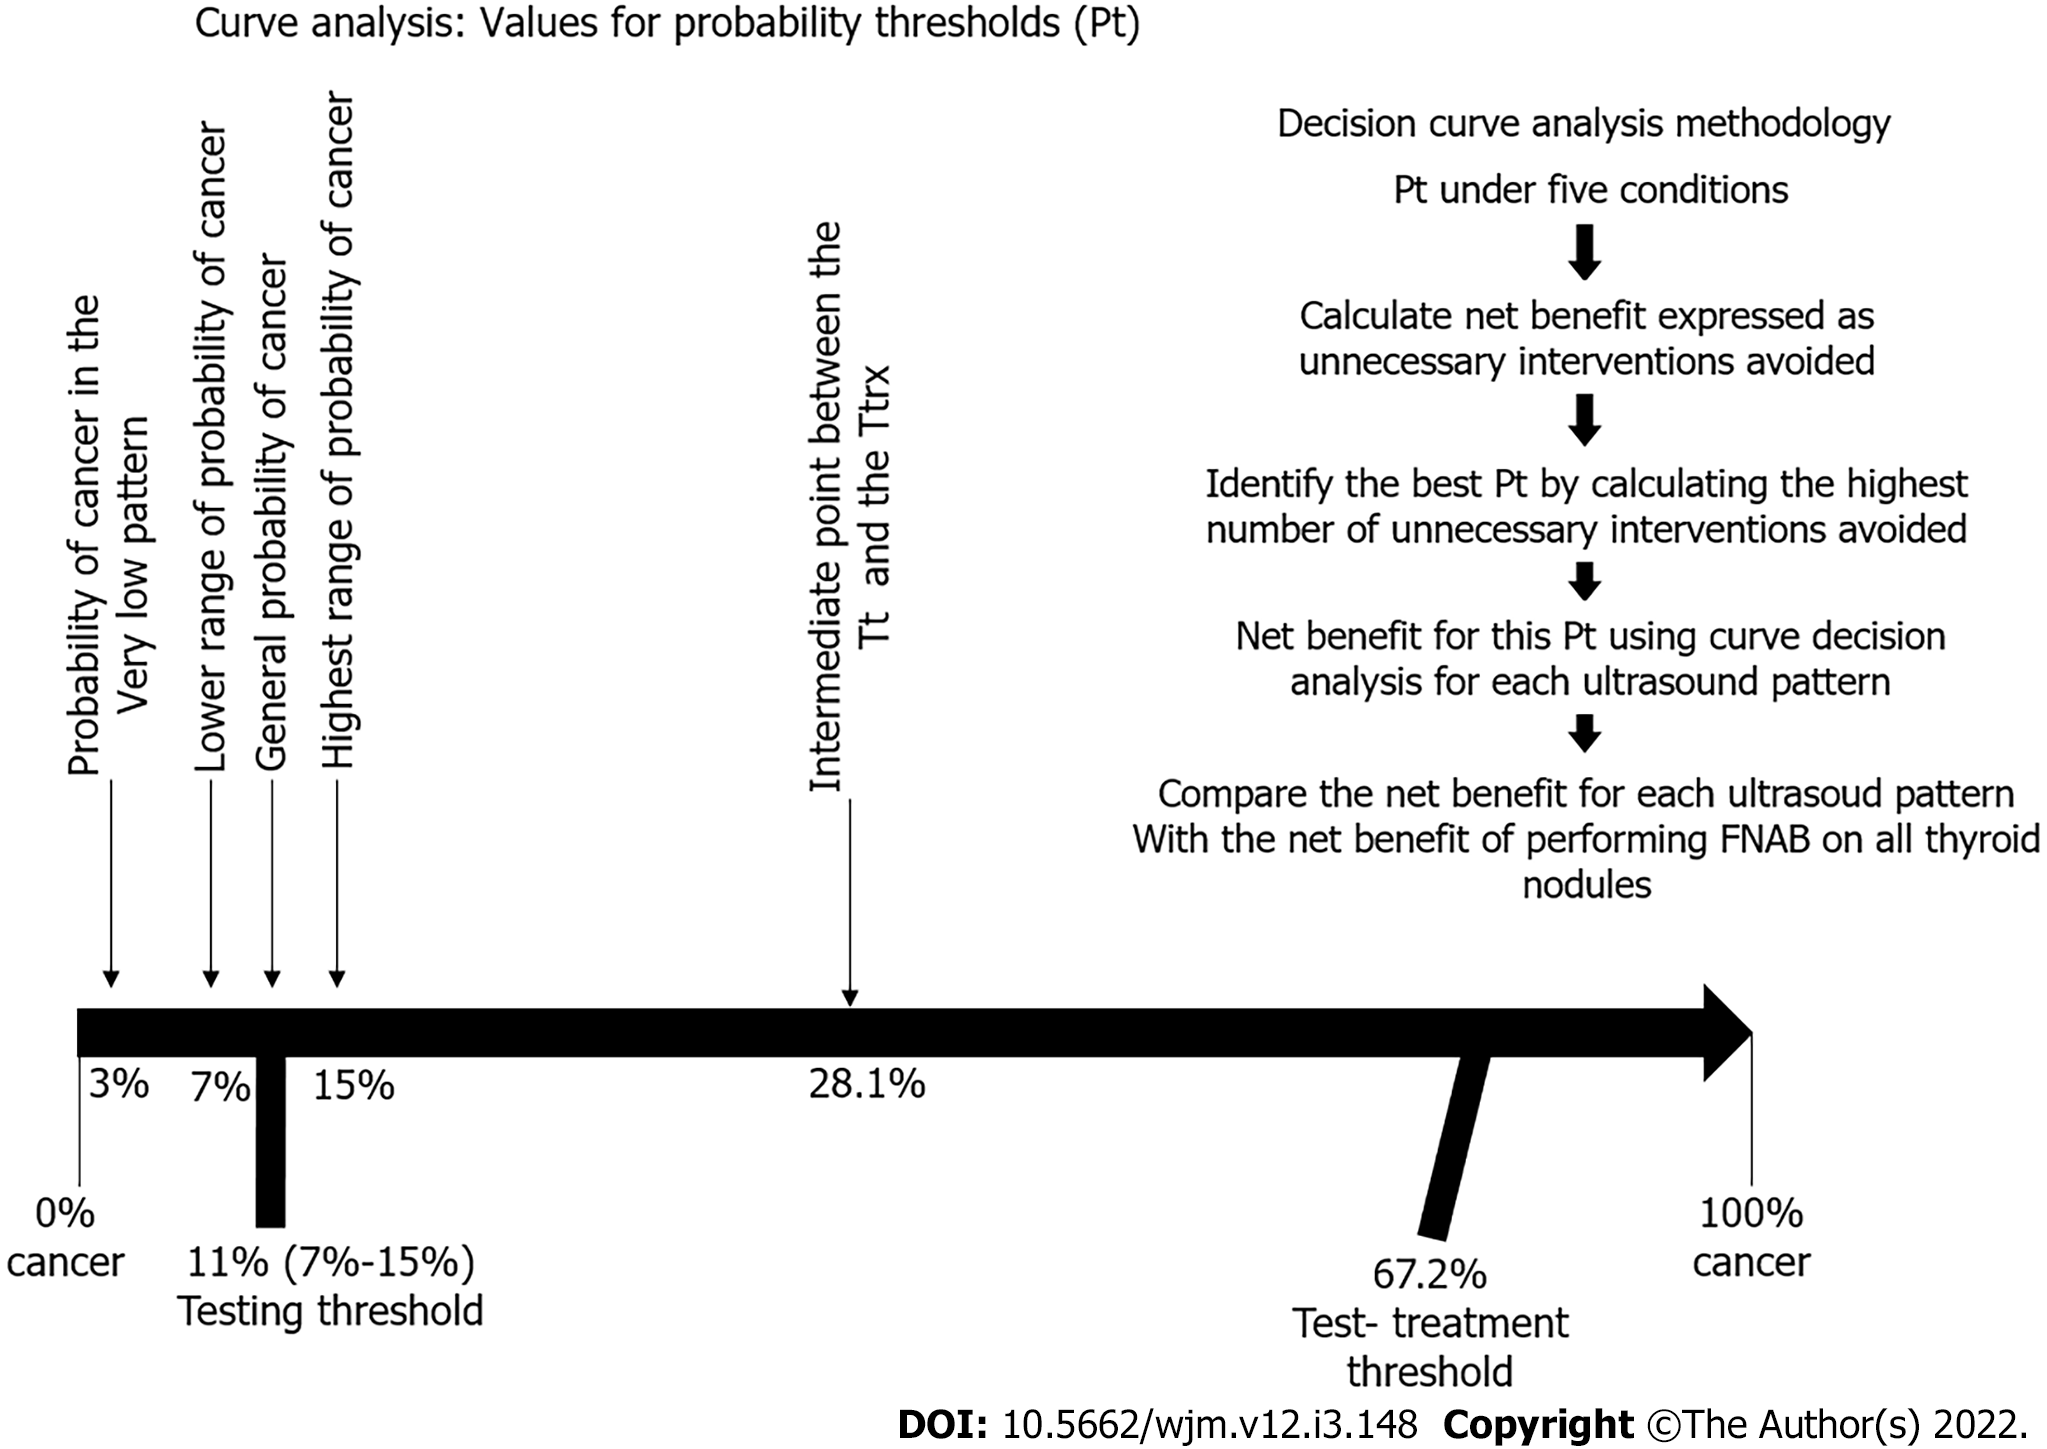
Figure 4 Decision curve analysis methodology.
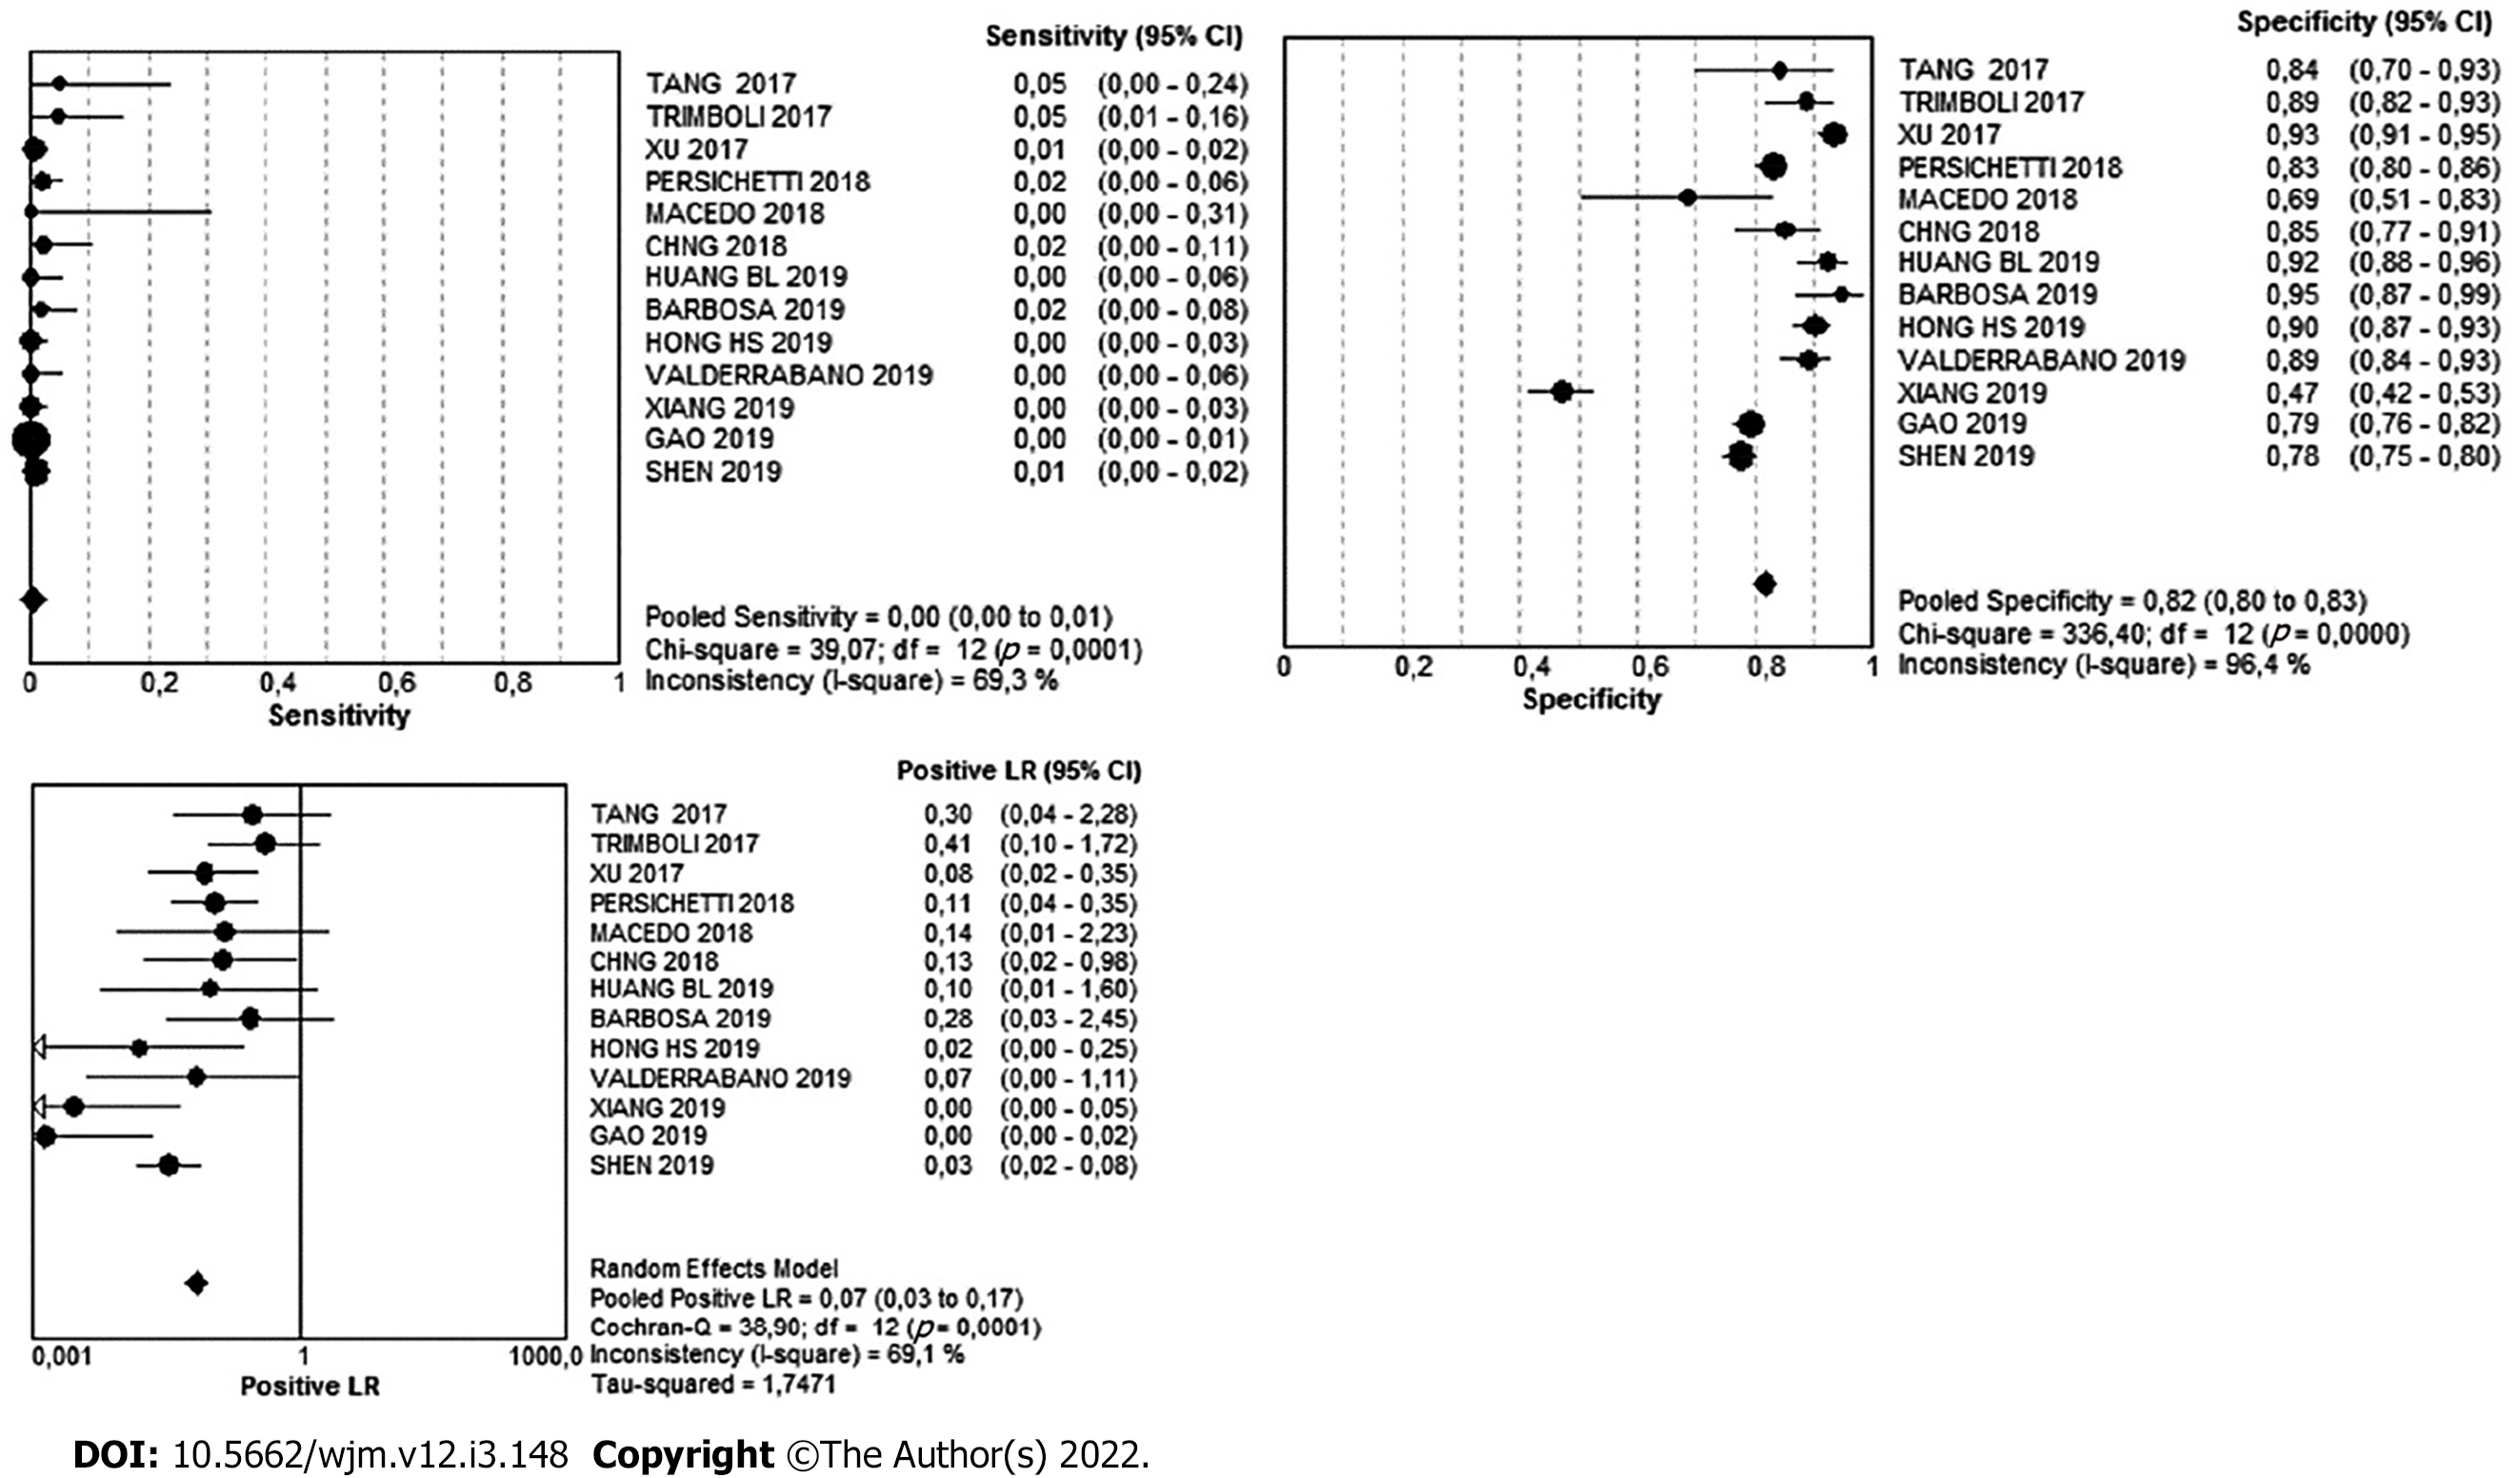
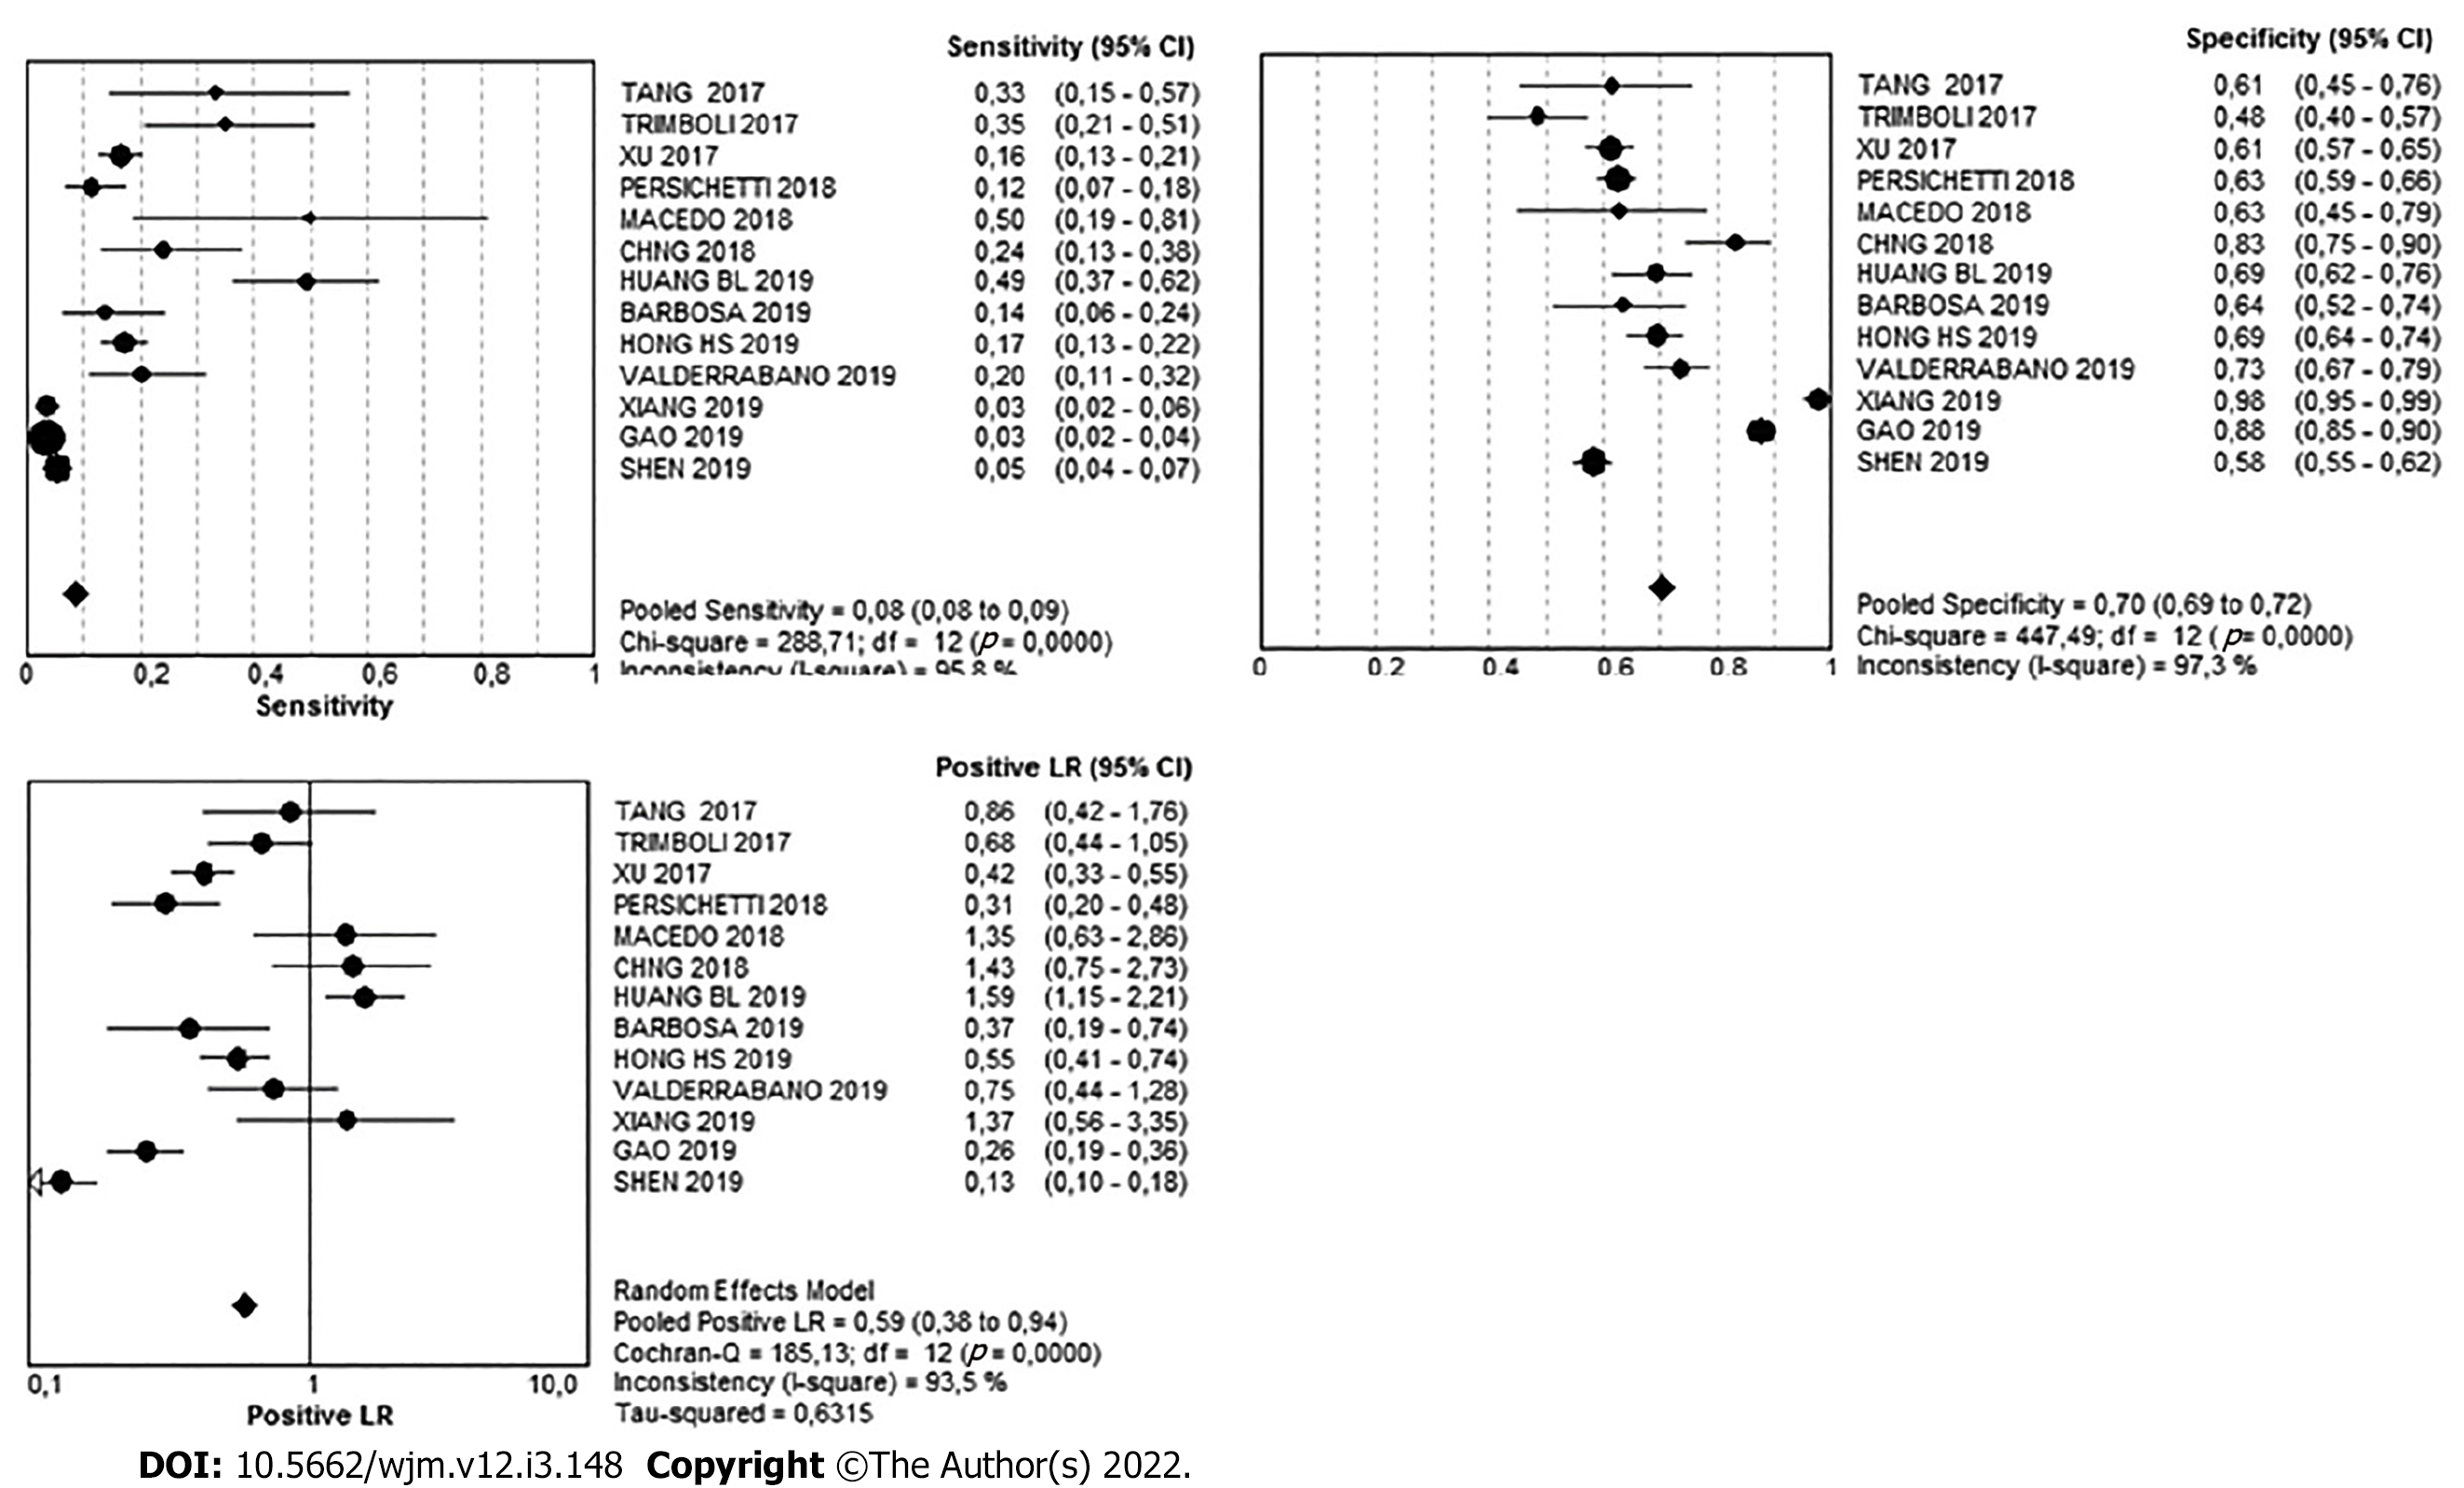
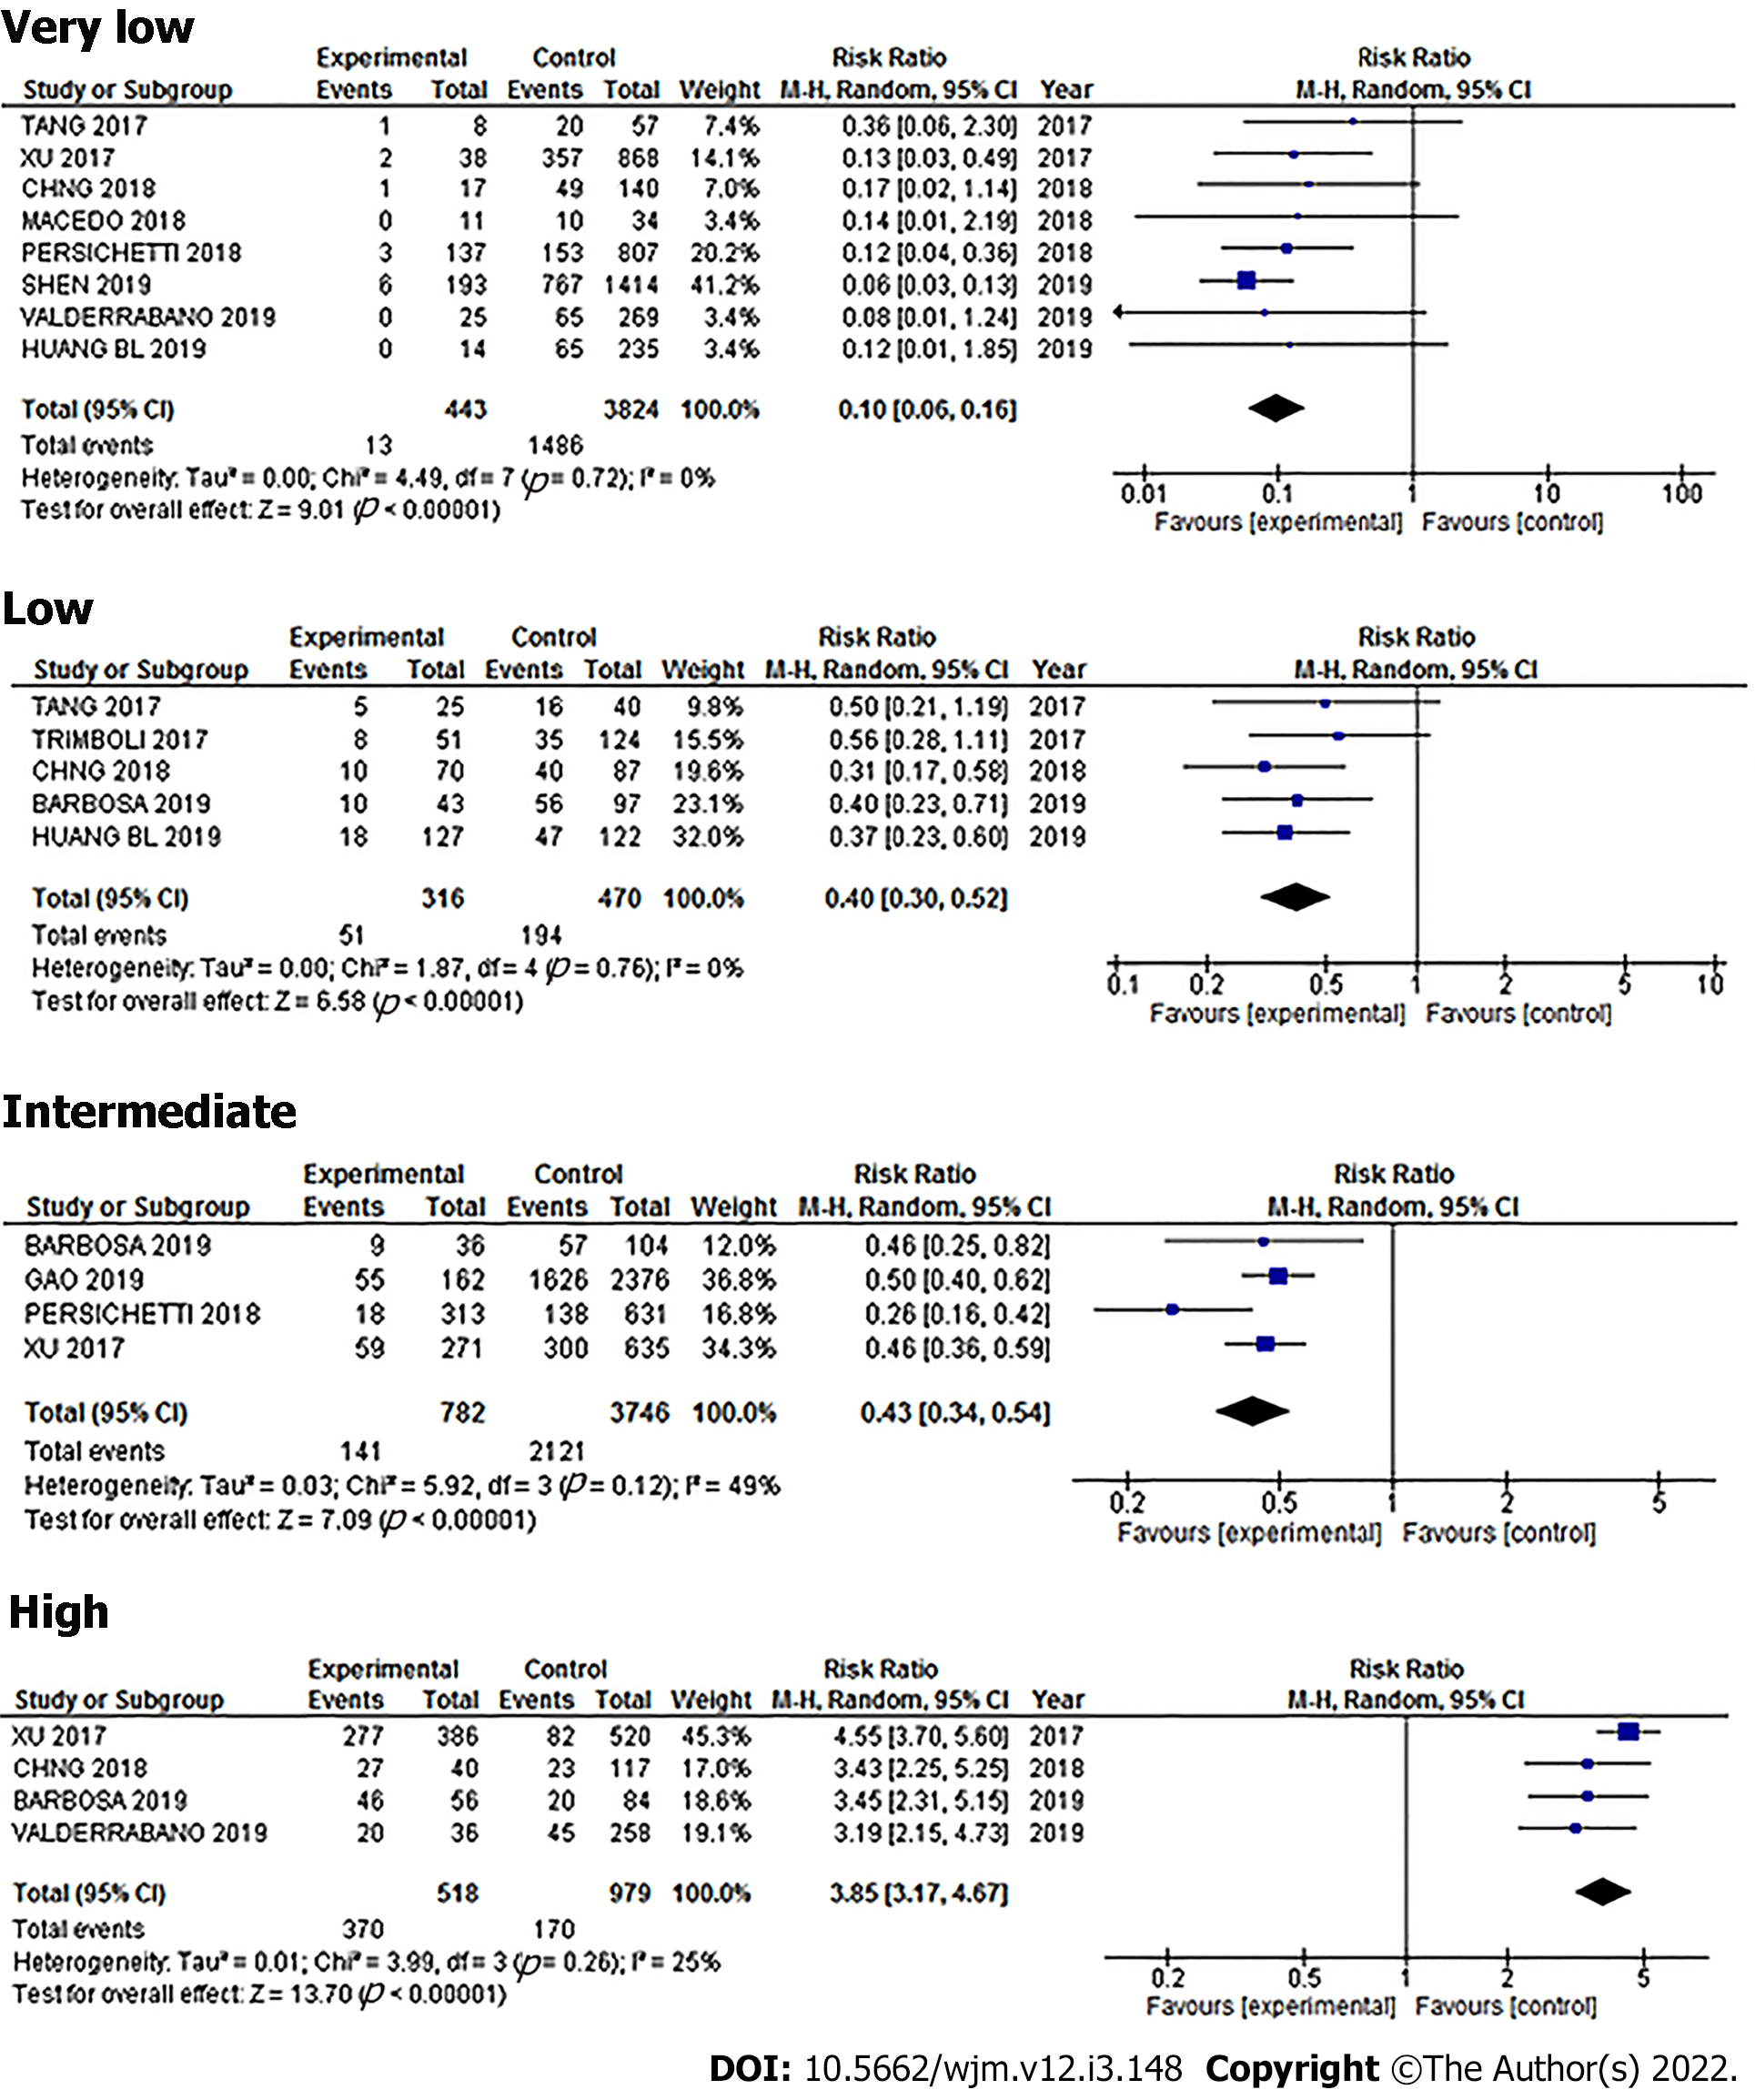
Figure 5 Pooled diagnostic value of very low risk pattern.
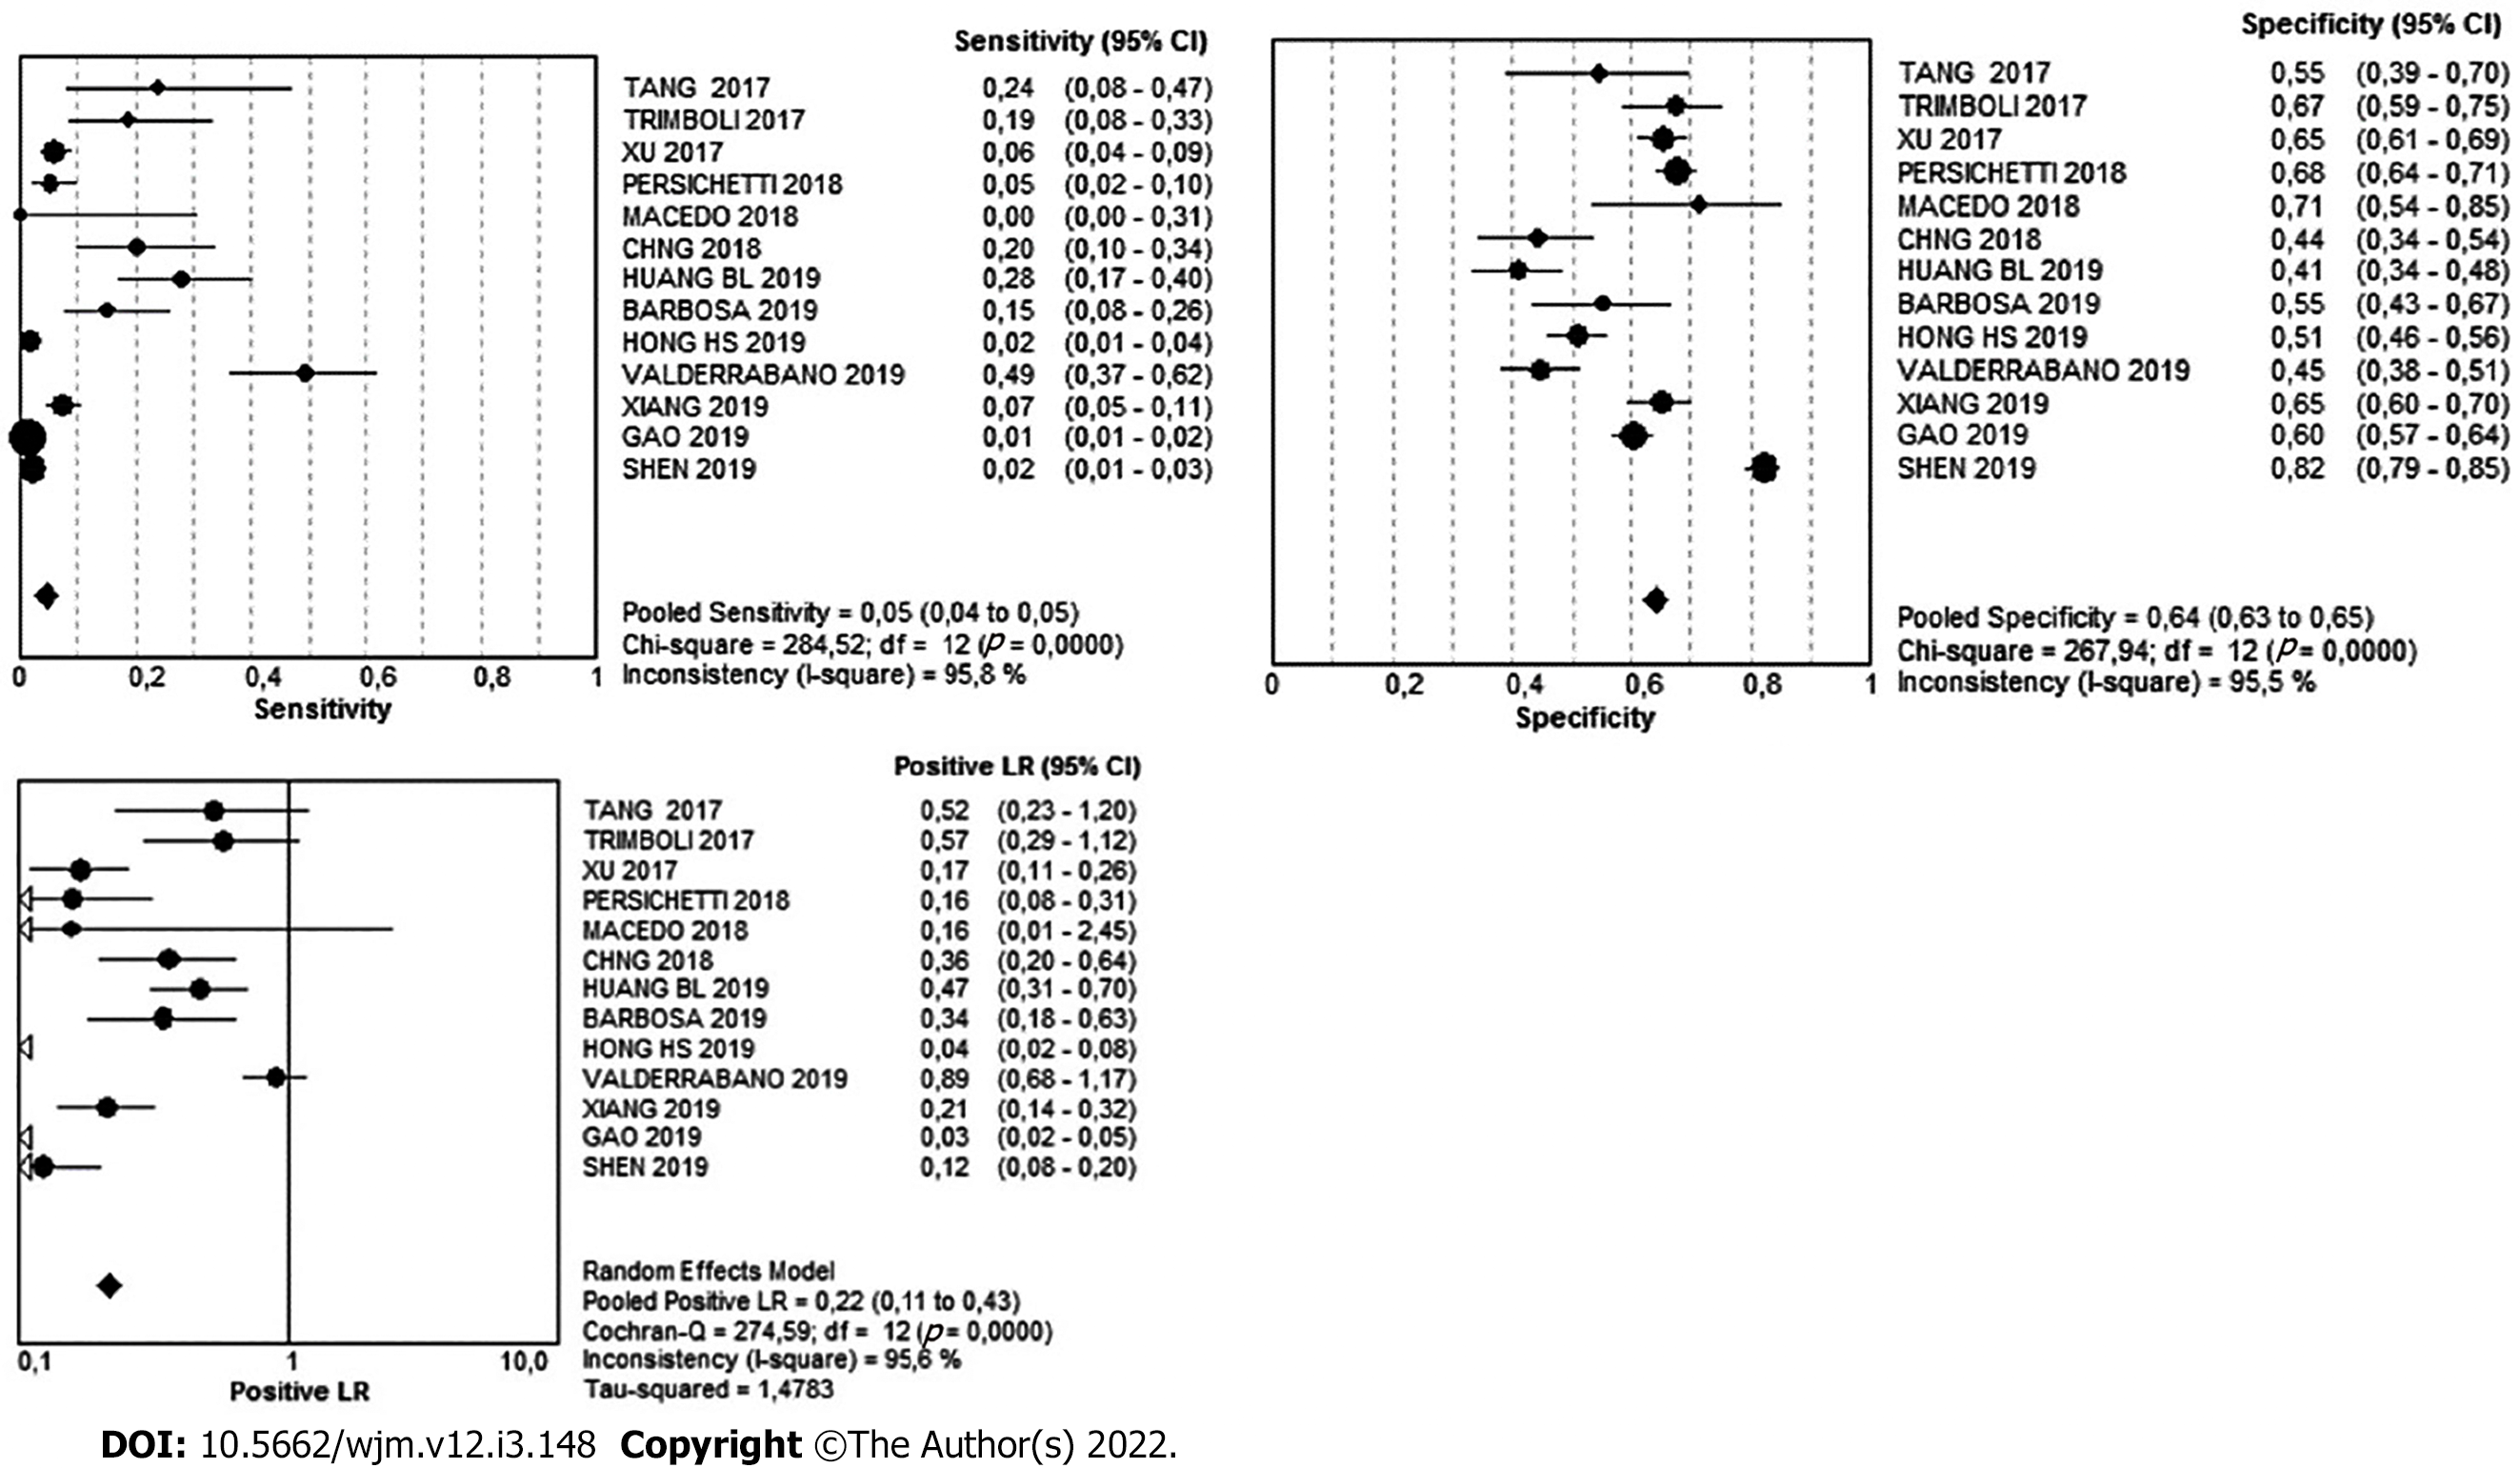
Figure 6 Pooled diagnostic value of low risk pattern.
Figure 7 Pooled diagnostic value of intermediate risk pattern.
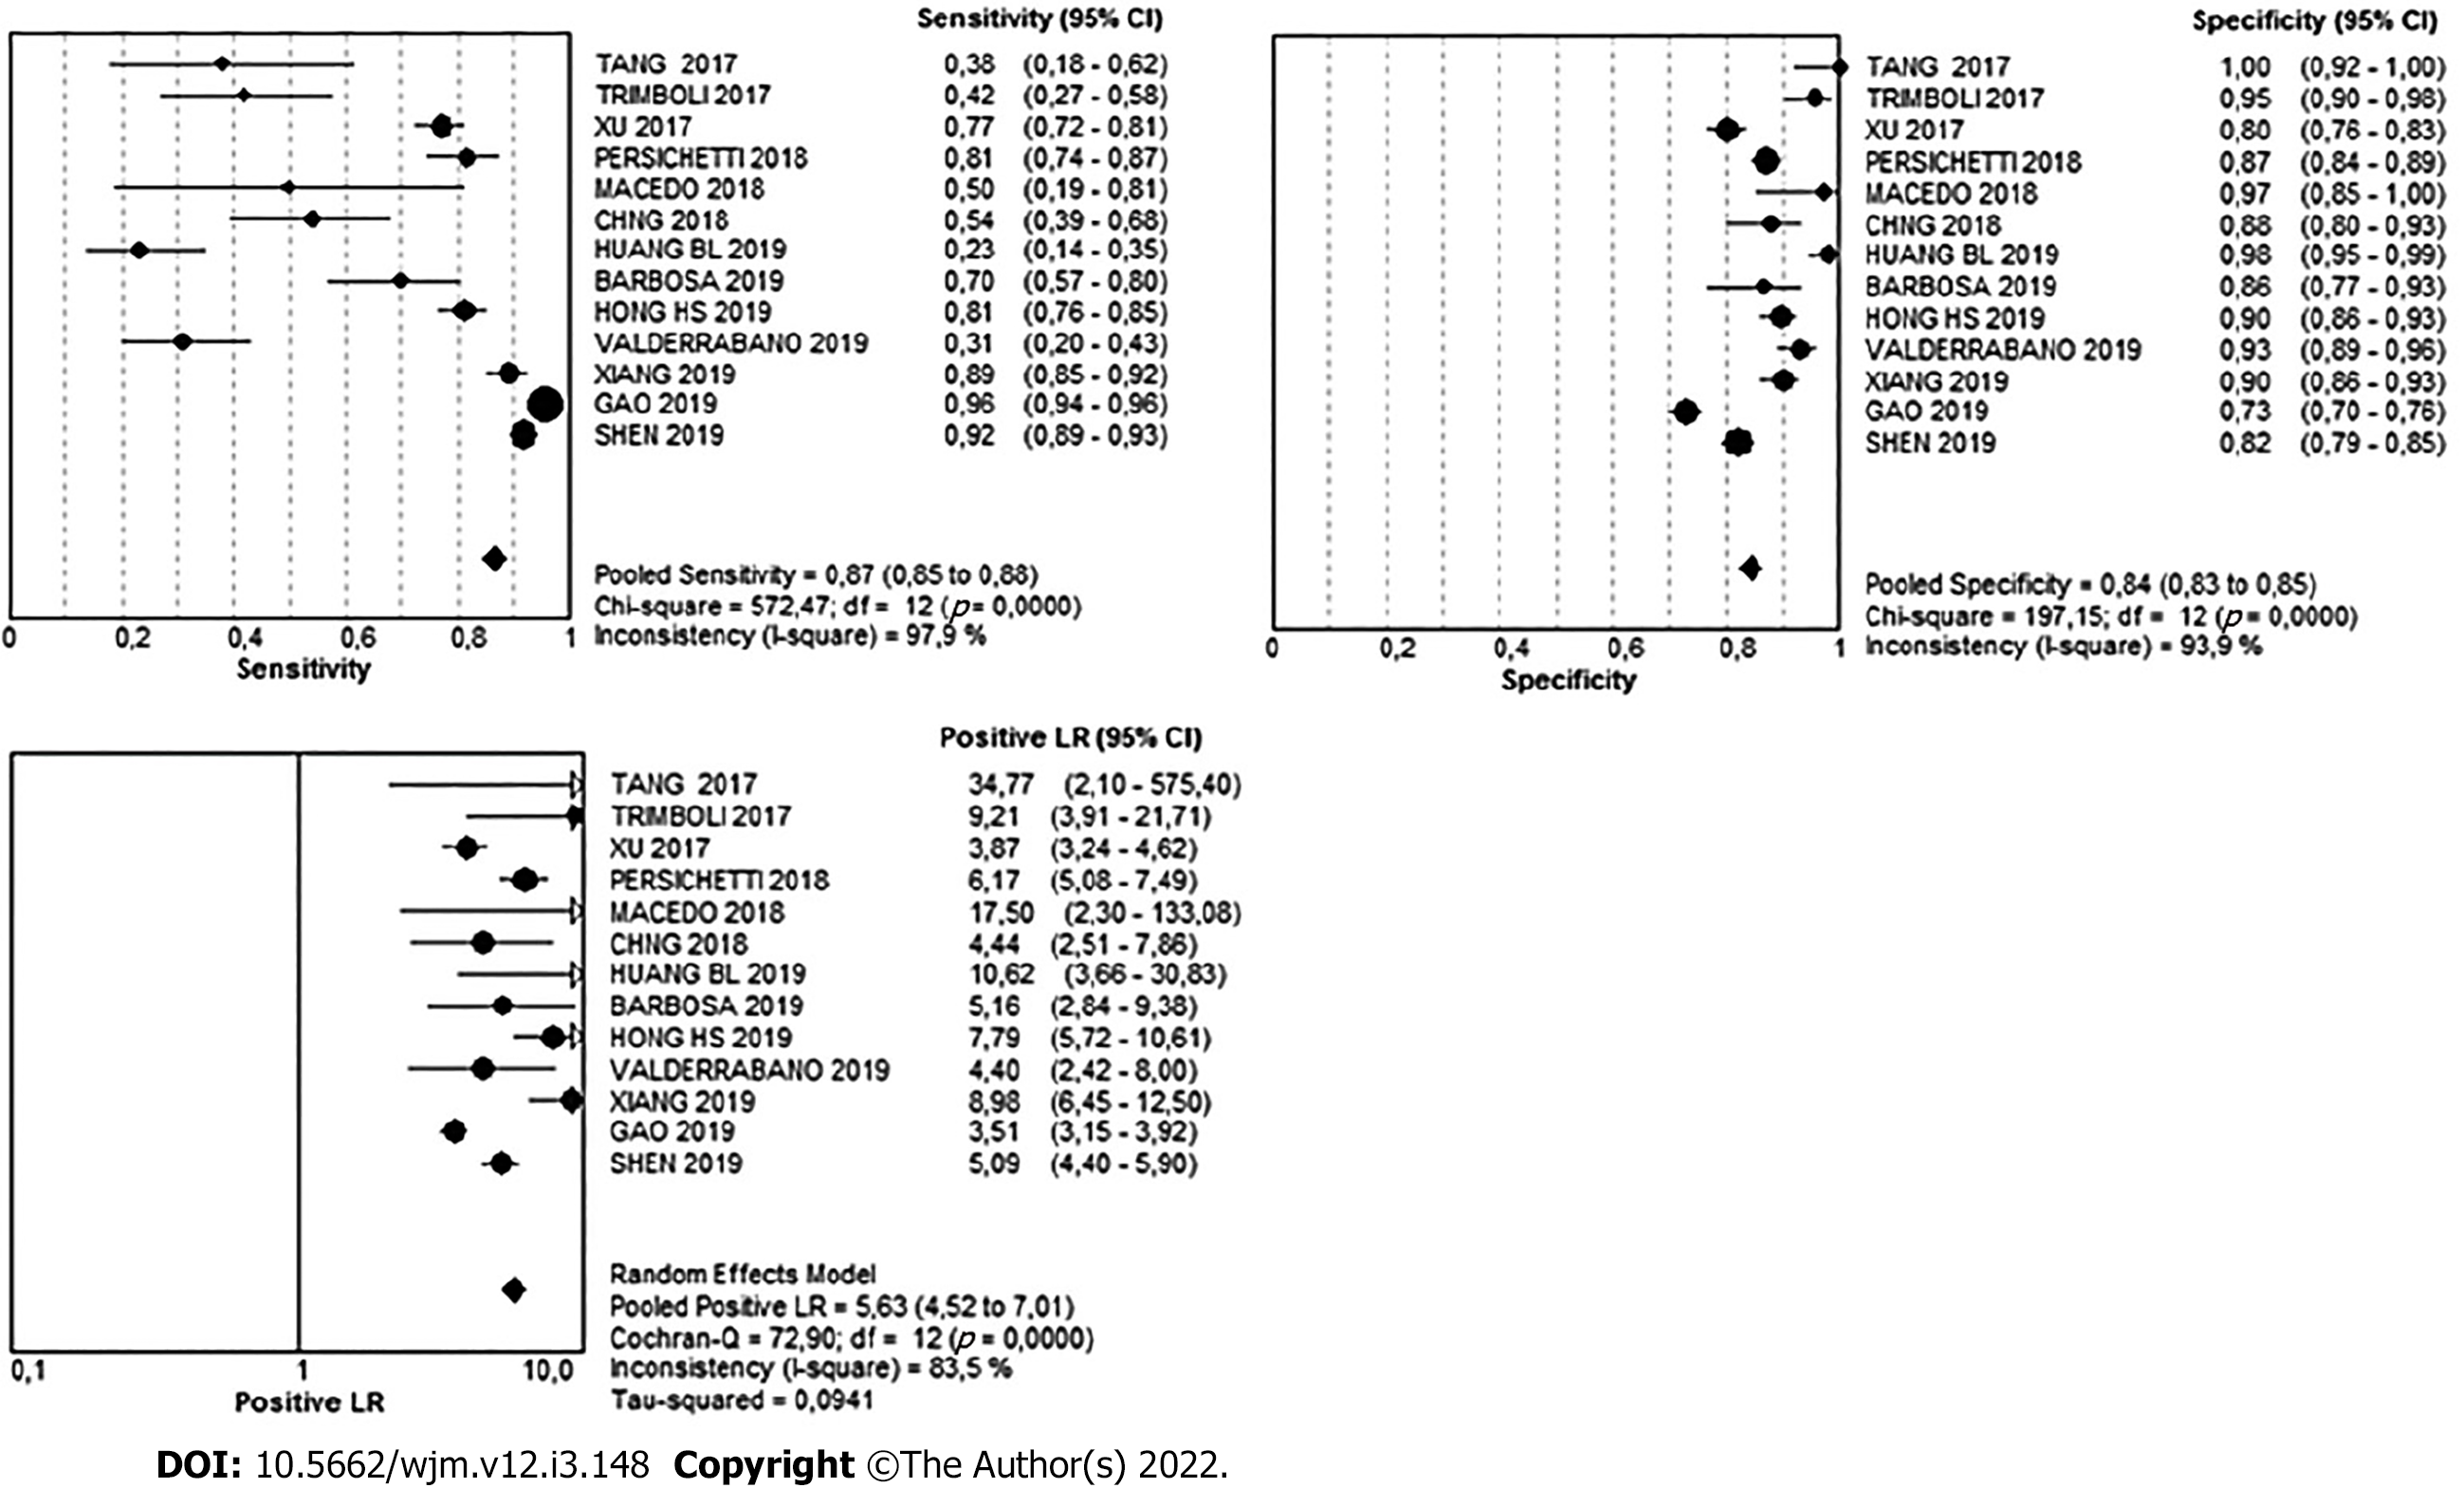
Figure 8 Pooled diagnostic value of high risk pattern.
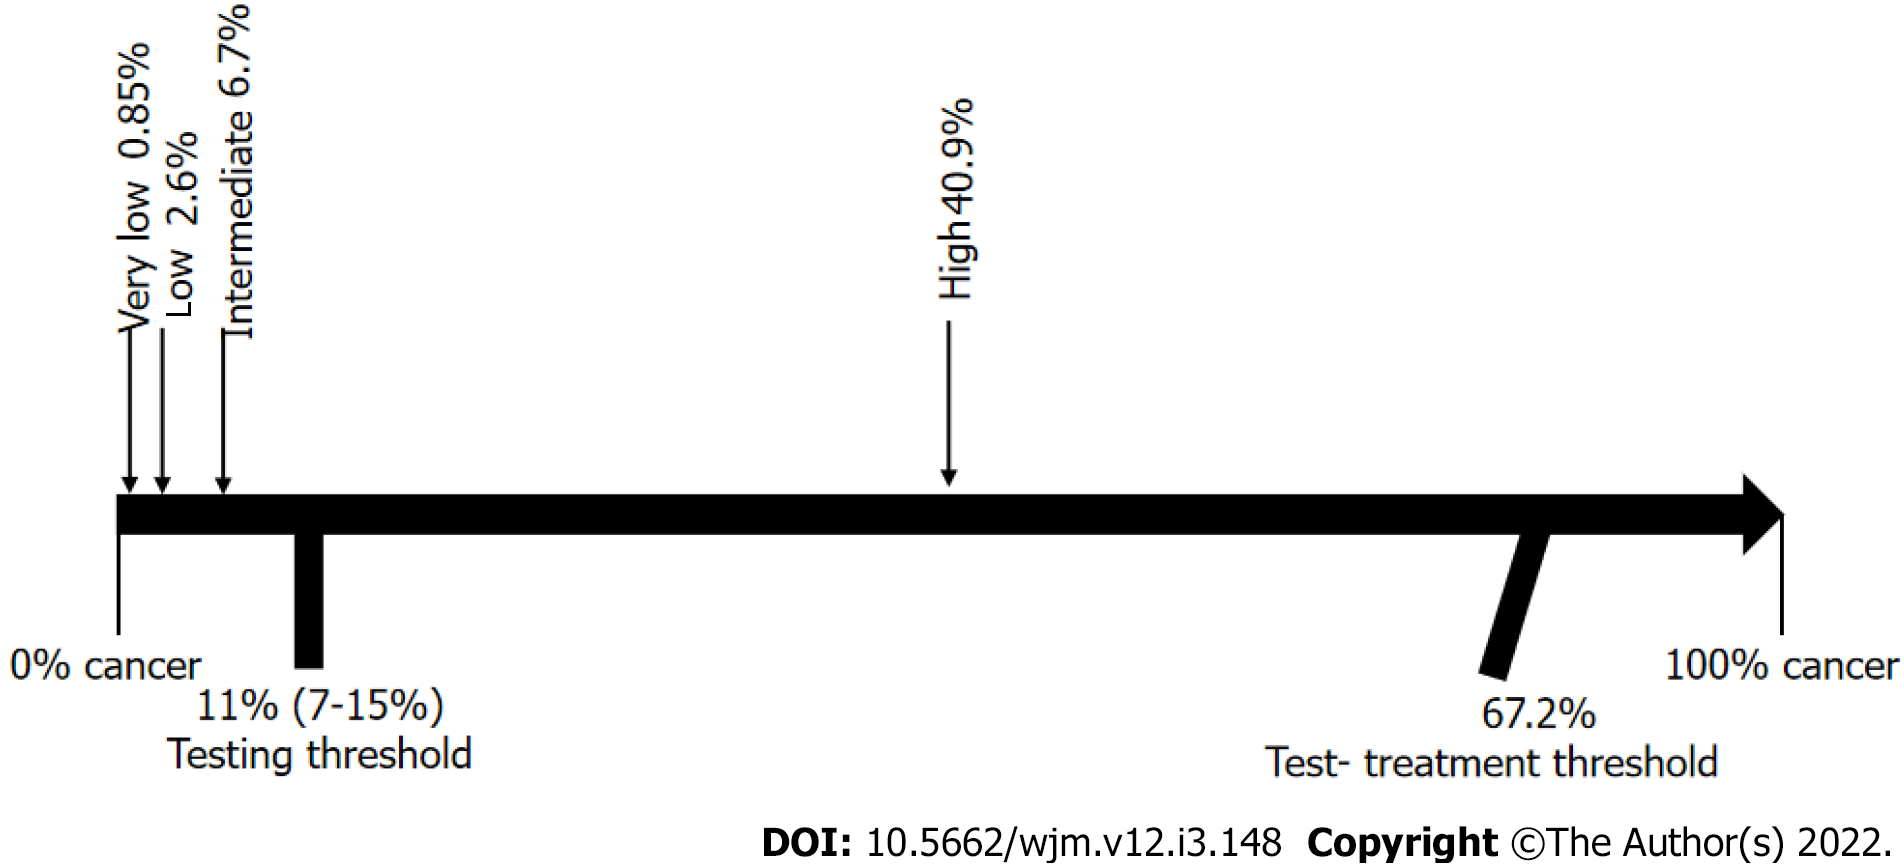
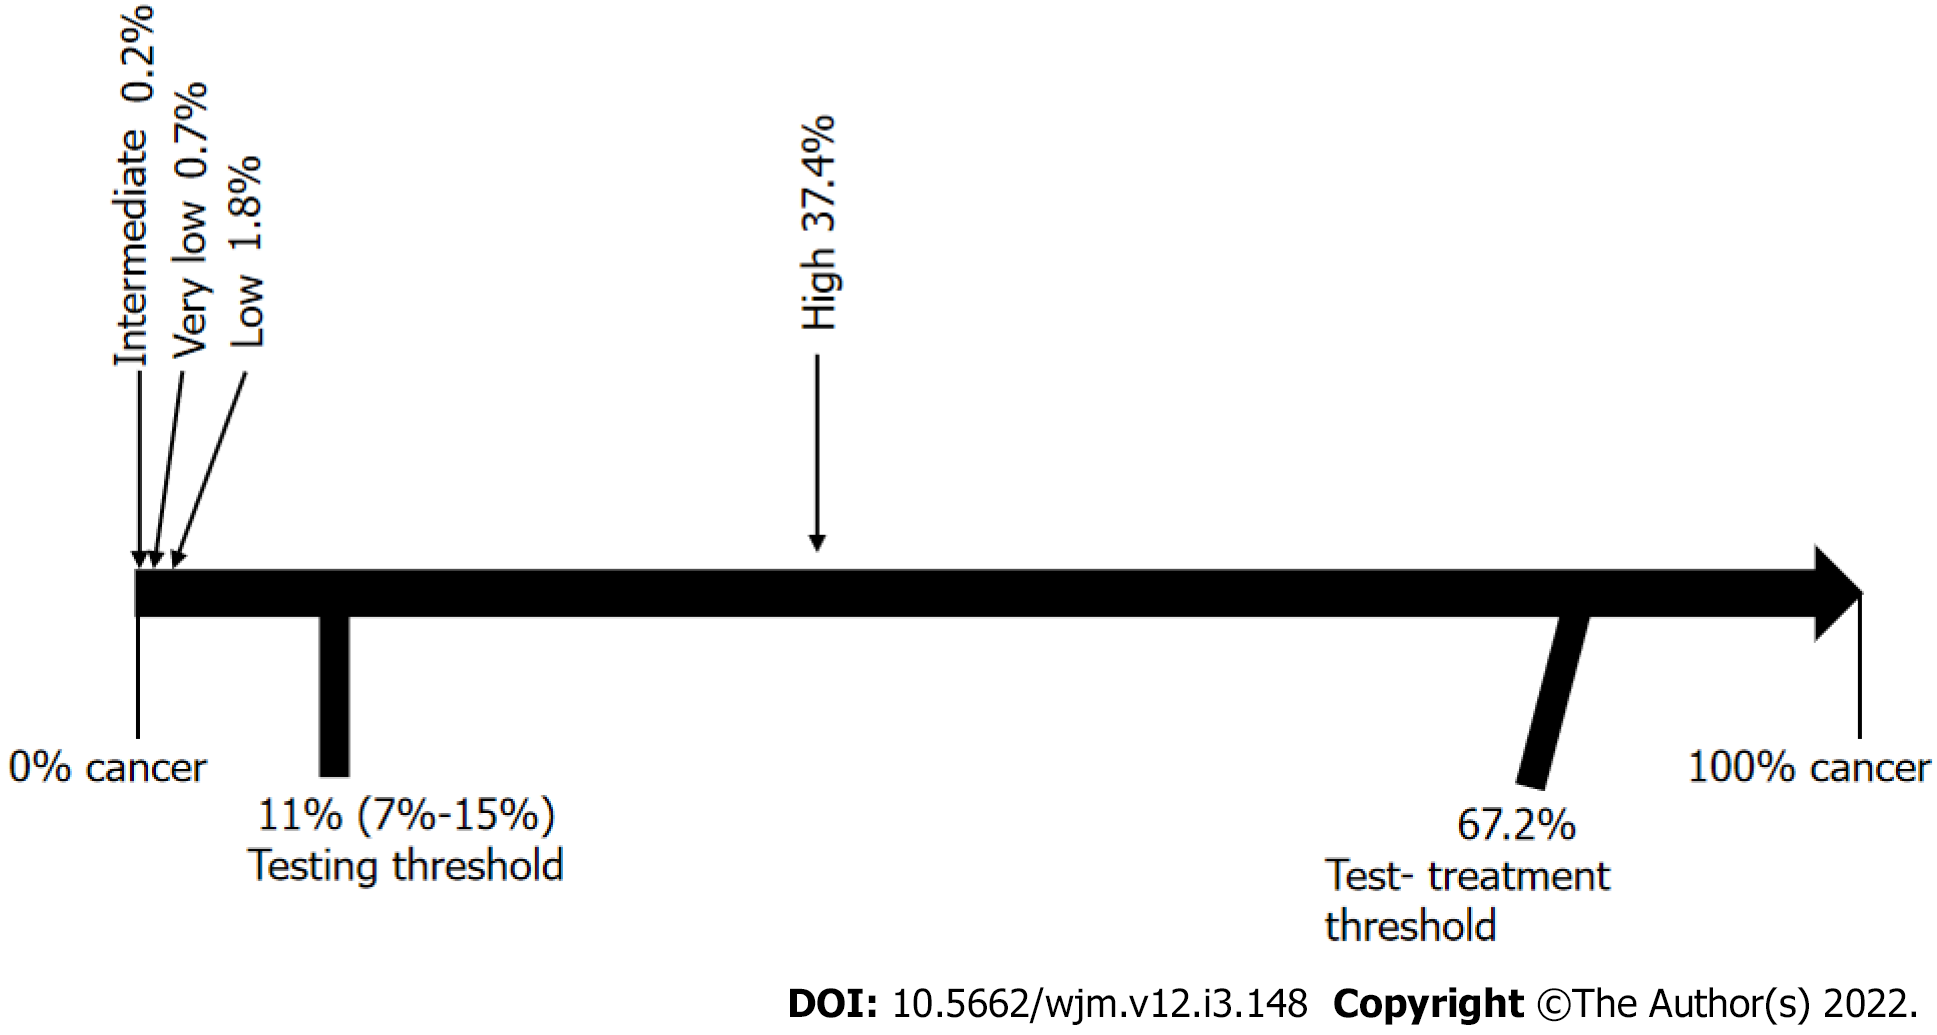
Figure 9 Results by Bayesian analysis and the threshold approach to clinical decision-making.
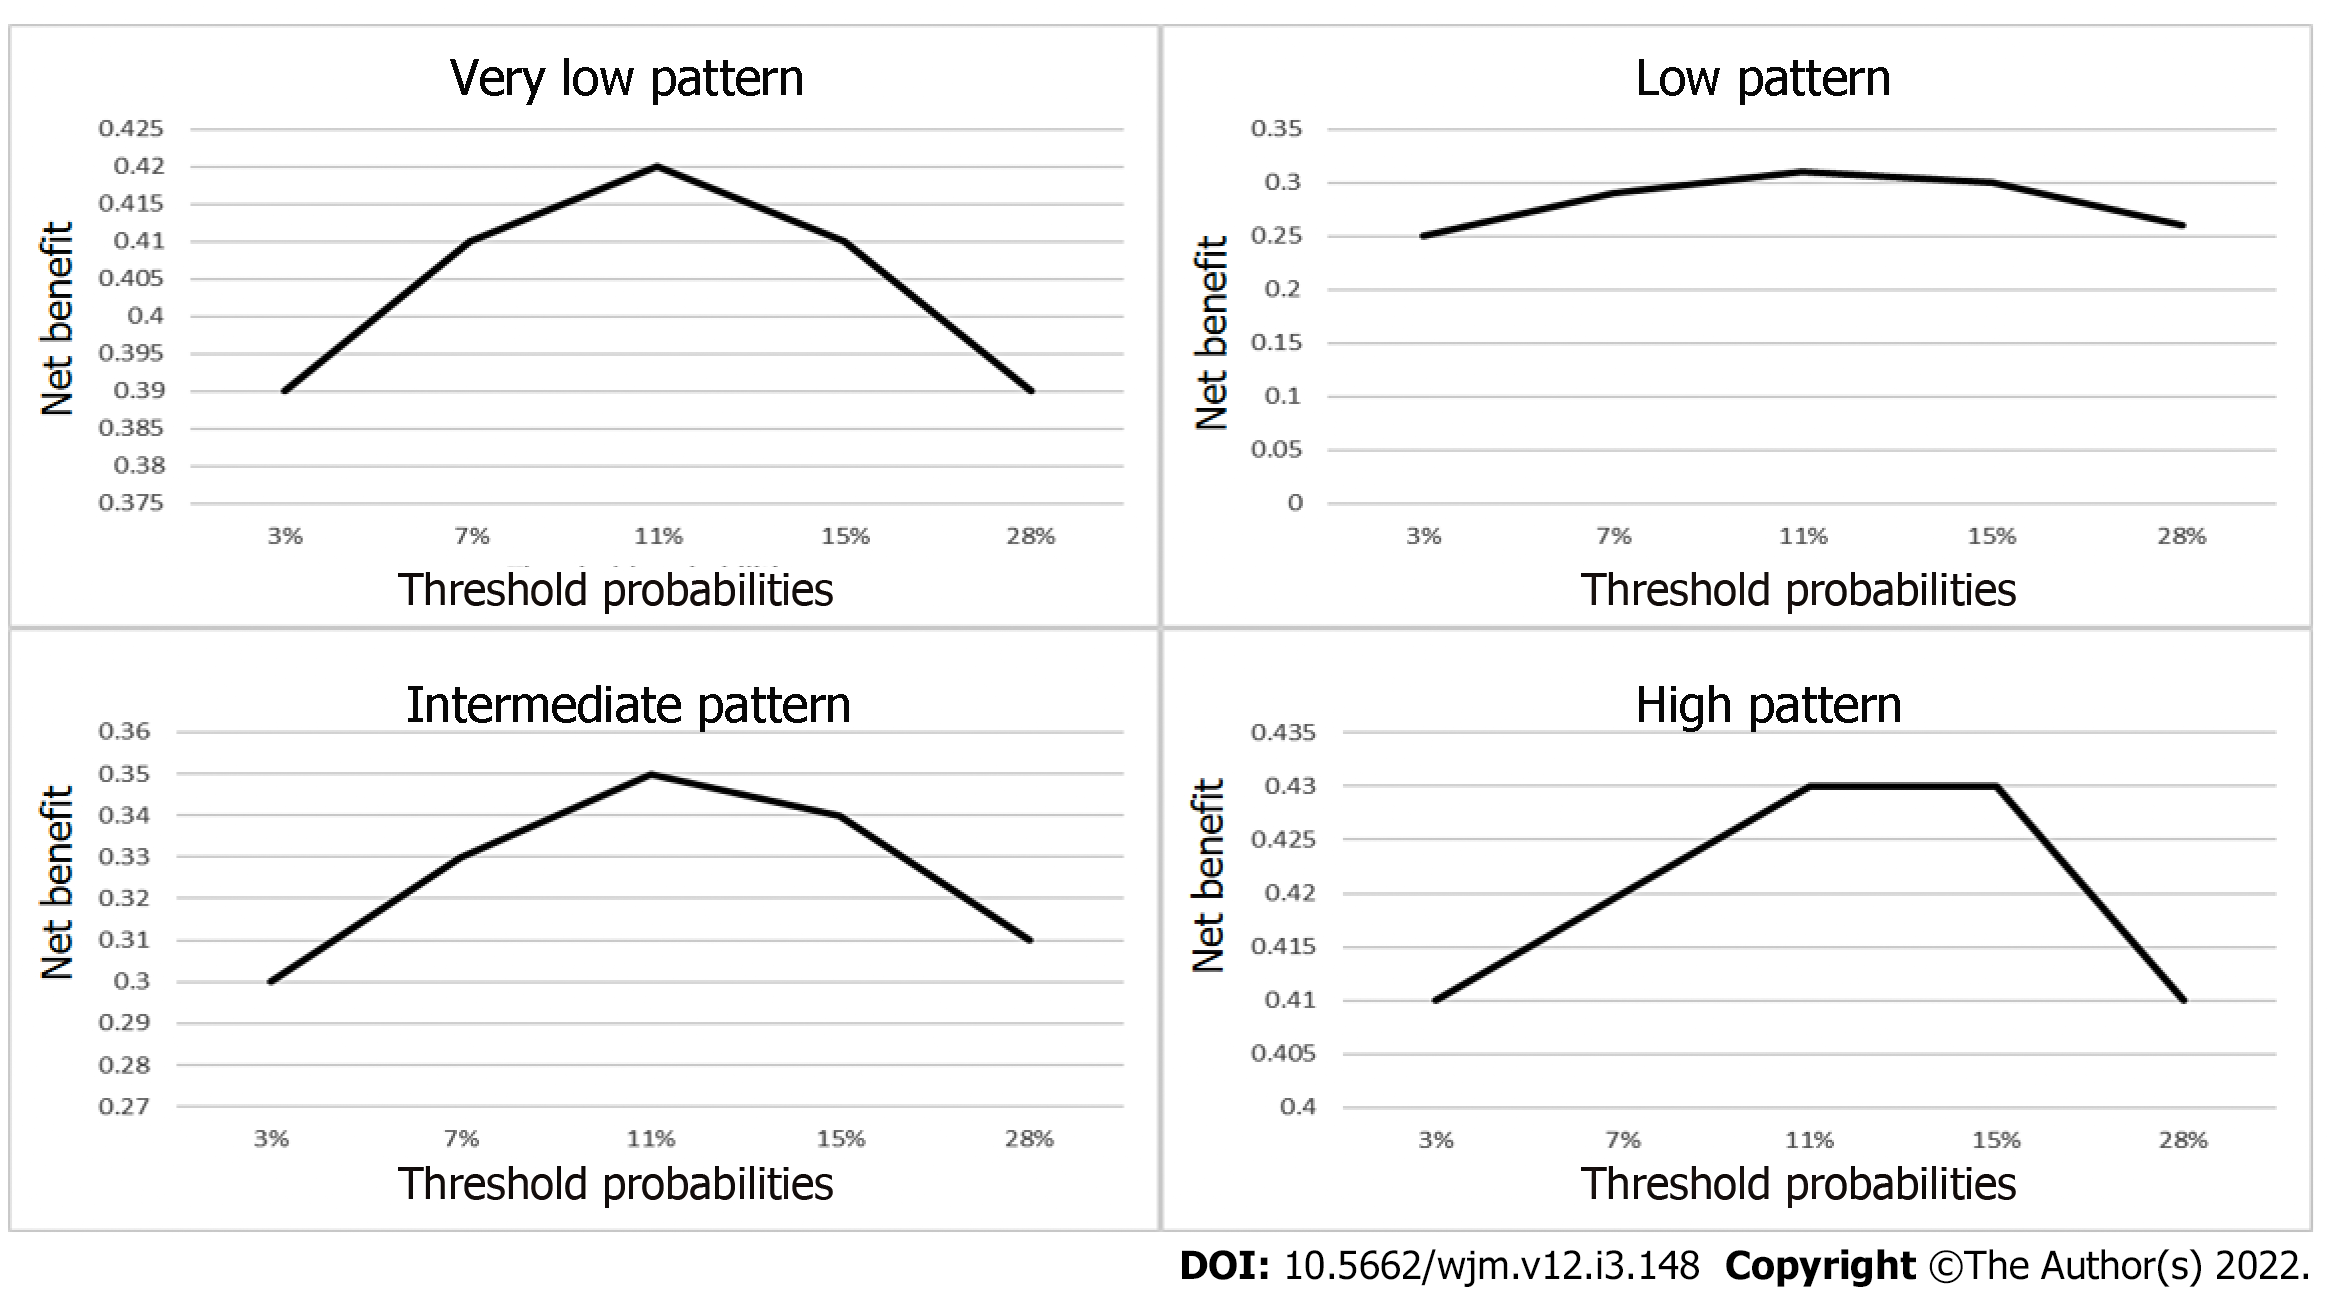
Figure 10 Net benefit, number of interventions avoided, in study patterns.
Figure 11 Pooled subgroups analysis.
Figure 12 Bayesian subgroups analysis and the threshold approach to clinical decision-making.
- Citation: Hurtado-Lopez LM, Carrillo-Muñoz A, Zaldivar-Ramirez FR, Basurto-Kuba EOP, Monroy-Lozano BE. Assessment of diagnostic capacity and decision-making based on the 2015 American Thyroid Association ultrasound classification system. World J Methodol 2022; 12(3): 148-163
- URL: https://www.wjgnet.com/2222-0682/full/v12/i3/148.htm
- DOI: https://dx.doi.org/10.5662/wjm.v12.i3.148


