
















Copyright: ©Author(s) 2026.
World J Transl Med. Nov 28, 2026; 12(4): 125063
Published online Nov 28, 2026. doi: 10.5528/wjtm.125063
Published online Nov 28, 2026. doi: 10.5528/wjtm.125063
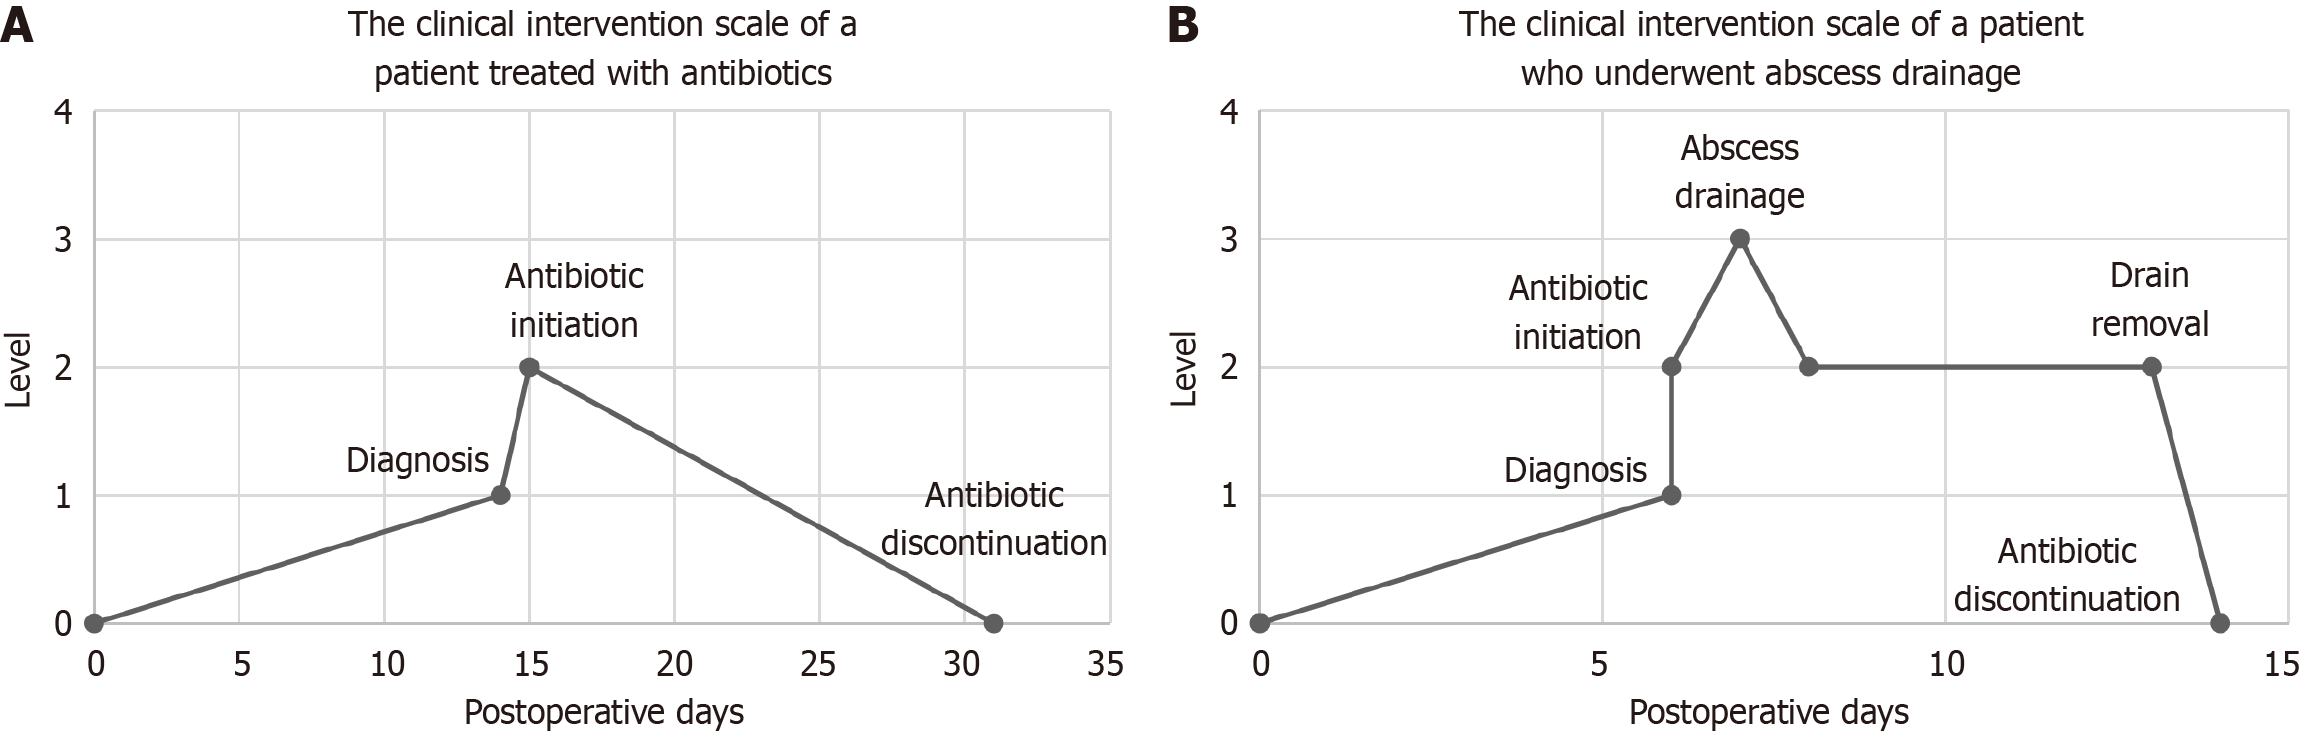
Figure 1 Examples of area under the curve.
A: The patient was diagnosed with an abscess on postoperative day 14, was started on antibiotics on postoperative day 15, and completed antibiotic therapy on postoperative day 31. The area under the curve (AUC) was 24.5. (0 + 1)/2 × 14 + (1 + 2)/2 × (15 - 14) + (2 + 0)/2 × (31 - 15) = 24.5. This patient was classified into the high-AUC group; B: On postoperative day 6, the patient was diagnosed with an abscess and simultaneously started on antibiotics. The patient underwent abscess drainage on postoperative day 7, the drain was removed on postoperative day 13, and antibiotic therapy was completed on postoperative day 14. The AUC was 19.0. (0 + 1)/2 × 6 + (2 + 3)/2 × (7 - 6) + (3 + 2)/2 × 1 + (2 + 2)/2 × (13 – 7 - 1) + (2 + 0)/2 × (14 - 13) = 19. This patient was classified into the low-AUC group.
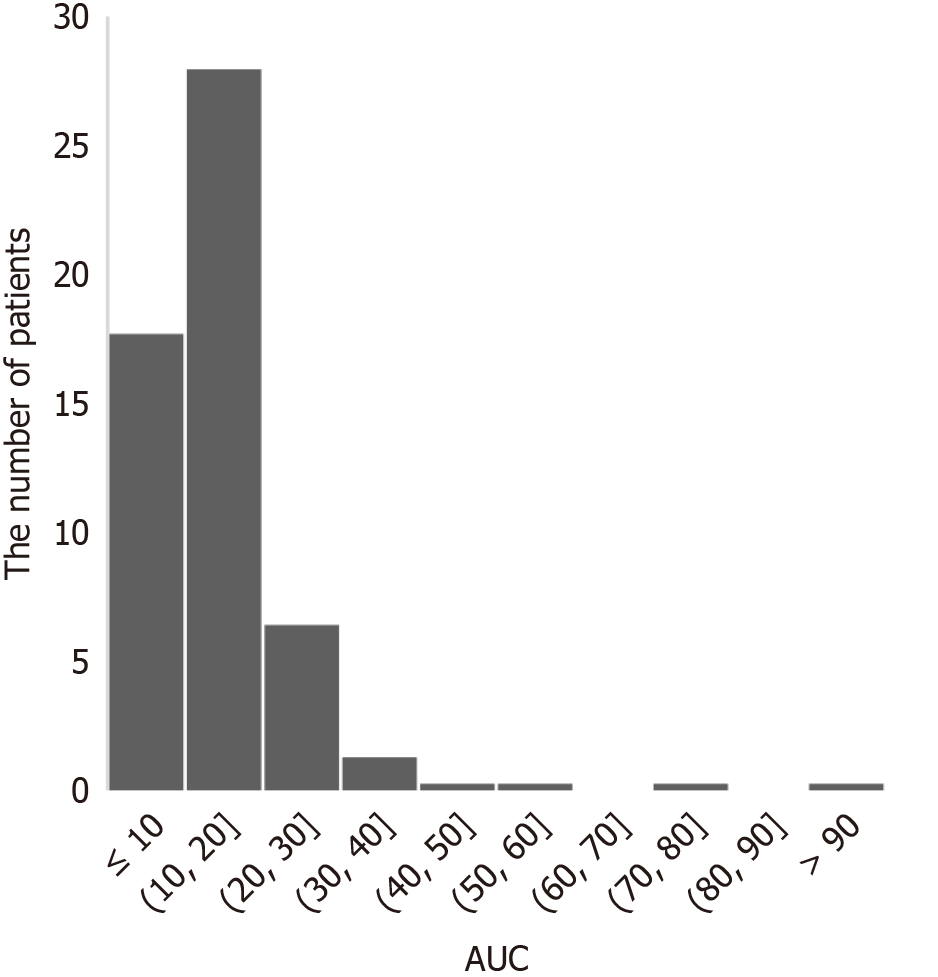
Figure 2
Distribution of the area under the curve values.
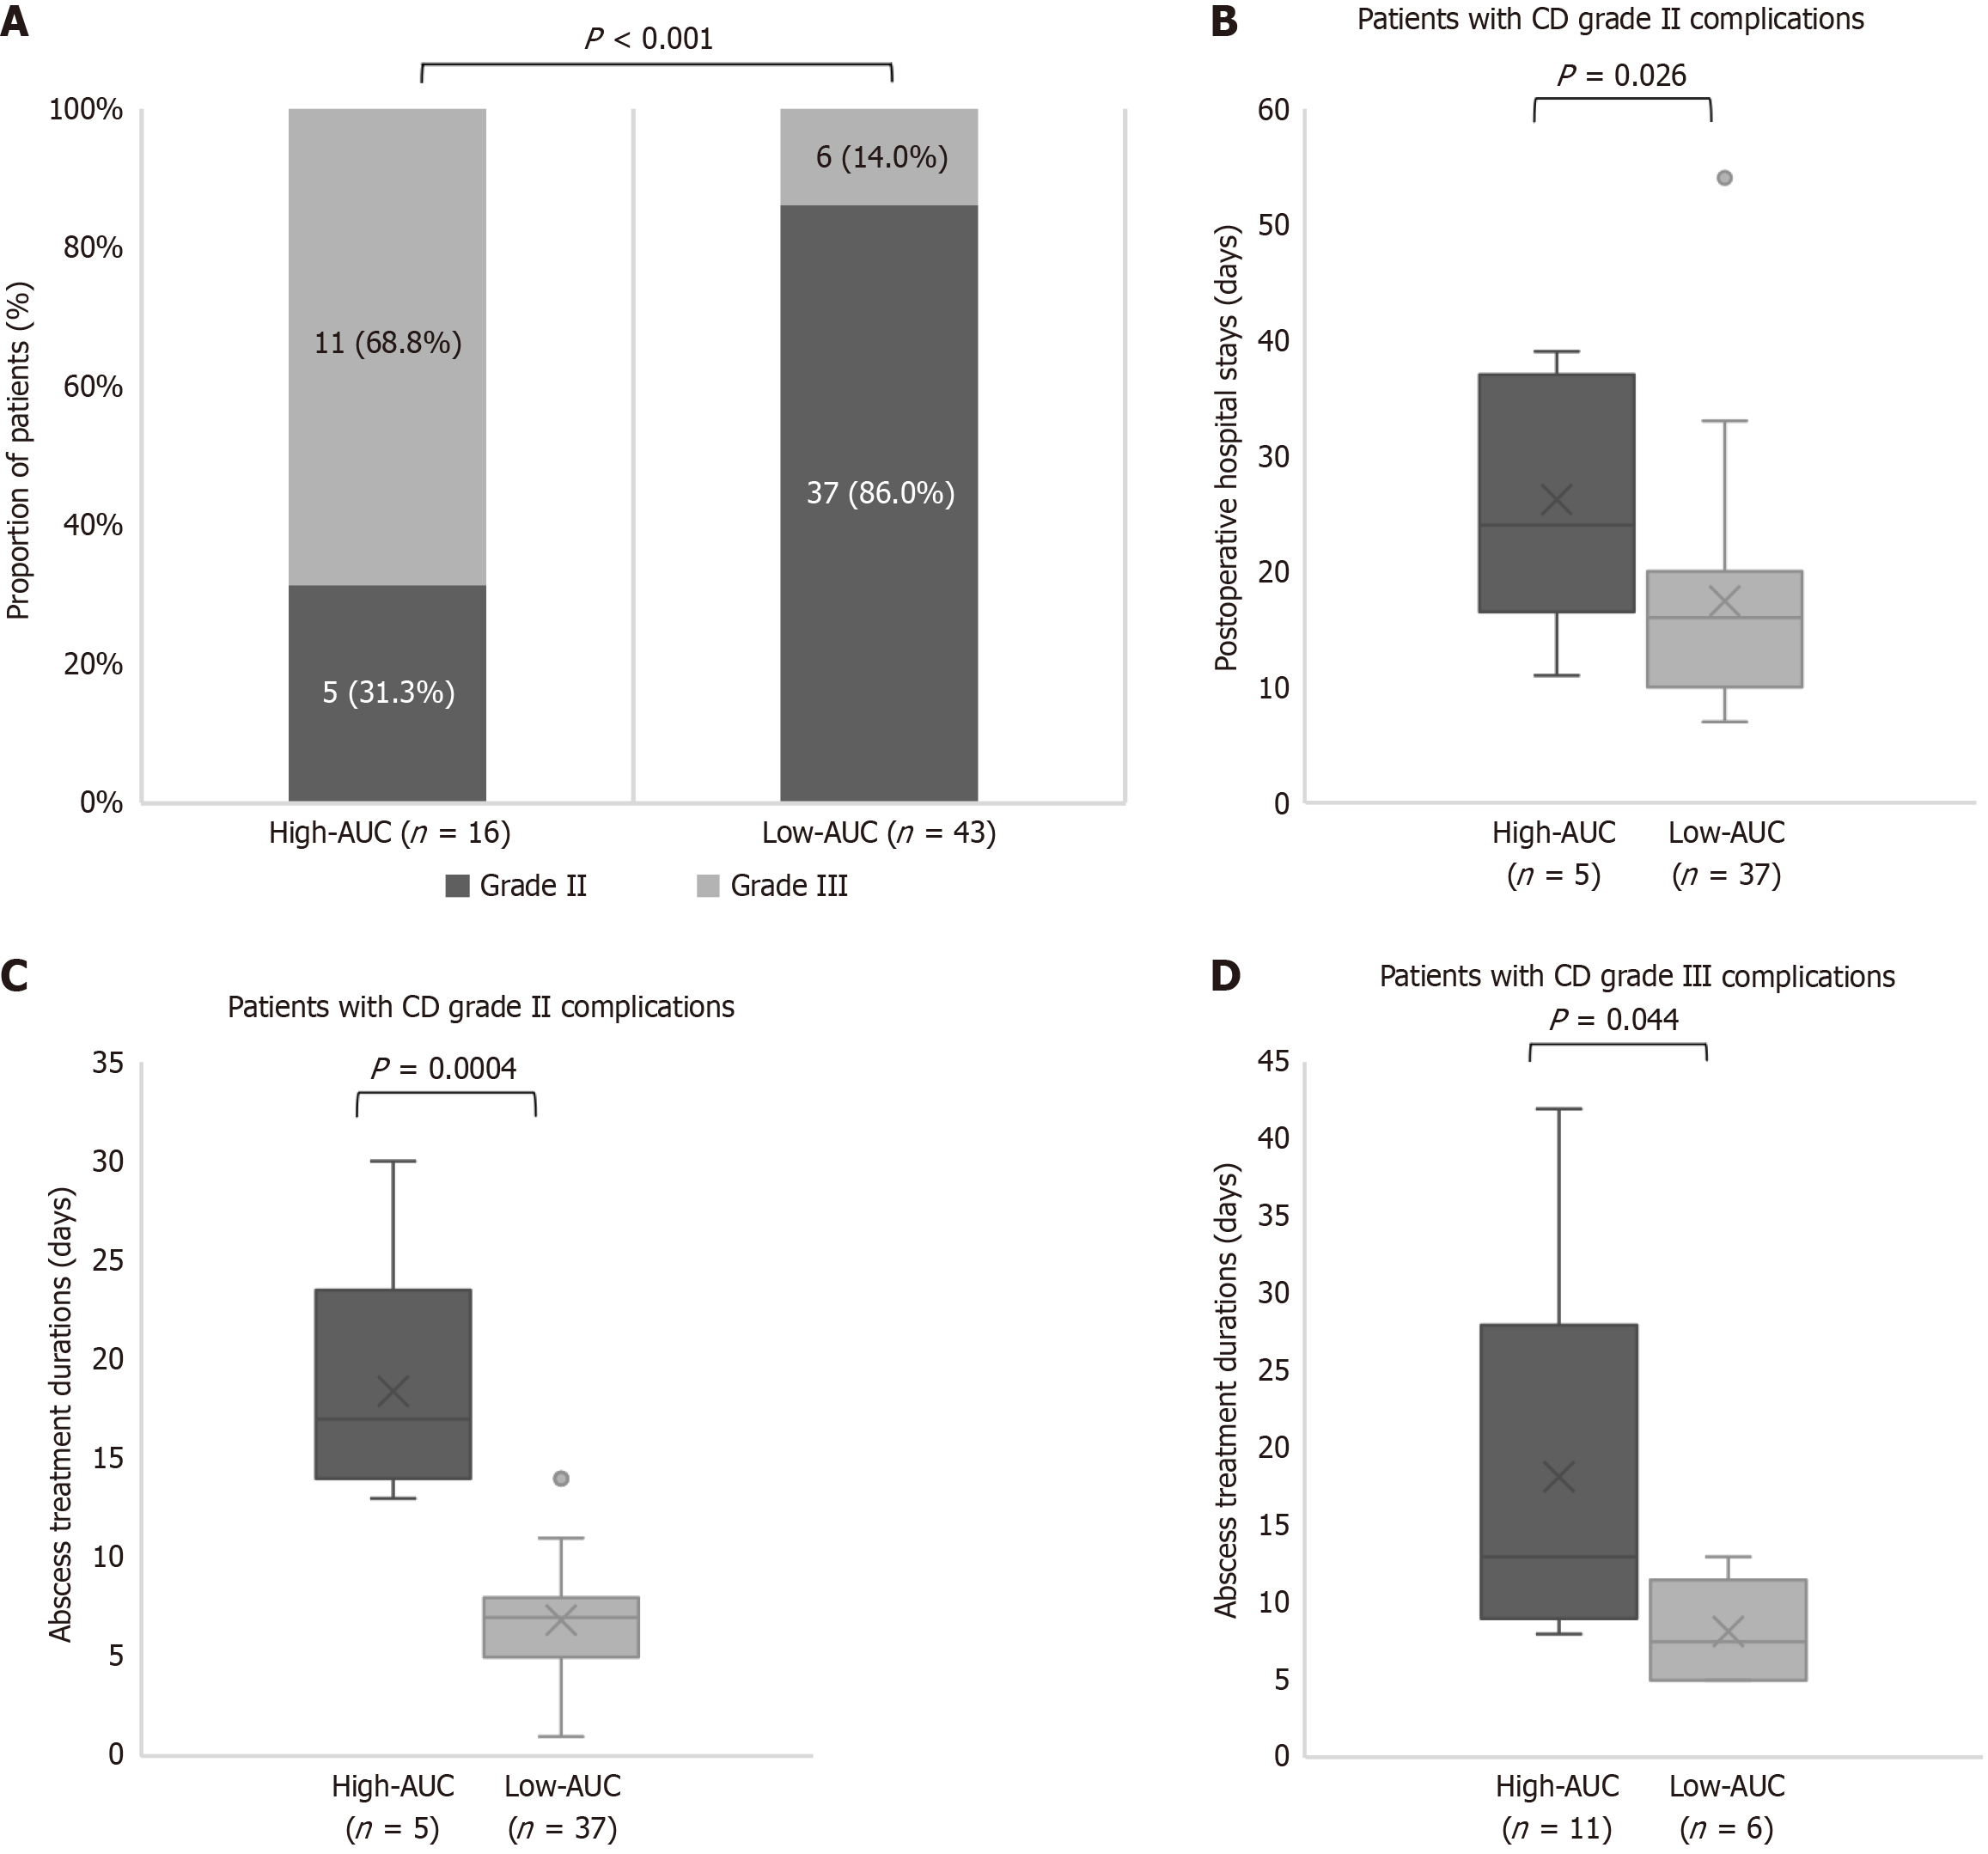
Figure 3 Comparison of high- and low-area under the curve groups.
A: The proportion of patients with Clavien-Dindo (CD) grade II and III complications; B: Postoperative hospital stays of patients with CD grade II complications (26.2 days vs 17 days, P = 0.026); C: Abscess treatment durations of patients with CD grade II complications (18.4 days vs 7 days, P = 0.0004); D: Abscess treatment durations of patients with CD grade III complications (18 days vs 8 days, P = 0.044). AUC: Area under the curve; CD: Clavien-Dindo.
- Citation: Tanisawa Y, Fujino S, Kimura T, Yoneda N, Nagae A, Sawada G, Moon JH, Fukunaga H, Morimoto O, Morita S. Quantifying abdominal abscess burden using area under the curve methods inspired by dehiscence, infection/inflammation, seroma, hematoma classification. World J Transl Med 2026; 12(4): 125063
- URL: https://www.wjgnet.com/2220-6132/full/v12/i4/125063.htm
- DOI: https://dx.doi.org/10.5528/wjtm.125063