
















Copyright: ©Author(s) 2026.
World J Transl Med. Sep 28, 2026; 12(3): 124020
Published online Sep 28, 2026. doi: 10.5528/wjtm.124020
Published online Sep 28, 2026. doi: 10.5528/wjtm.124020
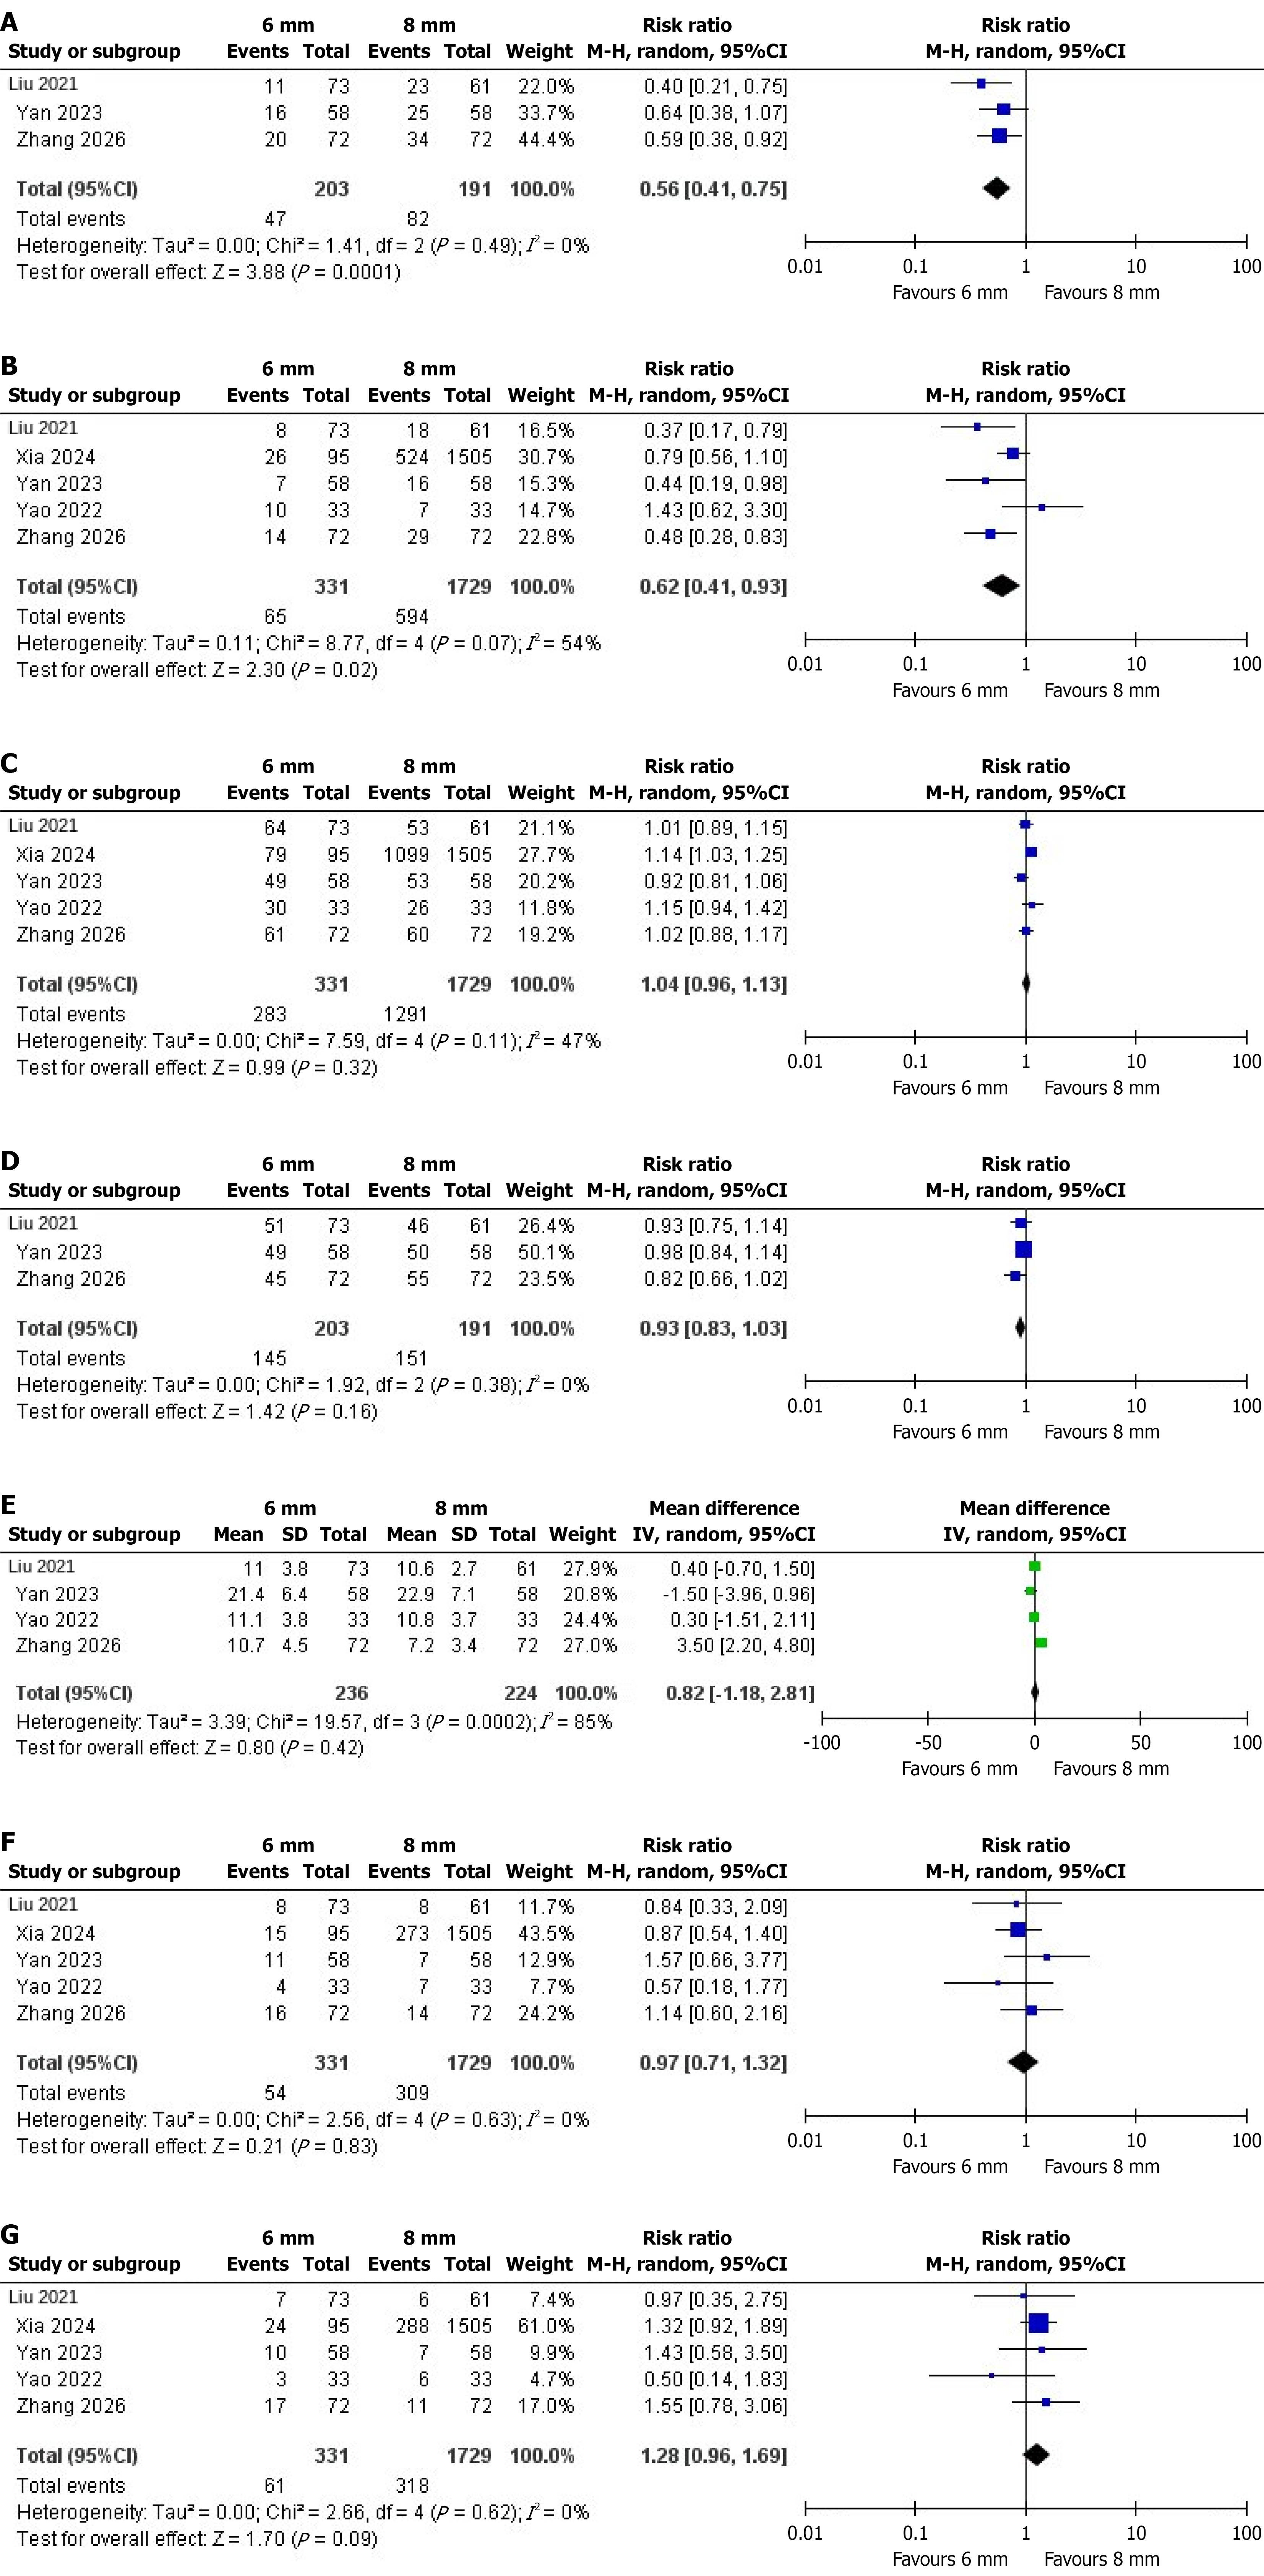
Figure 1 Forest plot.
A: Risk ratio for overall hepatic encephalopathy, 6 mm vs 8 mm; B: Risk ratio for overt hepatic encephalopathy; C: Risk ratio for overall survival at 2 years; D: Risk ratio for achievement of target portal pressure gradient below 12 mmHg; E: Mean difference in post procedural portal pressure gradient (mmHg); F: Risk ratio for shunt dysfunction; G: Risk ratio for variceal rebleeding at 2 years.
- Citation: Arsalan M, Sawaira F, Bhatti U, Hassan T, Shah SM, Dawar SU, Shah SNA, Shehroz R, Mughees M, Yasir M, Mal M, Hasan AH. Efficacy and safety of 6-mm vs 8-mm covered stents for tips creation: A meta-analysis. World J Transl Med 2026; 12(3): 124020
- URL: https://www.wjgnet.com/2220-6132/full/v12/i3/124020.htm
- DOI: https://dx.doi.org/10.5528/wjtm.124020