Copyright
©The Author(s) 2020.
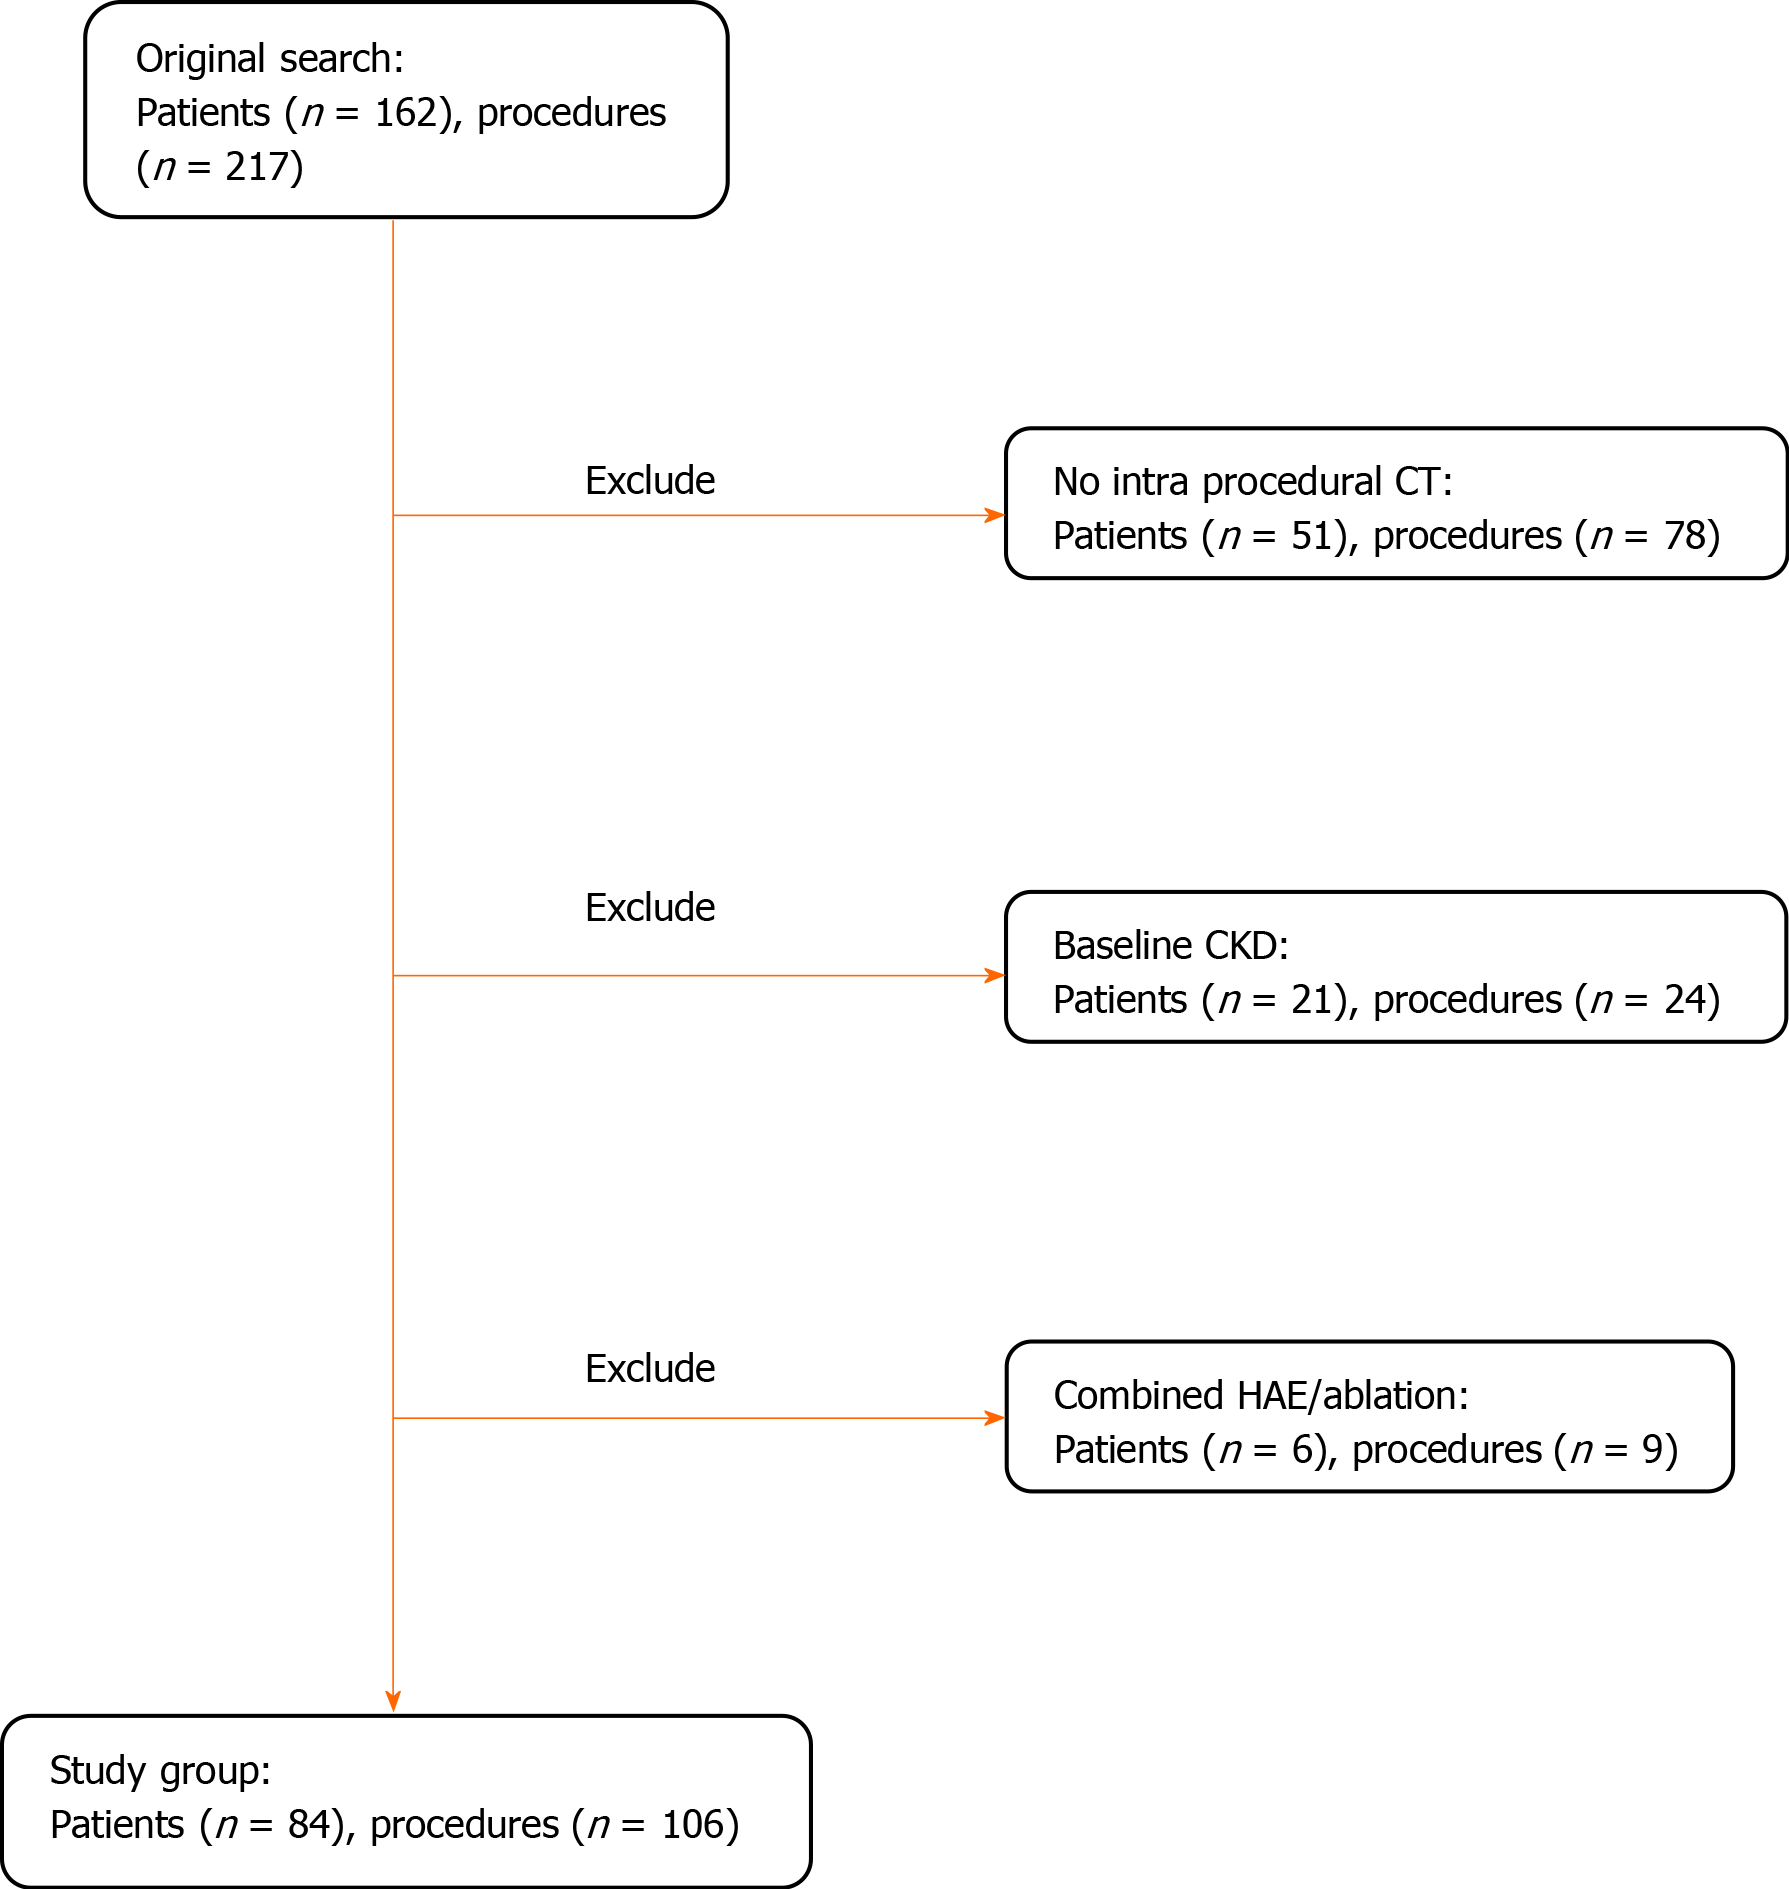
Figure 1 Flow chart of study.
CT: Computed tomography.
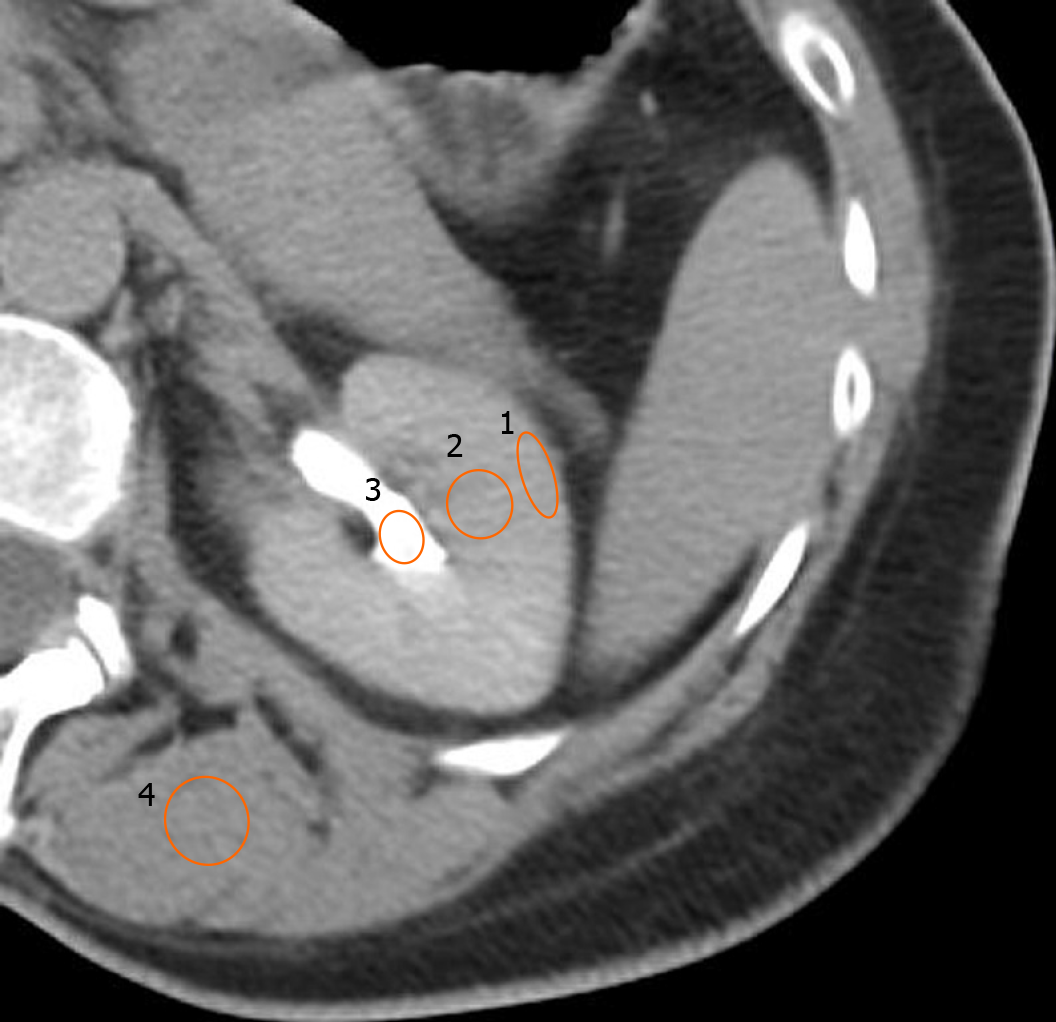
Figure 2 Example of Regions-of-interest drawn on the post-embolization non-contrast enhanced computed tomographic to determine the phase of renal enhancement.
ROI 1 measures the Hounsfield units (HU) of the renal cortex. ROI 2 measures the HU of the renal medulla. ROI 3 measures the HU of the renal pelvis. ROI 4 measures the HU of surrounding skeletal muscle. In this example, the renal enhancement phase is late excretory.
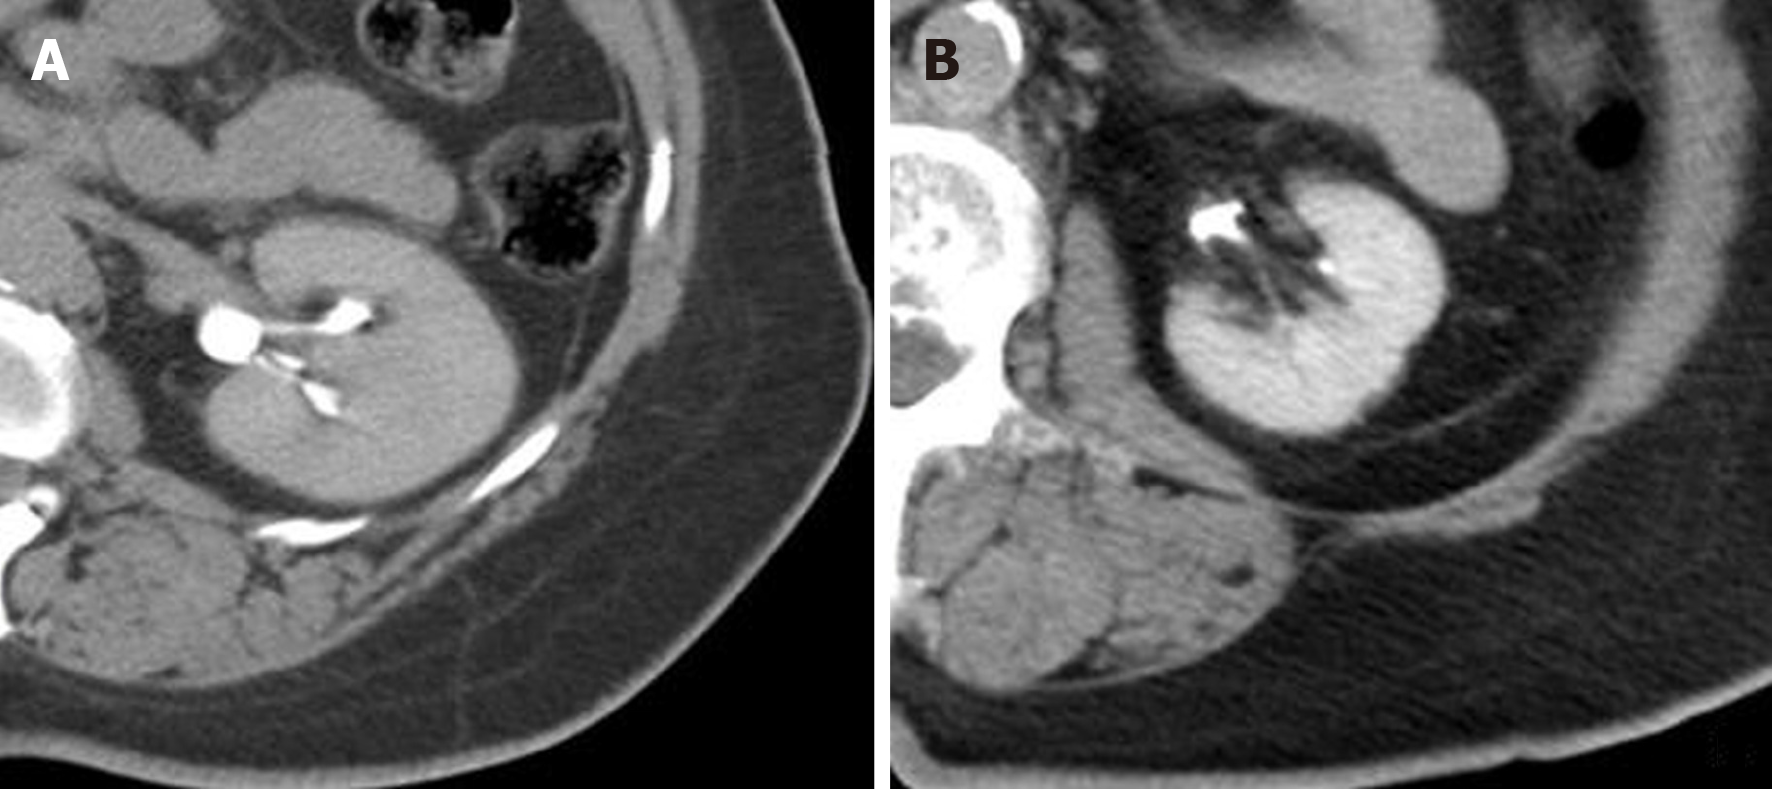
Figure 3 Computed tomographic.
A: Immediate post-embolization non-contrast computed tomographic demonstrating homogenous renal parenchymal enhancement (renal cortex and medulla) with Hounsfield units of 172 and incomplete opacification of renal collecting system, consistent with Early Excretory renal enhancement phase. Hyper enhancement of renal parenchyma compared to adjacent paraspinal skeletal muscle is evident; B: Immediate post-embolization non-contrast computed tomographic demonstrating complete opacification of the renal collecting system with renal parenchyma iso-dense to surrounding skeletal muscle, consistent with late excretory renal enhancement phase.
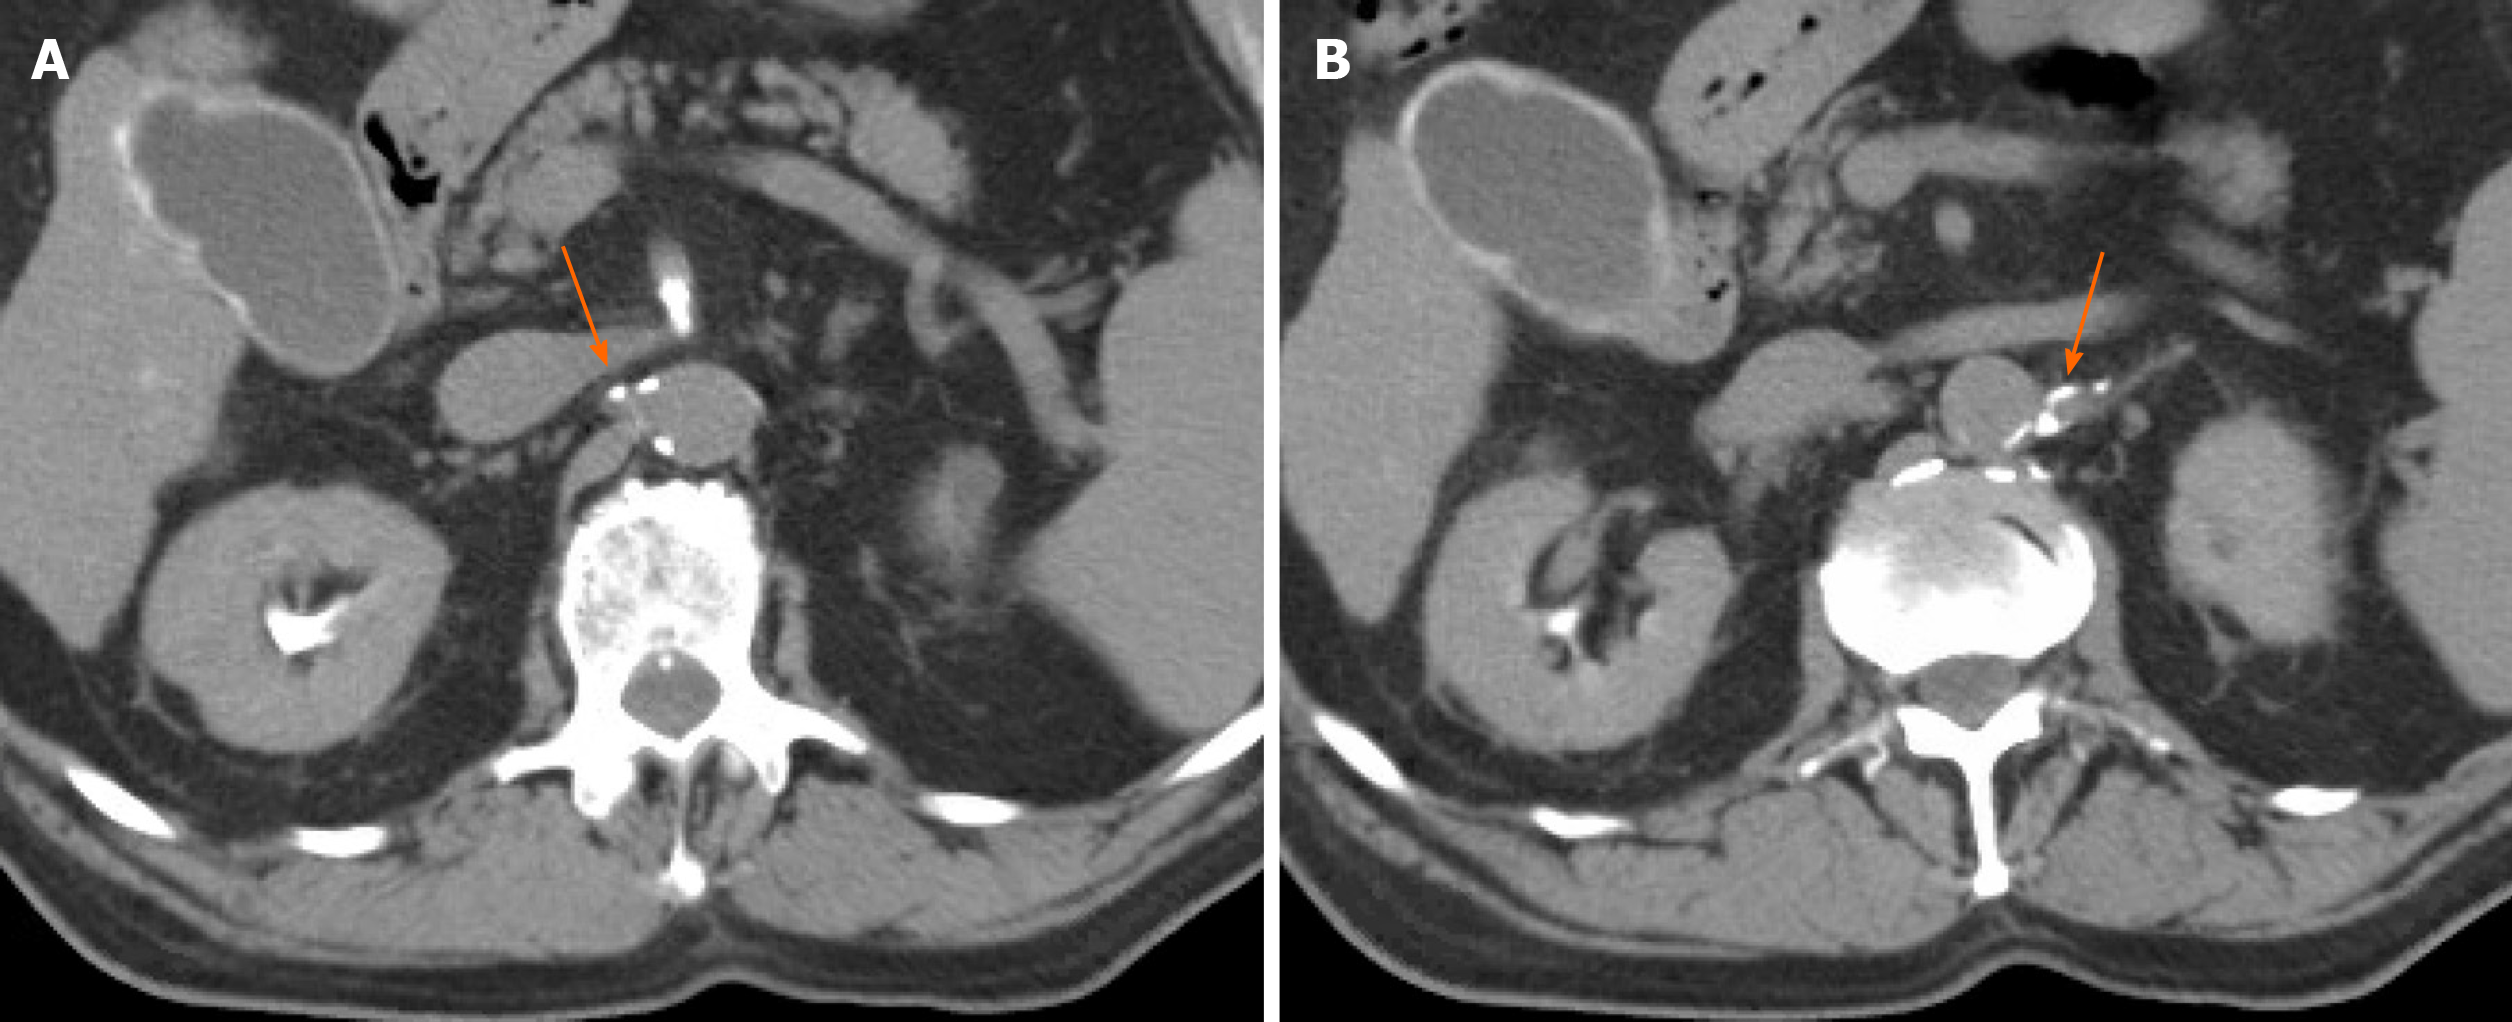
Figure 4 Any discernible plaque along the renal arteries with more than 130 Hounsfield units were considered calcifications.
Immediate post-embolization non-contrast computed tomographic demonstrating renal artery calcifications in the right (arrow) (A) and left (arrow) (B) renal arteries.
- Citation: Soliman MM, Sarkar D, Glezerman I, Maybody M. Findings on intraprocedural non-contrast computed tomographic imaging following hepatic artery embolization are associated with development of contrast-induced nephropathy . World J Nephrol 2020; 9(2): 33-42
- URL: https://www.wjgnet.com/2220-6124/full/v9/i2/33.htm
- DOI: https://dx.doi.org/10.5527/wjn.v9.i2.33


