Copyright
©The Author(s) 2018.
World J Nephrol. Sep 7, 2018; 7(5): 108-116
Published online Sep 7, 2018. doi: 10.5527/wjn.v7.i5.108
Published online Sep 7, 2018. doi: 10.5527/wjn.v7.i5.108
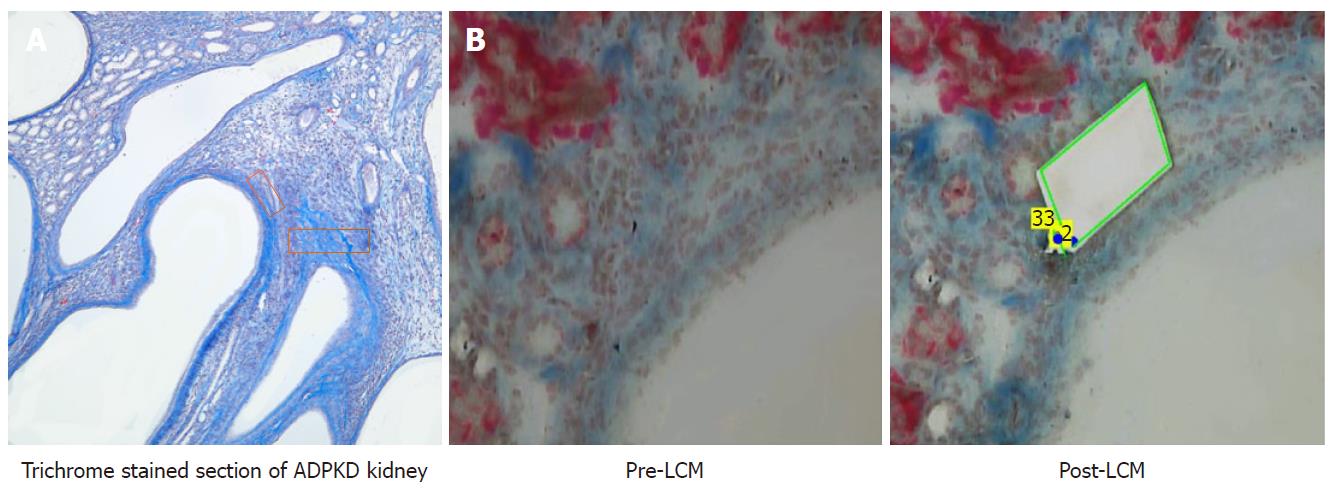
Figure 1 Laser capture microdissection of the peri-cystic local microenvironment.
A: Trichrome-stained section of a dominant polycystic kidney diseased (ADPKD) kidney with representative laser capture microdissection (LCM) areas marked by red rectangles; B: Trichrome-stained section of an ADPKD kidney before and after LCM.
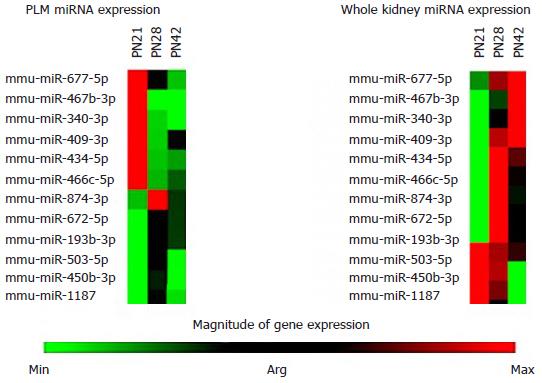
Figure 2 Heat map comparing miRNA expression.
Heat map showing comparative expression of a set of miRNAs at three different post-natal (PN) time points (PN21, PN28 and PN42) for peri-cystic local microenvironmental regions and whole kidney samples (green represents downregulated miRNA expression, whereas red represents upregulated miRNA expression).
Figure 3 miRNA expression profiles.
Expression profiles of a set of miRNAs at PN28 and PN42 that are temporally upregulated (A) and downregulated (B) when compared with PN21 in peri-cystic local microenvironmental regions.
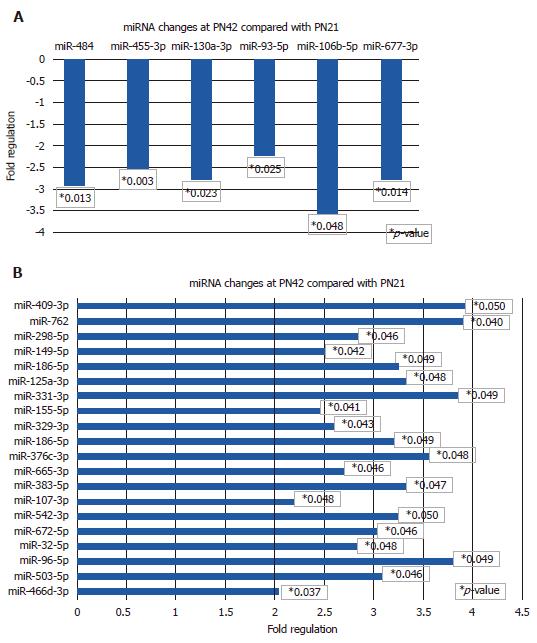
Figure 4 miRNA expression profiles.
Expression profiles of a set of miRNAs with significantly decreased (A) and increased (B) expression at PN42 in peri-cystic local microenvironmental regions compared with PN21.
- Citation: Patil A, Jr WES, Pan CG, Avner ED. Unique interstitial miRNA signature drives fibrosis in a murine model of autosomal dominant polycystic kidney disease. World J Nephrol 2018; 7(5): 108-116
- URL: https://www.wjgnet.com/2220-6124/full/v7/i5/108.htm
- DOI: https://dx.doi.org/10.5527/wjn.v7.i5.108


