Copyright
©The Author(s) 2016.
World J Nephrol. Jul 6, 2016; 5(4): 339-357
Published online Jul 6, 2016. doi: 10.5527/wjn.v5.i4.339
Published online Jul 6, 2016. doi: 10.5527/wjn.v5.i4.339
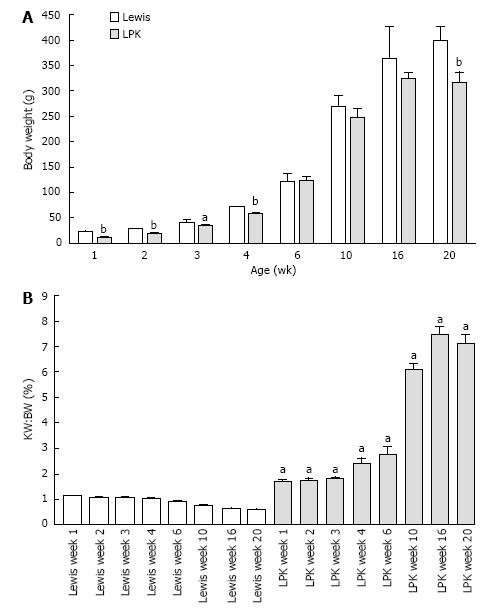
Figure 1 Body weight and kidney weight over time in Lewis and Lewis polycystic kidney rats.
A: Body weight of male Lewis and LPK rats from weeks 1 to 20. Data as mean ± SD. aP < 0.05 vs age-matched Lewis animals; bP < 0.01 vs age-matched Lewis animals; B: Percentage two kidney weight to body weight ratio (KW:BW) of male Lewis and LPK rats from weeks 1 to 20. Data as mean ± SD. aP < 0.05 vs age-matched Lewis animals. LPK: Lewis polycystic kidney.
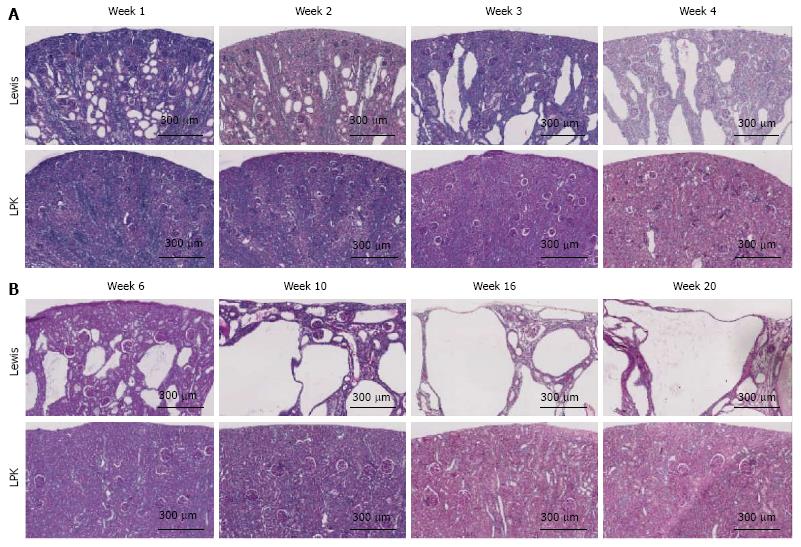
Figure 2 Whole-slide digital images of Periodic Acid Schiff-stained sections of Lewis control and Lewis polycystic kidney rat kidneys, at (A) weeks 1 to 4, and (B) weeks 6 to 20.
LPK: Lewis polycystic kidney.
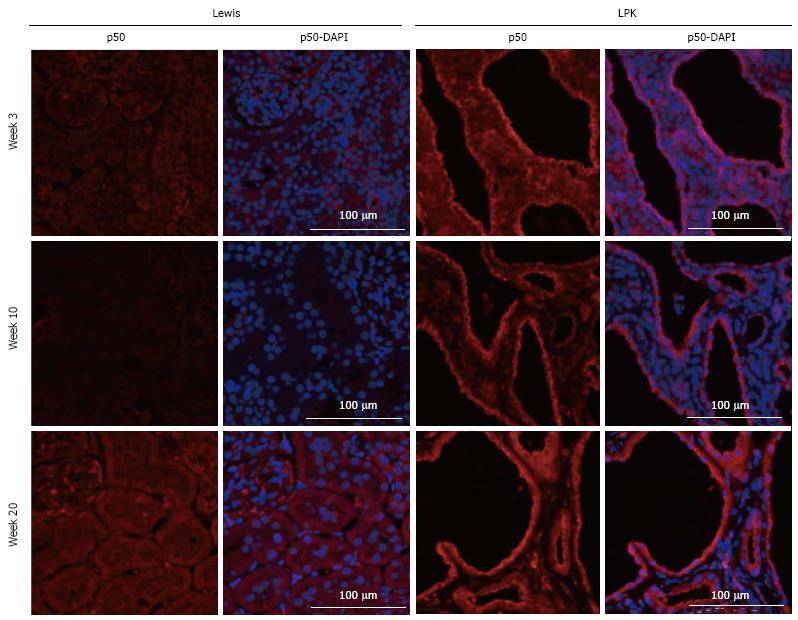
Figure 3 Immunofluorescence staining for p50 (red) at weeks 3, 10 and 20 in Lewis and Lewis polycystic kidney cortex.
Also shown are corresponding DAPI-merged images with nuclei labeled using DAPI (blue). LPK: Lewis polycystic kidney.
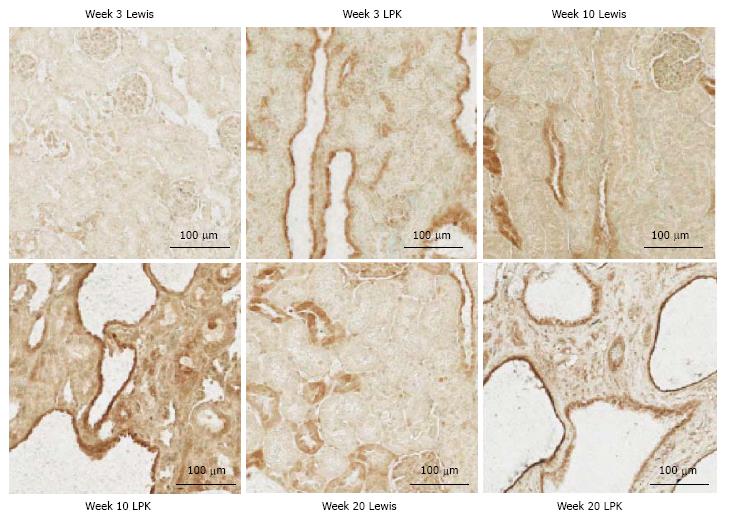
Figure 4 Immunohistochemistry for P-p105 at weeks 3, 10, and 20 in Lewis and Lewis polycystic kidney cortex.
LPK: Lewis polycystic kidney.
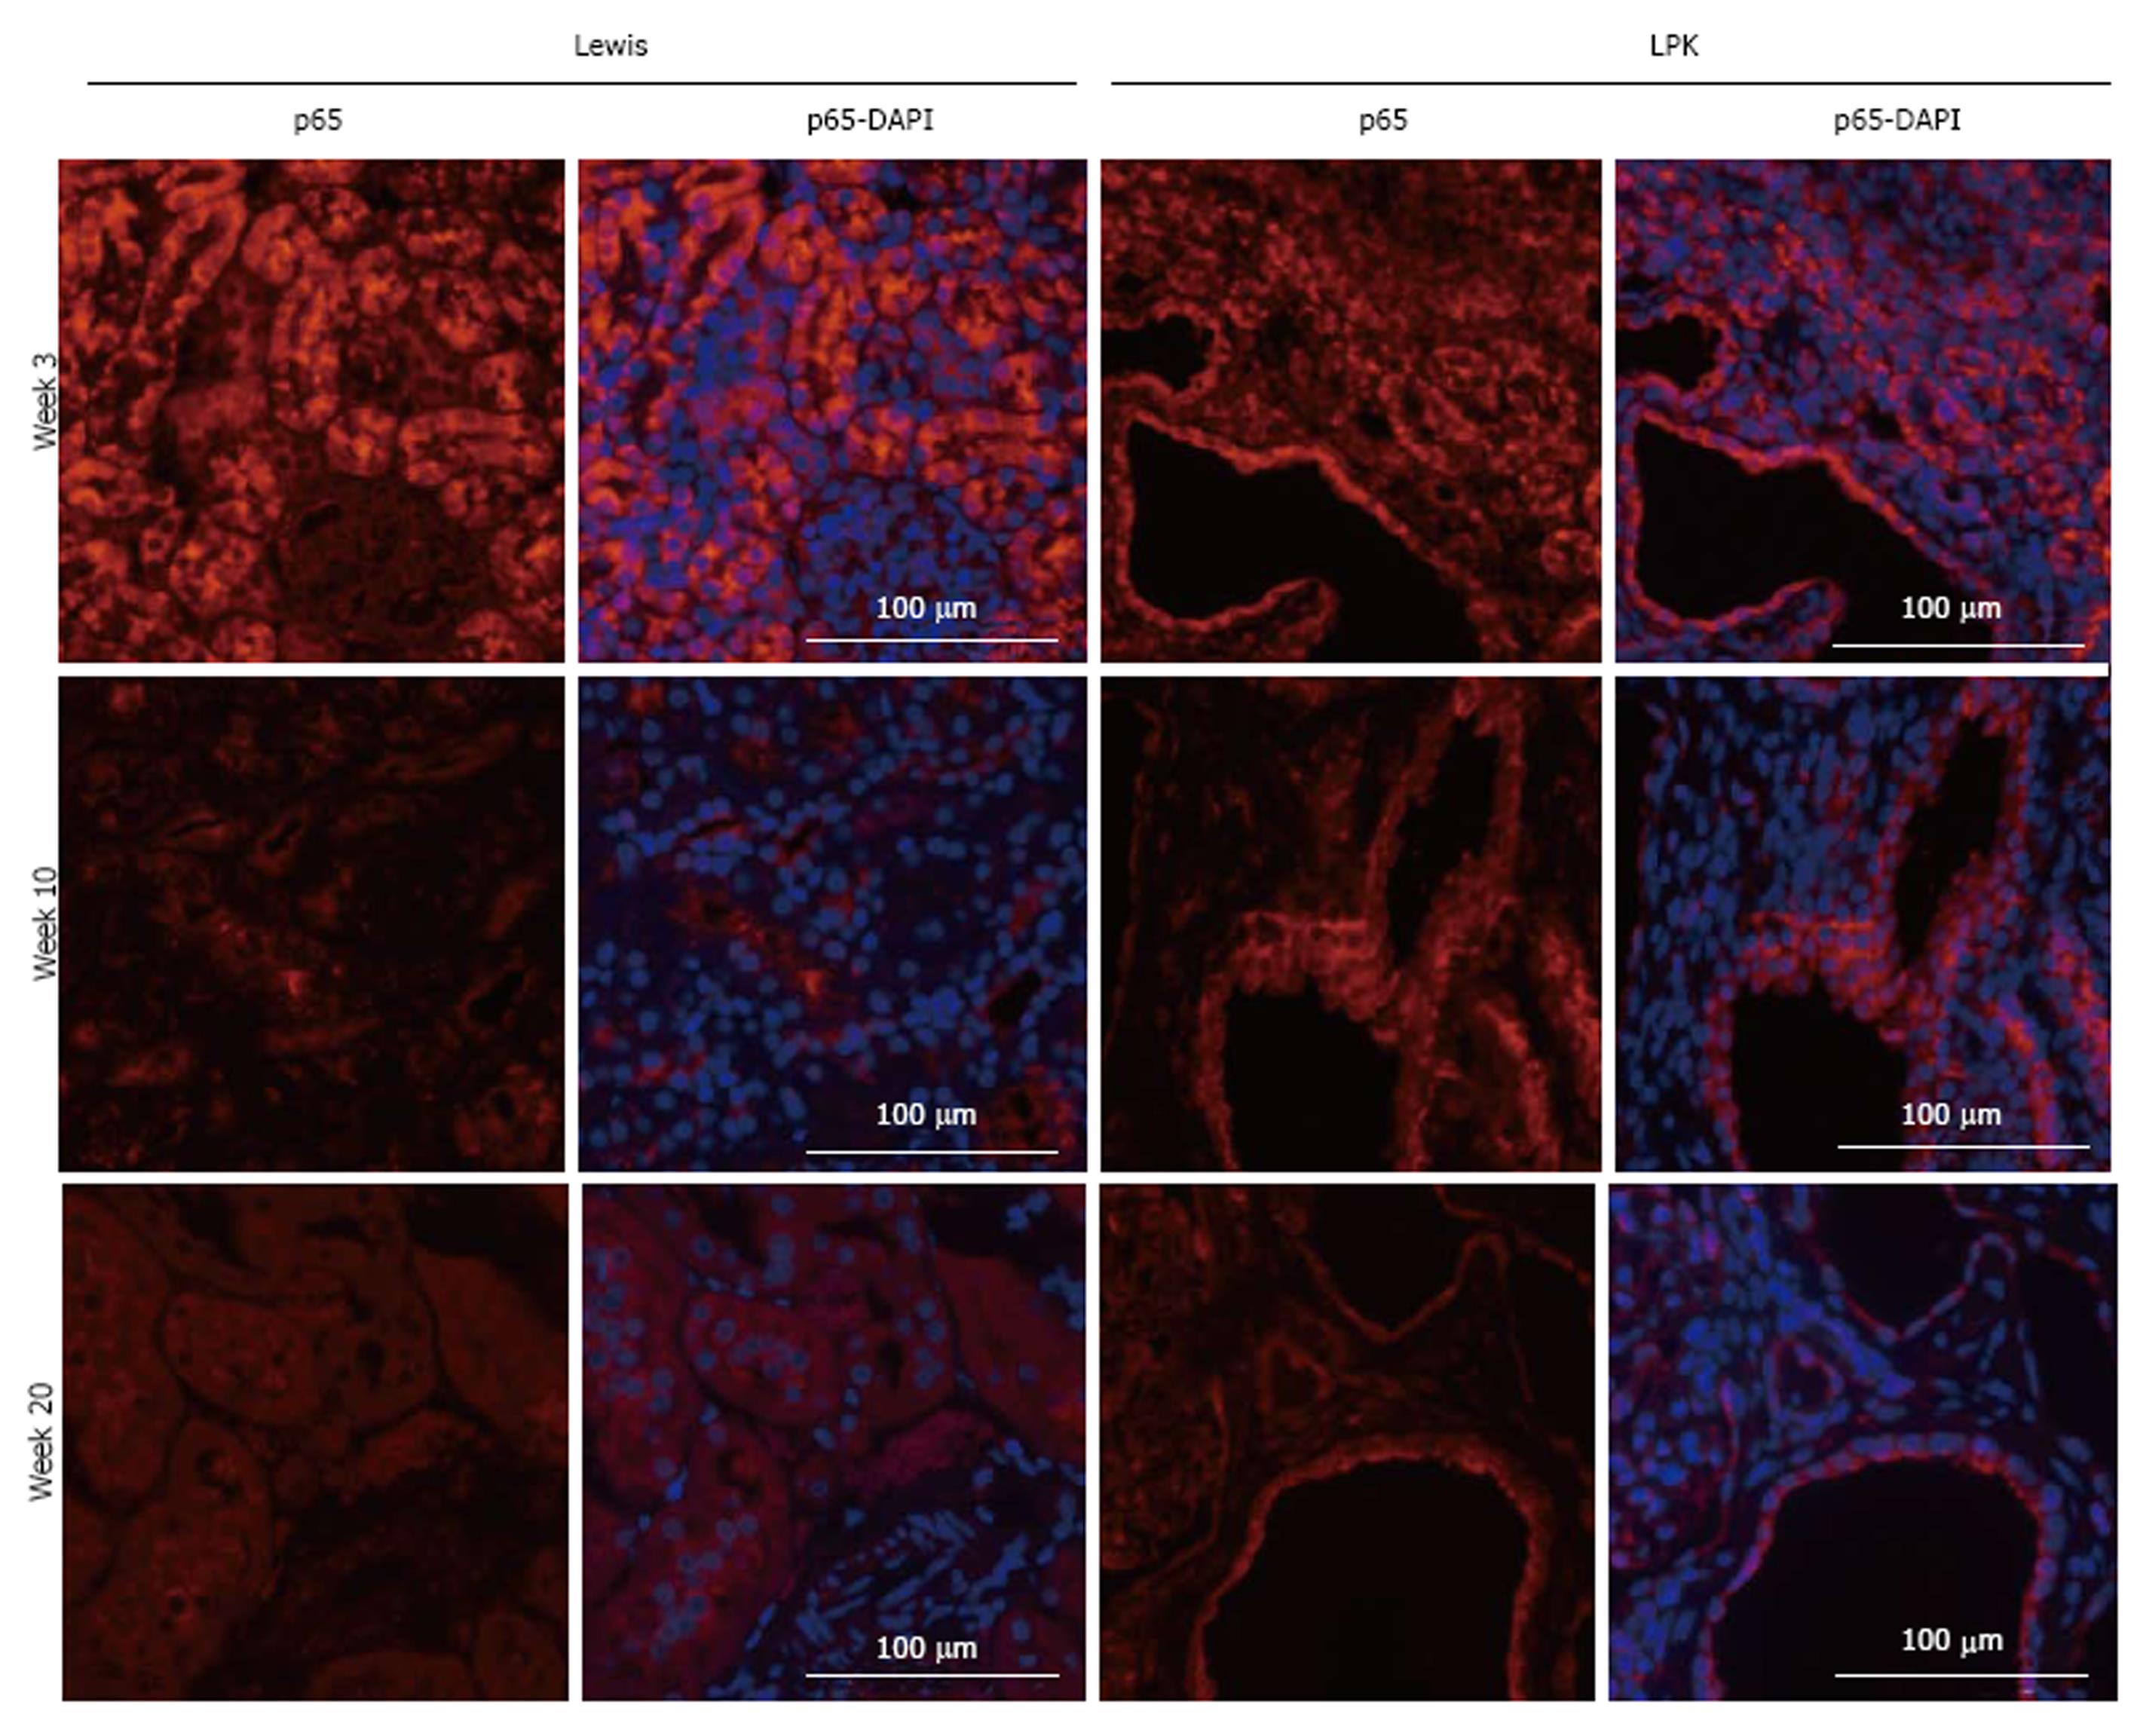
Figure 5 Immunofluorescence staining for p65 (red) at weeks 3, 10, and 20 in Lewis and Lewis polycystic kidney cortex.
Also shown are corresponding DAPI-merged images with nuclei labeled using DAPI (blue). LPK: Lewis polycystic kidney.
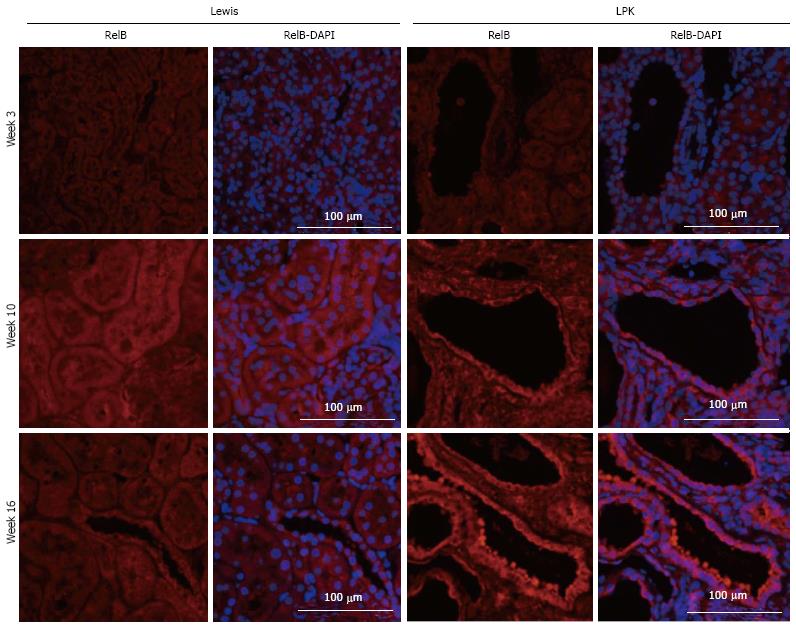
Figure 6 Immunofluorescence staining for RelB (red) at weeks 3, 10 and 16 in Lewis and Lewis polycystic kidney cortex.
Also shown are corresponding DAPI-merged images with nuclei labeled using DAPI (blue). LPK: Lewis polycystic kidney.
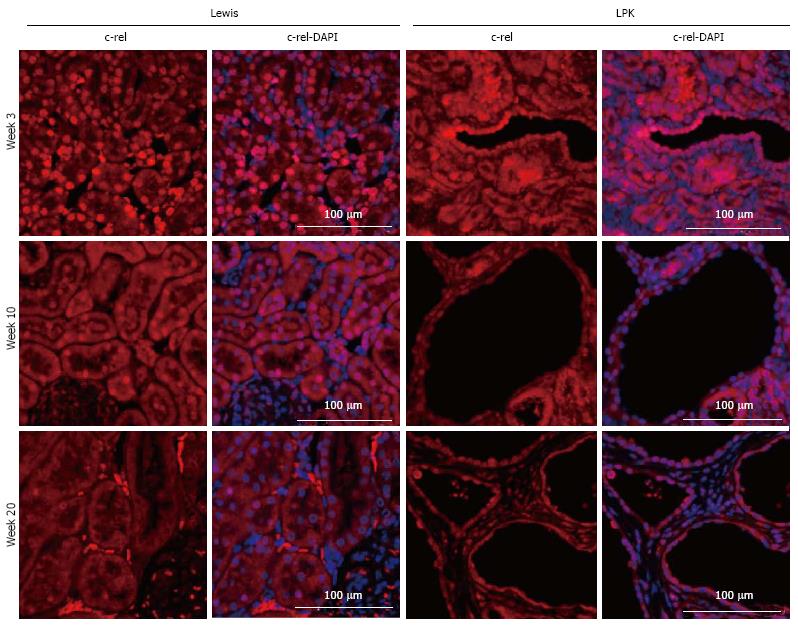
Figure 7 Immunofluorescence staining for c-rel (red) at weeks 3, 10, and 20 in Lewis and Lewis polycystic kidney cortex.
Also shown are corresponding DAPI-merged images with nuclei labeled using DAPI (blue). LPK: Lewis polycystic kidney.
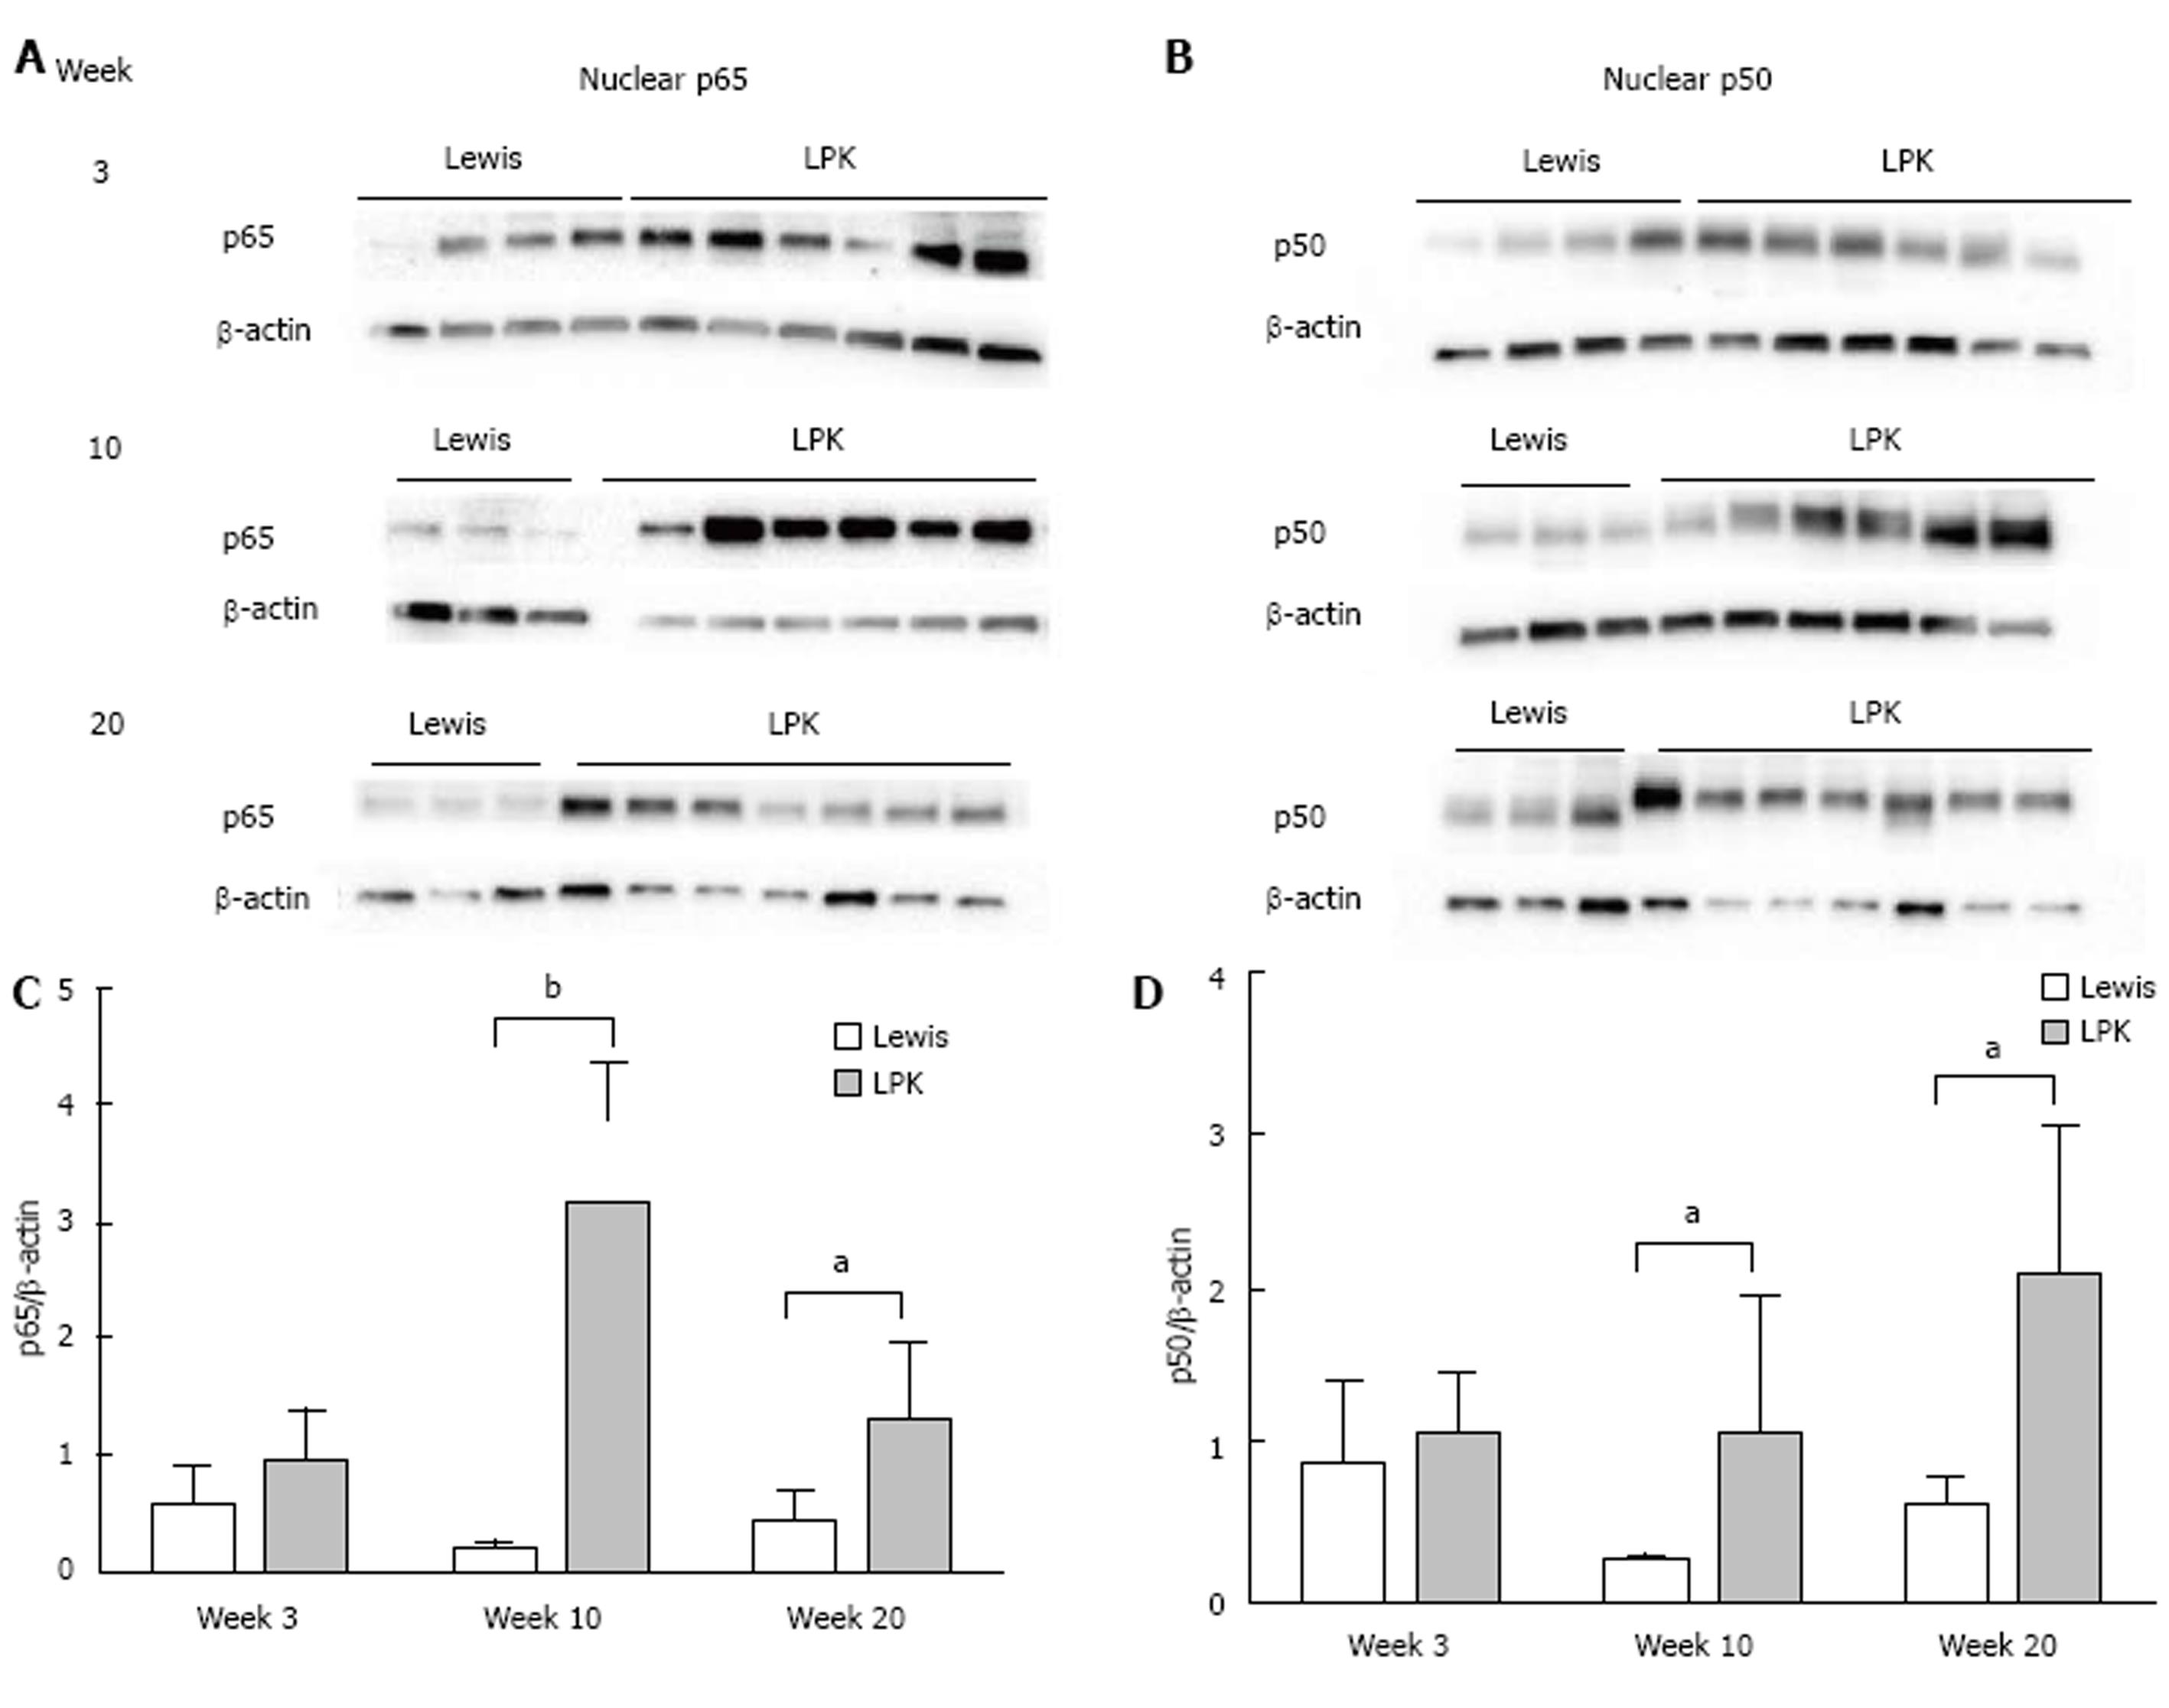
Figure 8 Western blotting for nuclear factor-κB p65 and p50 proteins in Lewis and Lewis polycystic kidney.
Immunoblotting was performed for (A) nuclear p65, and (B) nuclear p50, in Lewis and LPK kidney tissue from weeks 3, 10 and 20. Densitometry of immunoblots was quantified for (C) p65 and (D) p50. aP < 0.05 vs Lewis for the corresponding timepoint; bP < 0.01 vs Lewis for the corresponding timepoint. LPK: Lewis polycystic kidney.
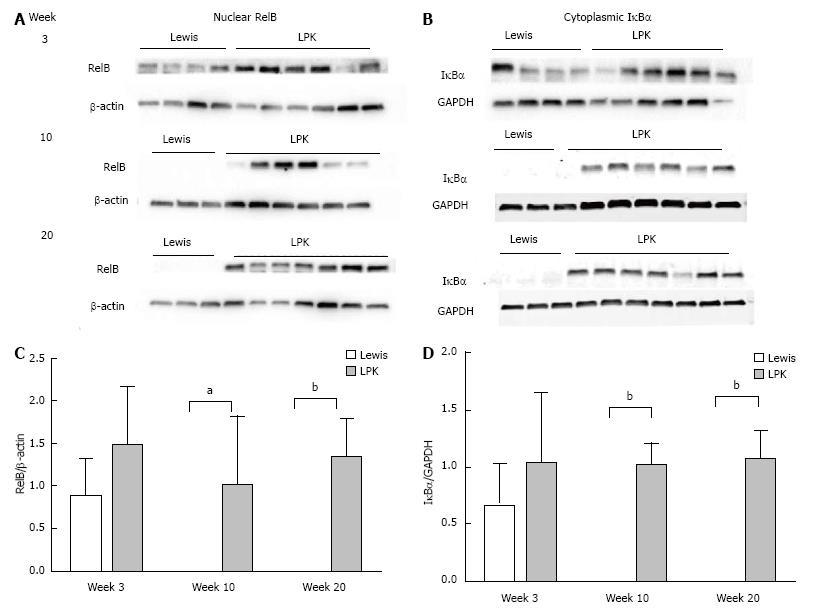
Figure 9 Western blotting for RelB and inhibitor of κB proteins in Lewis and Lewis polycystic kidney.
Immunoblotting was performed for (A) nuclear RelB, and (B) cytoplasmic IκBα, in Lewis and LPK kidney tissue from weeks 3, 10 and 20. Densitometry of immunoblots was quantified for (C) RelB and (D) IκBα. aP < 0.05 vs Lewis for the corresponding timepoint; bP < 0.01 vs Lewis for the corresponding timepoint. LPK: Lewis polycystic kidney; IκBα: Inhibitor of kappa B.
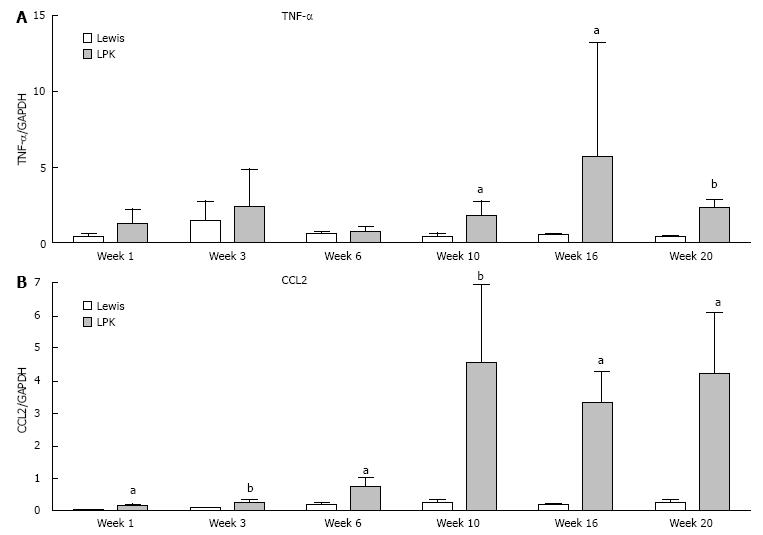
Figure 10 Quantitative polymerase chain reaction data for (A) TNFα and (B) CCL2 in Lewis and Lewis polycystic kidney tissue from weeks 1 to 20.
The mRNA expression is shown as the target gene corrected for GAPDH. aP < 0.05 vs Lewis for the corresponding timepoint; bP < 0.01 vs Lewis for the corresponding timepoint. LPK: Lewis polycystic kidney; TNF: Tumor necrosis factor.
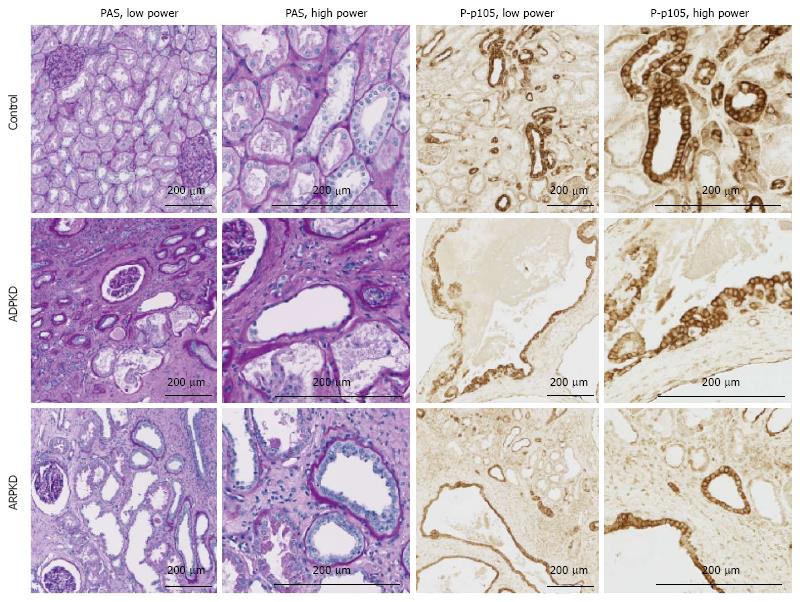
Figure 11 Periodic Acid Schiff staining (left panels) and immunohistochemistry for P-p105 (right panels) in the cortex of human normal kidney, autosomal dominant polycystic kidney disease and autosomal recessive polycystic kidney disease.
ADPKD: Autosomal dominant polycystic kidney disease; ARPKD: Autosomal recessive polycystic kidney disease; LPK: Lewis polycystic kidney; PAS: Periodic Acid Schiff.
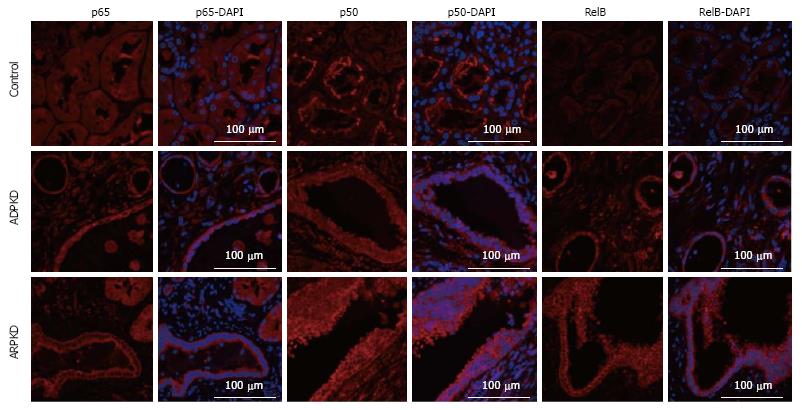
Figure 12 Immunofluorescence staining for p65, p50 and RelB (red) in human normal kidney cortex, and in autosomal dominant polycystic kidney disease and autosomal recessive polycystic kidney disease kidney cortex.
Also shown are corresponding DAPI-merged images with nuclei labeled using DAPI (blue). ADPKD: Autosomal dominant polycystic kidney disease; ARPKD: Autosomal recessive polycystic kidney disease; LPK: Lewis polycystic kidney.
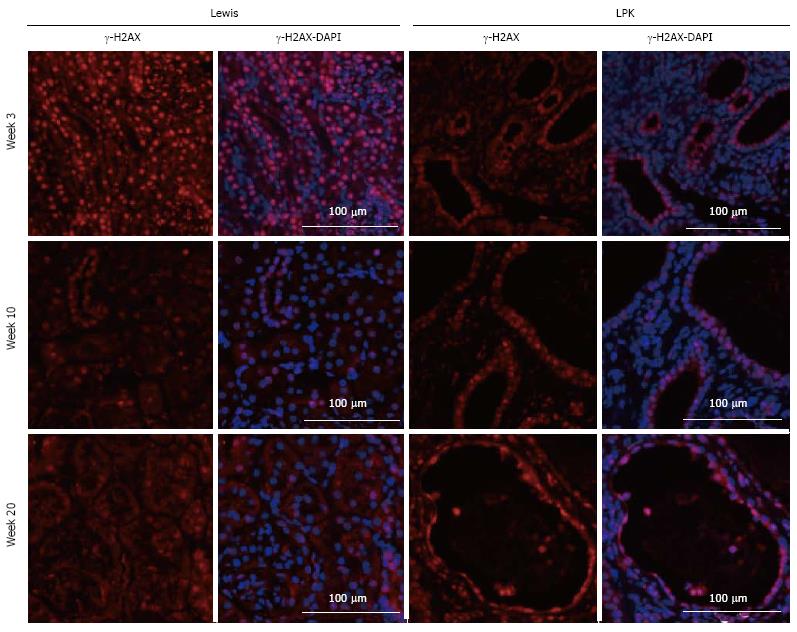
Figure 13 Immunofluorescence staining for γ-H2AX (red) at week 3, 10 and 20 in Lewis and Lewis polycystic kidney cortex.
Also shown are corresponding DAPI-merged images with nuclei labeled using DAPI (blue).
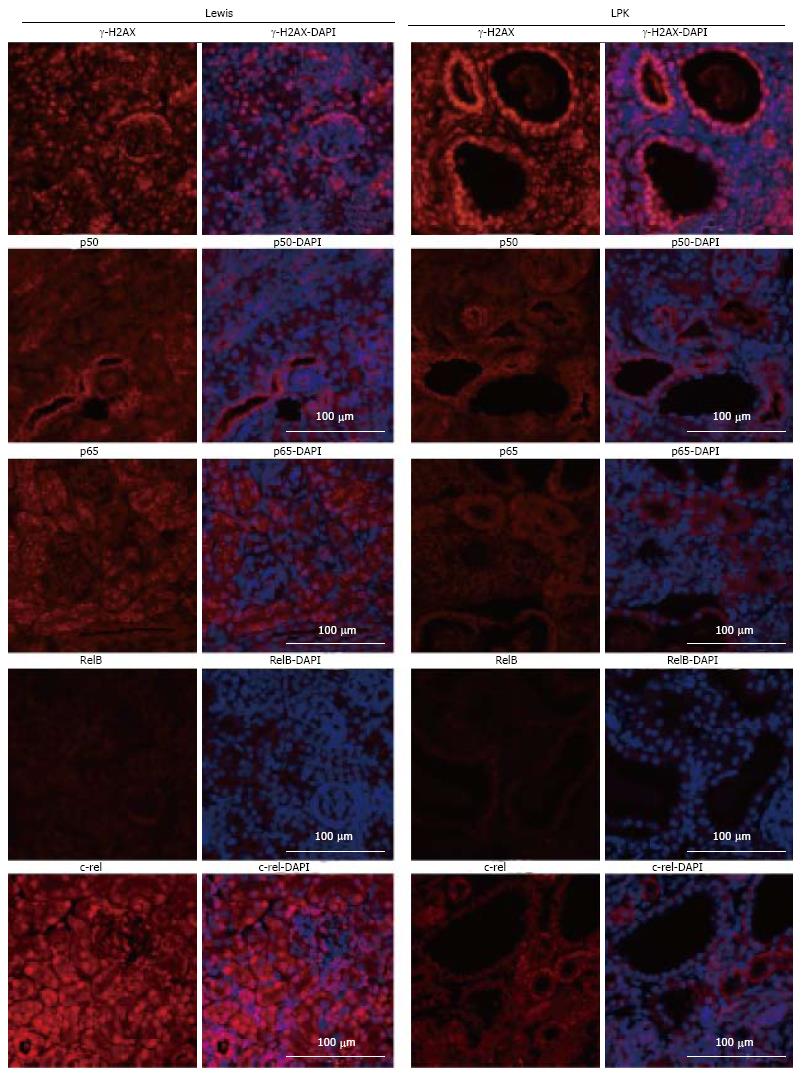
Figure 14 Immunofluorescence staining for γ-H2AX, p50, p65, RelB and c-rel (red) at week 1 in Lewis and Lewis polycystic kidney cortex.
Also shown are corresponding DAPI-merged images with nuclei labeled using DAPI (blue). LPK: Lewis polycystic kidney.
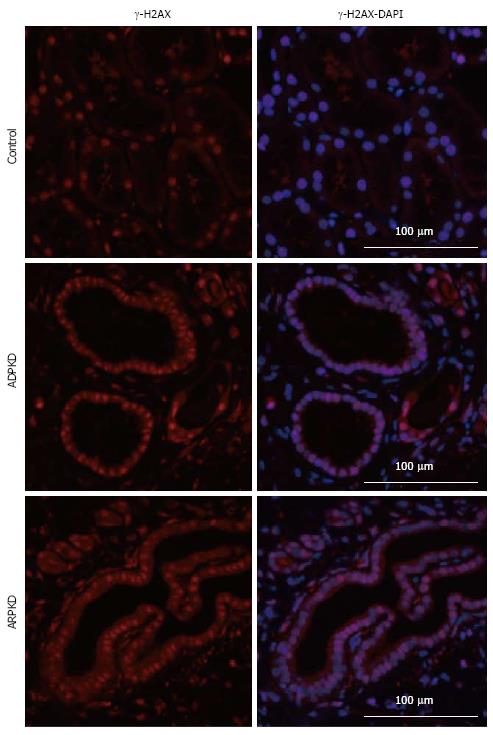
Figure 15 Immunofluorescence staining for γ-H2AX (red) in human normal kidney cortex, and in autosomal dominant polycystic kidney disease and autosomal recessive polycystic kidney disease kidney cortex.
Also shown are corresponding DAPI-merged images with nuclei labeled using DAPI (blue). ADPKD: Autosomal dominant polycystic kidney disease; ARPKD: Autosomal recessive polycystic kidney disease.
- Citation: Ta MHT, Schwensen KG, Liuwantara D, Huso DL, Watnick T, Rangan GK. Constitutive renal Rel/nuclear factor-κB expression in Lewis polycystic kidney disease rats. World J Nephrol 2016; 5(4): 339-357
- URL: https://www.wjgnet.com/2220-6124/full/v5/i4/339.htm
- DOI: https://dx.doi.org/10.5527/wjn.v5.i4.339


