Copyright
©2014 Baishideng Publishing Group Inc.
World J Nephrol. Nov 6, 2014; 3(4): 256-267
Published online Nov 6, 2014. doi: 10.5527/wjn.v3.i4.256
Published online Nov 6, 2014. doi: 10.5527/wjn.v3.i4.256
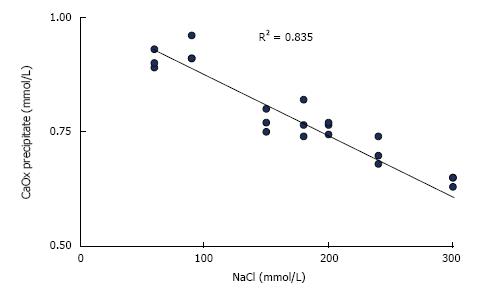
Figure 1 Influence of NaCl concentration on CaOx precipitation calculated from Ca decrease after the addition of 1.
0 mmol/L sodium oxalate to aqueous solution of 1.5 mmol/L CaCl2 buffered to pH 6.0 with 5 mmol/L sodium cacodylate.
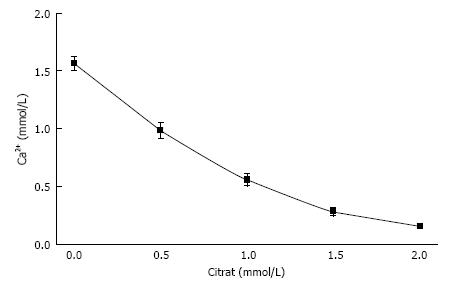
Figure 2 Influence of citrate concentration on free ionic Ca concentration (Ca2+) in a solution like in Figure 1 but containing 100 mmol/L NaCl (mean ± SD, n = 5).
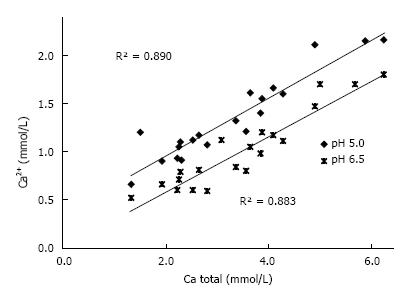
Figure 3 Correlation Ca2+ and total Ca concentration in 20 urines at pH 5.
0 and 6.5.
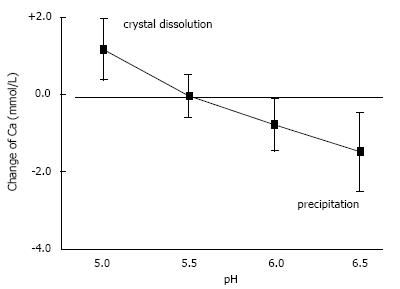
Figure 4 Influence of pH on solubility of hydroxyapatite demonstrated by the change of Ca concentration after equilibration of 20 urines with 10 mg/mL hydroxyapatite (mean ± SD).
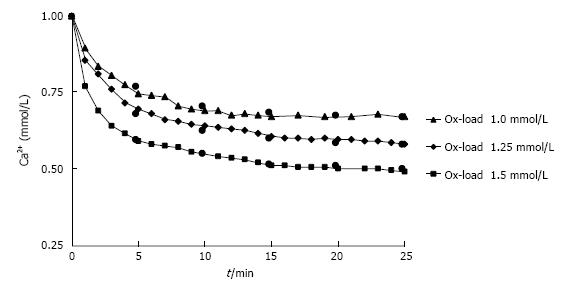
Figure 5 Decrease of Ca2+ in urine during observation time (t) after different Ox additions (1.
0-1.5 mmol/L). Measured (triangle/diamond/square) and by RDt (see text) calculated values (black circle).
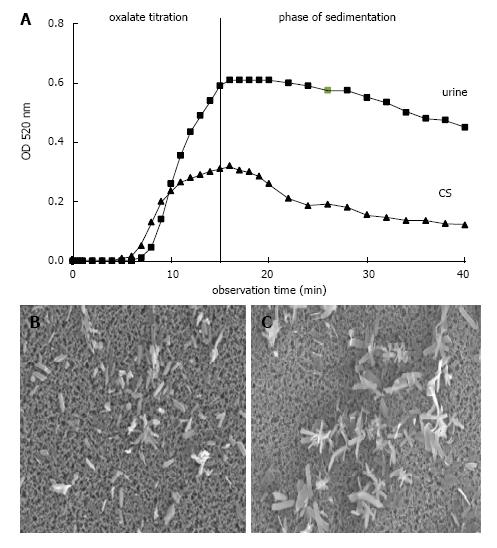
Figure 6 Ox titration.
A: Spectrophotometric crystallization curve of Ox titration (0.1 mmol/min.) in urine and control solution (CS) both with pH 6.0, 100 mmol/L NaCl, initially 2 mmol/L Ca2+ and with total 1.5 mmol/L Ox addition by titration; B: Scanning microscopy of deposit on Millipore filter obtained at the end of Ox titration from urine and (C) from CS.
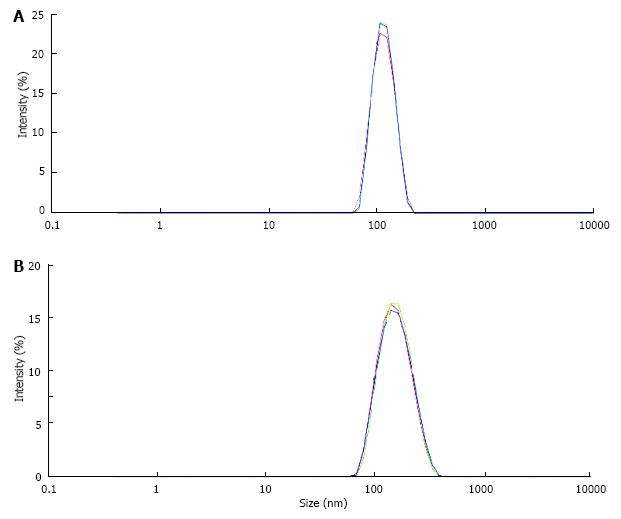
Figure 7 Particle size distribution in suspension of latex beads (size 100 nm, concentration 0.
025%/mL) measured by a Zetasizer (A) in control solution, (B) in solution of urinary macromolecules obtained by CaP precipitation and dissolution of the precipitate.
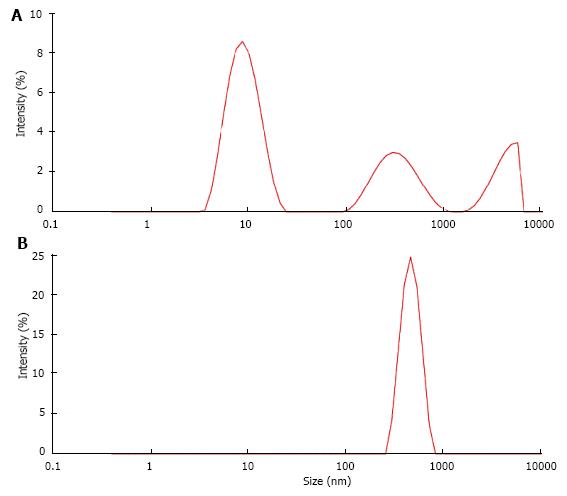
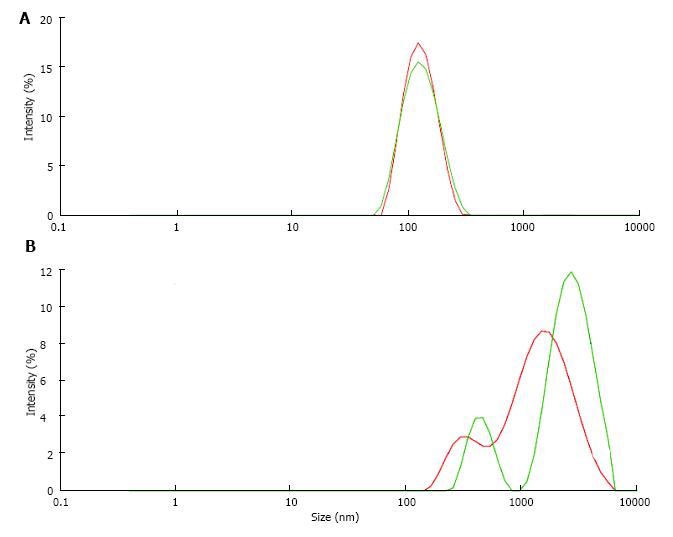
Figure 8 Particle size distribution (A) in albumin solution (AS, 20 μg/mL) and (B) in solution obtained from AS after CaP precipitation and dissolution of the precipitate (DPA).
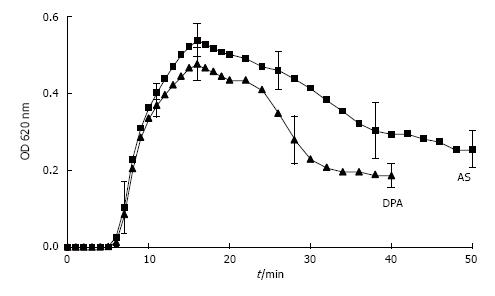
Figure 9 Spectrophotometric crystallization curve of Ox titration in AS and in DPA with pH 6.
0, 100 mmol/L NaCl, initial 2.0 mmol/L Ca2+ and 1.5 m mmol/L Ox addition by titration. (Further details see Figure 8) (mean ± SD, n = 5).
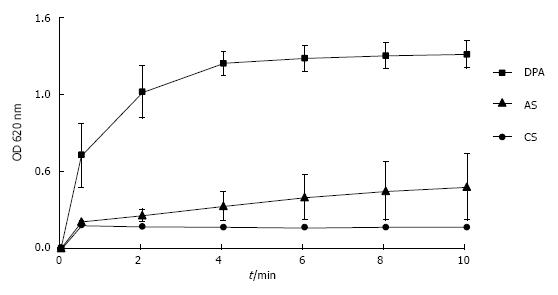
Figure 10 Increase of optical density of suspensions of latex beads reflecting increase of particle size by aggregation in control solution, in albumin solution and in aggreagted albumin.
(Further details see Figure 8) (mean ± SD, n = 5). CS: Control solution.
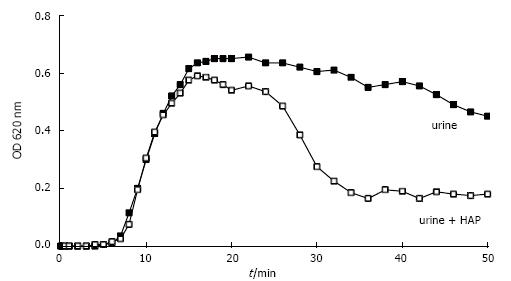
Figure 11 Spectrophotometric crystallization curve of Ox titration in urine without and with previous addition of 0.
05 mg/L HAP.
Figure 12 Particle size distribution of latex beads (A) at pH 6.
0 and (B) at pH 5.0 in solution of urinary macromolecules obtained by CaP precipitation.
- Citation: Baumann JM, Affolter B. From crystalluria to kidney stones, some physicochemical aspects of calcium nephrolithiasis. World J Nephrol 2014; 3(4): 256-267
- URL: https://www.wjgnet.com/2220-6124/full/v3/i4/256.htm
- DOI: https://dx.doi.org/10.5527/wjn.v3.i4.256


