Copyright
©2013 Baishideng Publishing Group Co.
World J Nephrol. Nov 6, 2013; 2(4): 129-135
Published online Nov 6, 2013. doi: 10.5527/wjn.v2.i4.129
Published online Nov 6, 2013. doi: 10.5527/wjn.v2.i4.129
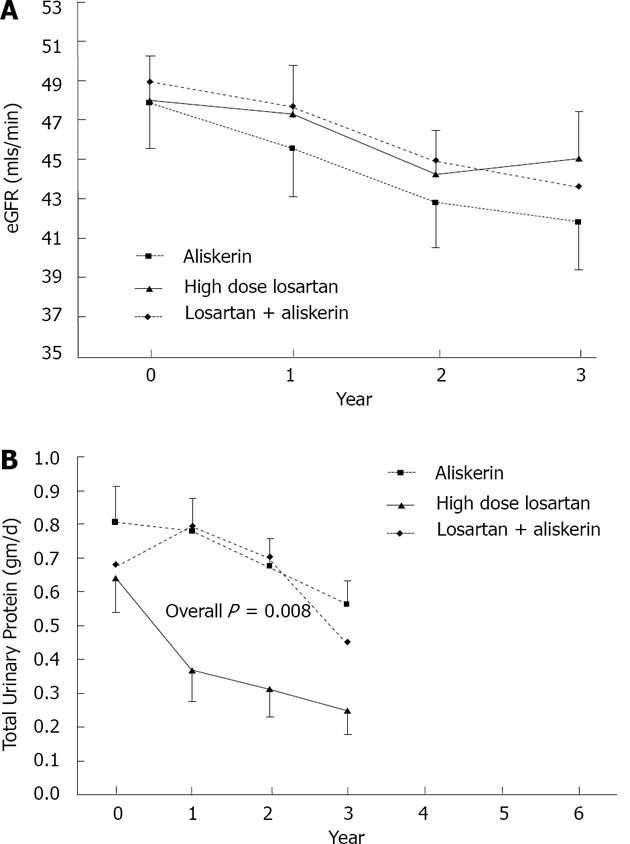
Figure 1 Mean estimated glomerular filtration rate and mean total urinary protein with its standard error for the 3 treatment groups.
A: Mean estimated Glomerular Filtration Rate; B: Mean Total Urinary Protein. eGFR: Estimated glomerular filtration rate; TUP: Total urinary protein; SE: Standard error.
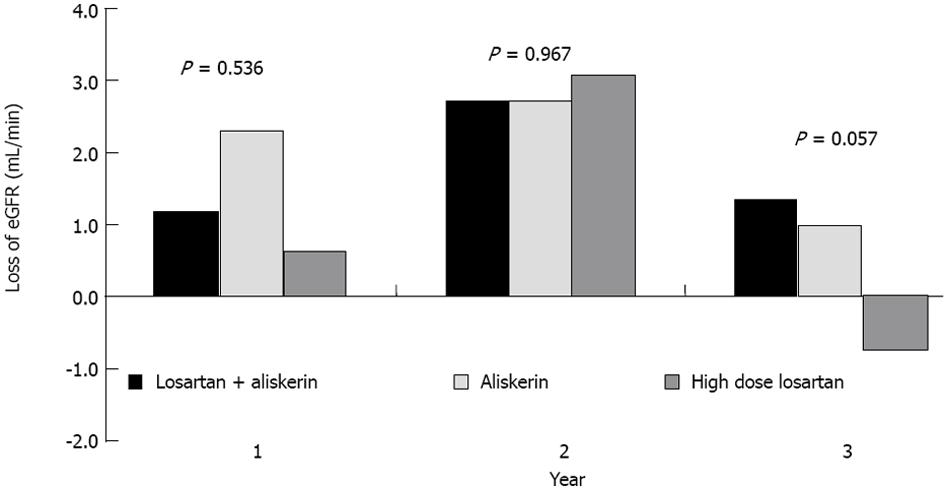
Figure 2 Loss of estimated glomerular filtration rate in each year.
eGFR: Estimated Glomerular Filtration Rate.
Figure 3 Mean systolic blood pressure and diastolic blood pressure with its standard error for the 3 treatment groups.
A: Systolic Bp; B: Diastolic Bp. SE: Standard error; Bp: Blood pressure.
- Citation: Woo KT, Choong HL, Wong KS, Tan HK, Foo M, Stephanie FC, Lee EJ, Anantharaman V, Lee GS, Chan CM. A retrospective Aliskiren and Losartan study in non-diabetic chronic kidney disease. World J Nephrol 2013; 2(4): 129-135
- URL: https://www.wjgnet.com/2220-6124/full/v2/i4/129.htm
- DOI: https://dx.doi.org/10.5527/wjn.v2.i4.129


