Copyright
©2013 Baishideng Publishing Group Co.
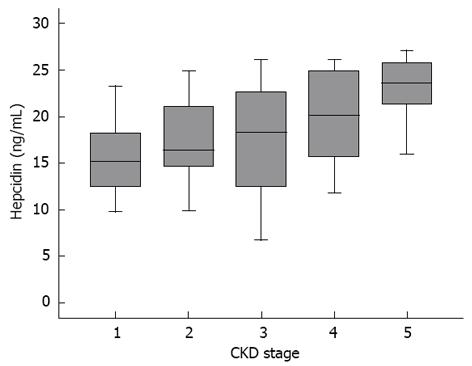
Figure 1 Box plots of the serum hepcidin levels in different stages of chronic kidney disease.
Patients with chronic kidney disease (CKD) stage 1 [n = 14, estimated glomerular filtration rate (eGFR) = 123 ± 22.5 mL/min per 1.73 m2], CKD stage 2 (n = 16, eGFR = 75 ± 7.1 mL/min per 1.73 m2), CKD stage 3 (n = 38, eGFR = 43 ± 10.1 mL/min per 1.73 m2), CKD stage 4 (n = 34, eGFR = 22 ± 4.9 mL/min per 1.73 m2), and CKD stage 5 (n = 44, eGFR = 7.8 ± 2.8 mL/min per 1.73 m2). The boxes represent the first quartile, median, and third quartile of each group. Patients in each stage of CKD had significantly different hepcidin levels. In addition, subjects with higher CKD stages had higher serum hepcidin levels than those with lower CKD stages with a stepwise relationship.
- Citation: Hsieh YP, Huang CH, Lee CY, Chen HL, Lin CY, Chang CC. Hepcidin-25 negatively predicts left ventricular mass index in chronic kidney disease patients. World J Nephrol 2013; 2(2): 38-43
- URL: https://www.wjgnet.com/2220-6124/full/v2/i2/38.htm
- DOI: https://dx.doi.org/10.5527/wjn.v2.i2.38


