Copyright
©The Author(s) 2025.
World J Nephrol. Jun 25, 2025; 14(2): 101961
Published online Jun 25, 2025. doi: 10.5527/wjn.v14.i2.101961
Published online Jun 25, 2025. doi: 10.5527/wjn.v14.i2.101961
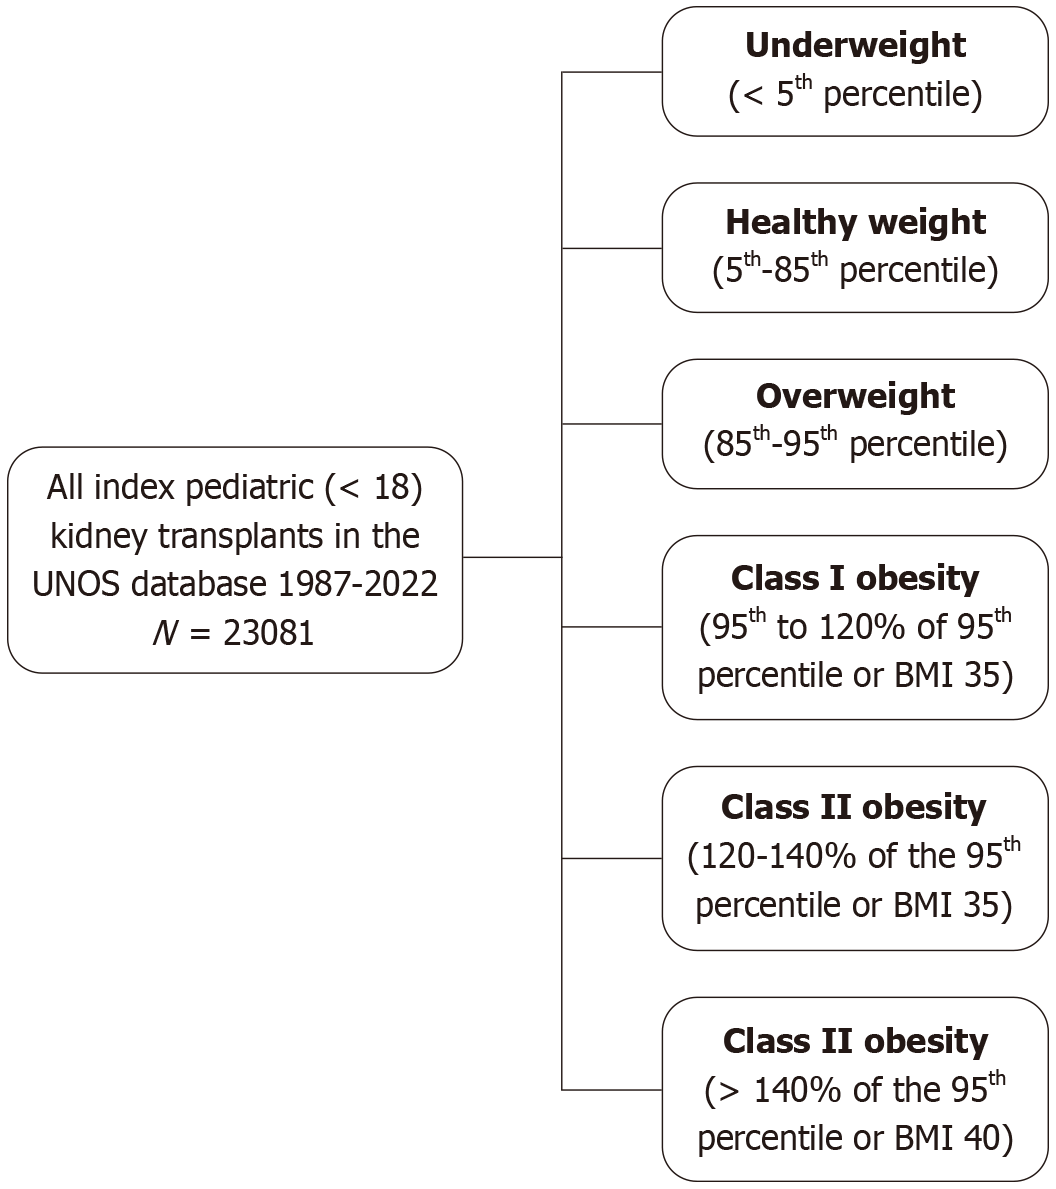
Figure 1 Representation of the separation of all pediatric kidney transplants into body mass index groups.
BMI: Body mass index.
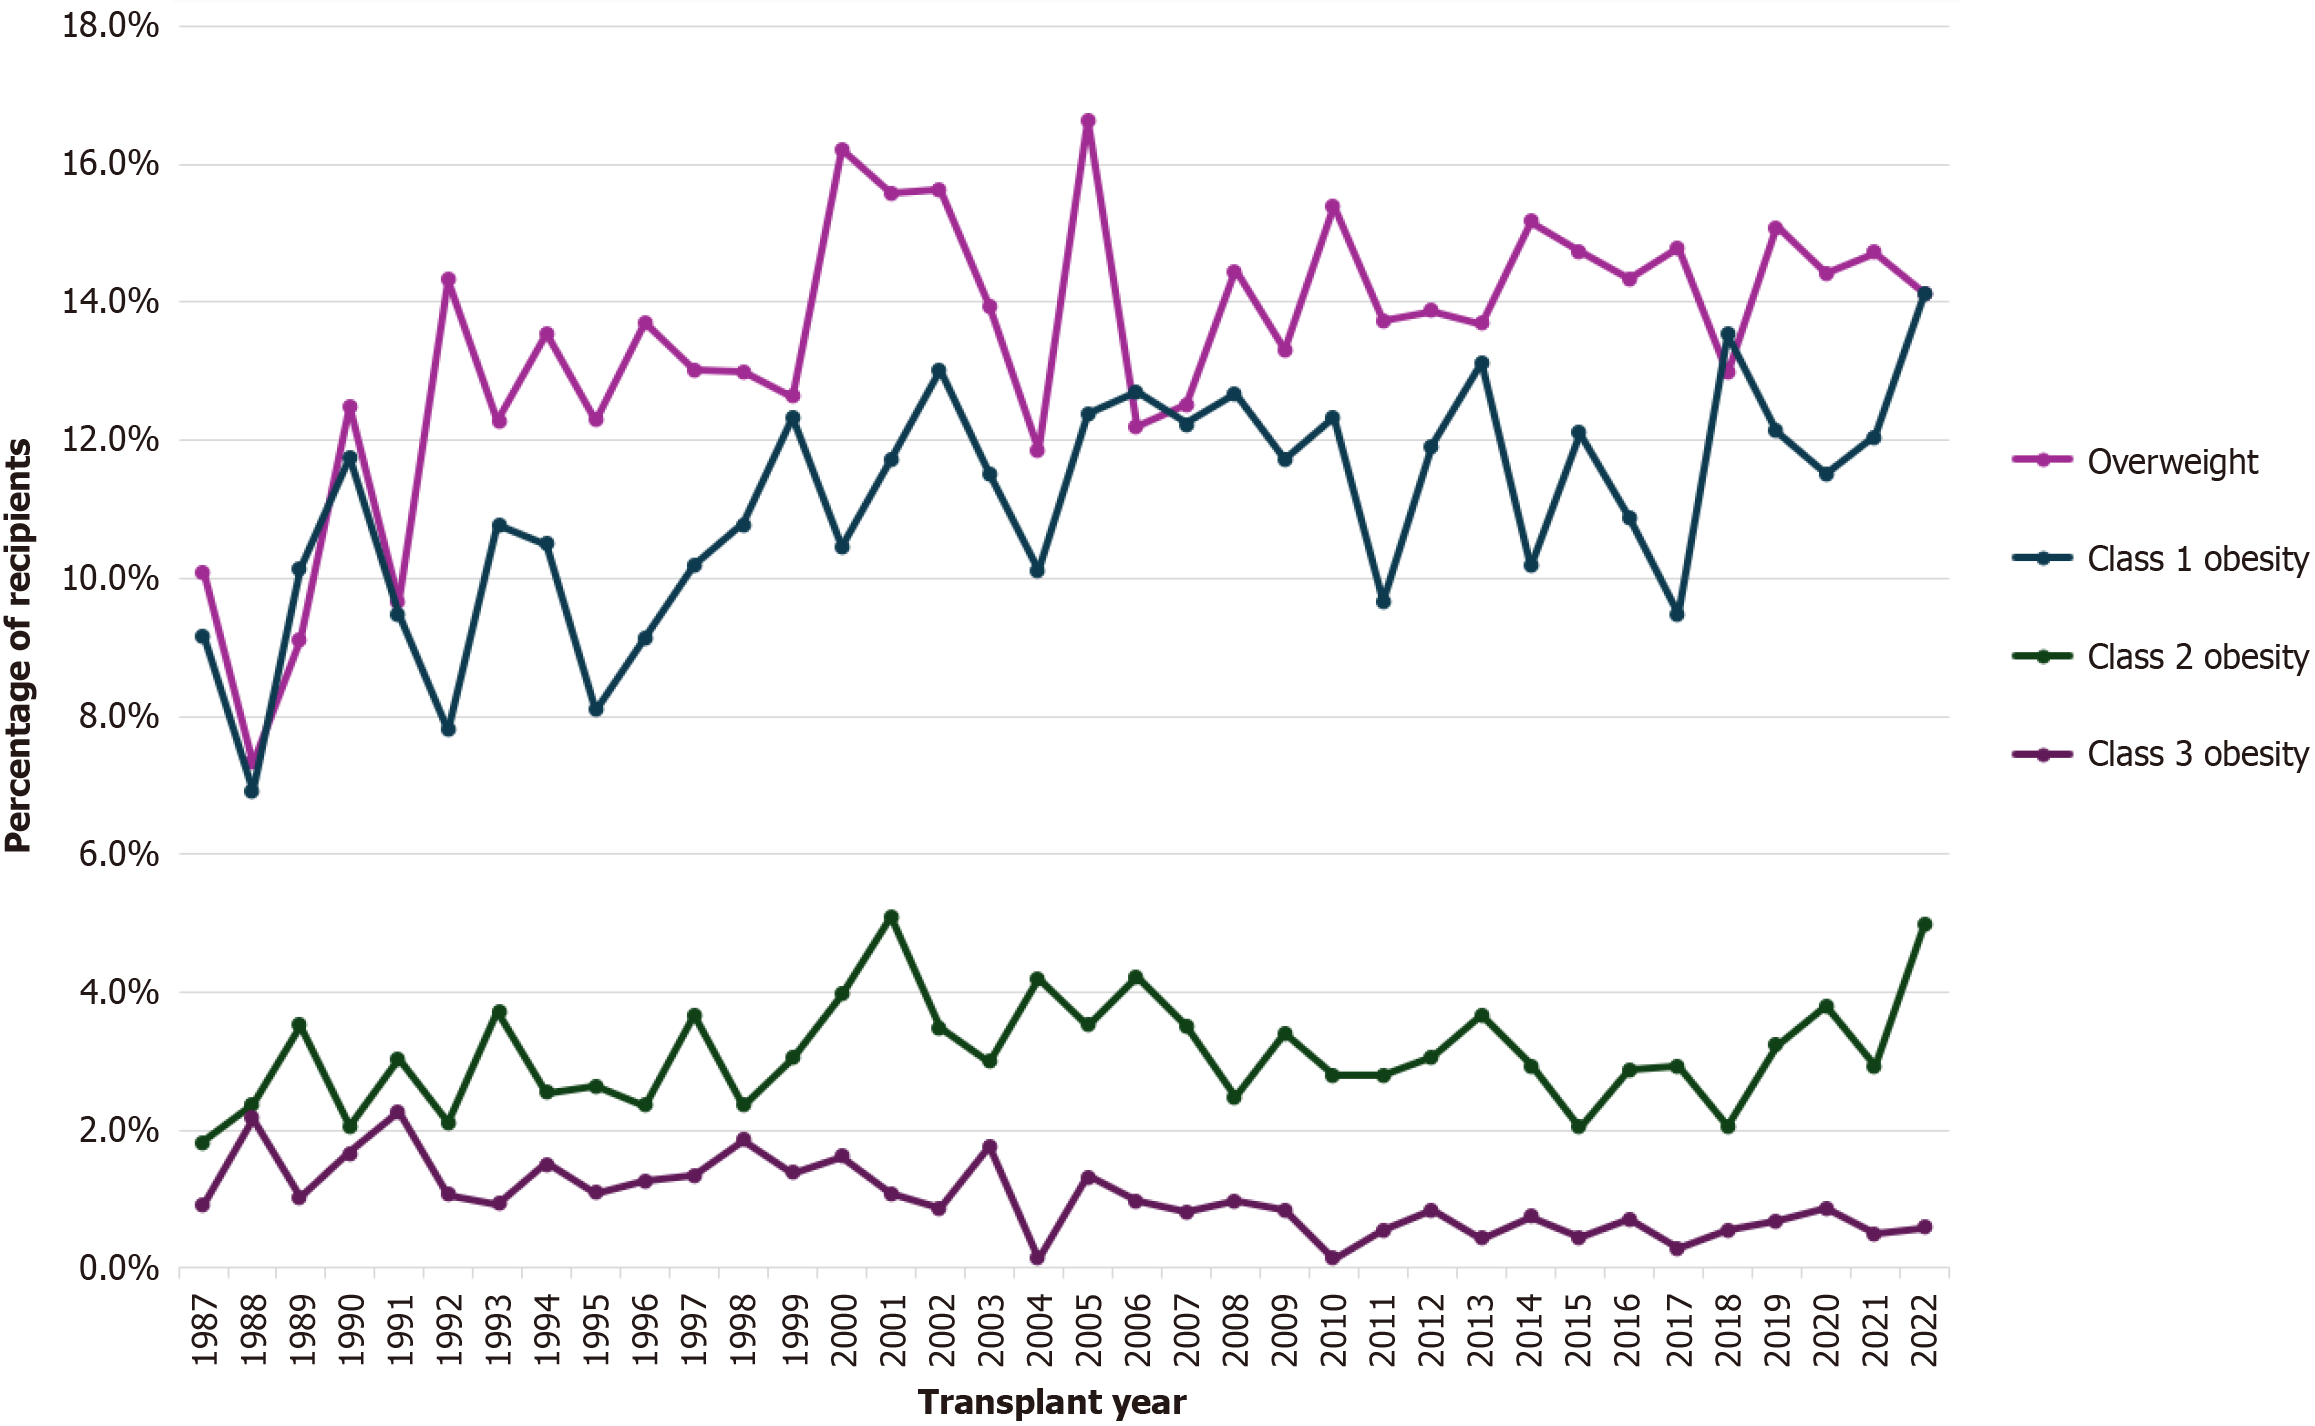
Figure 2
Line graph depicting trends in the percentage of overweight, obese I, obese II, and obese III pediatric recipients over time.
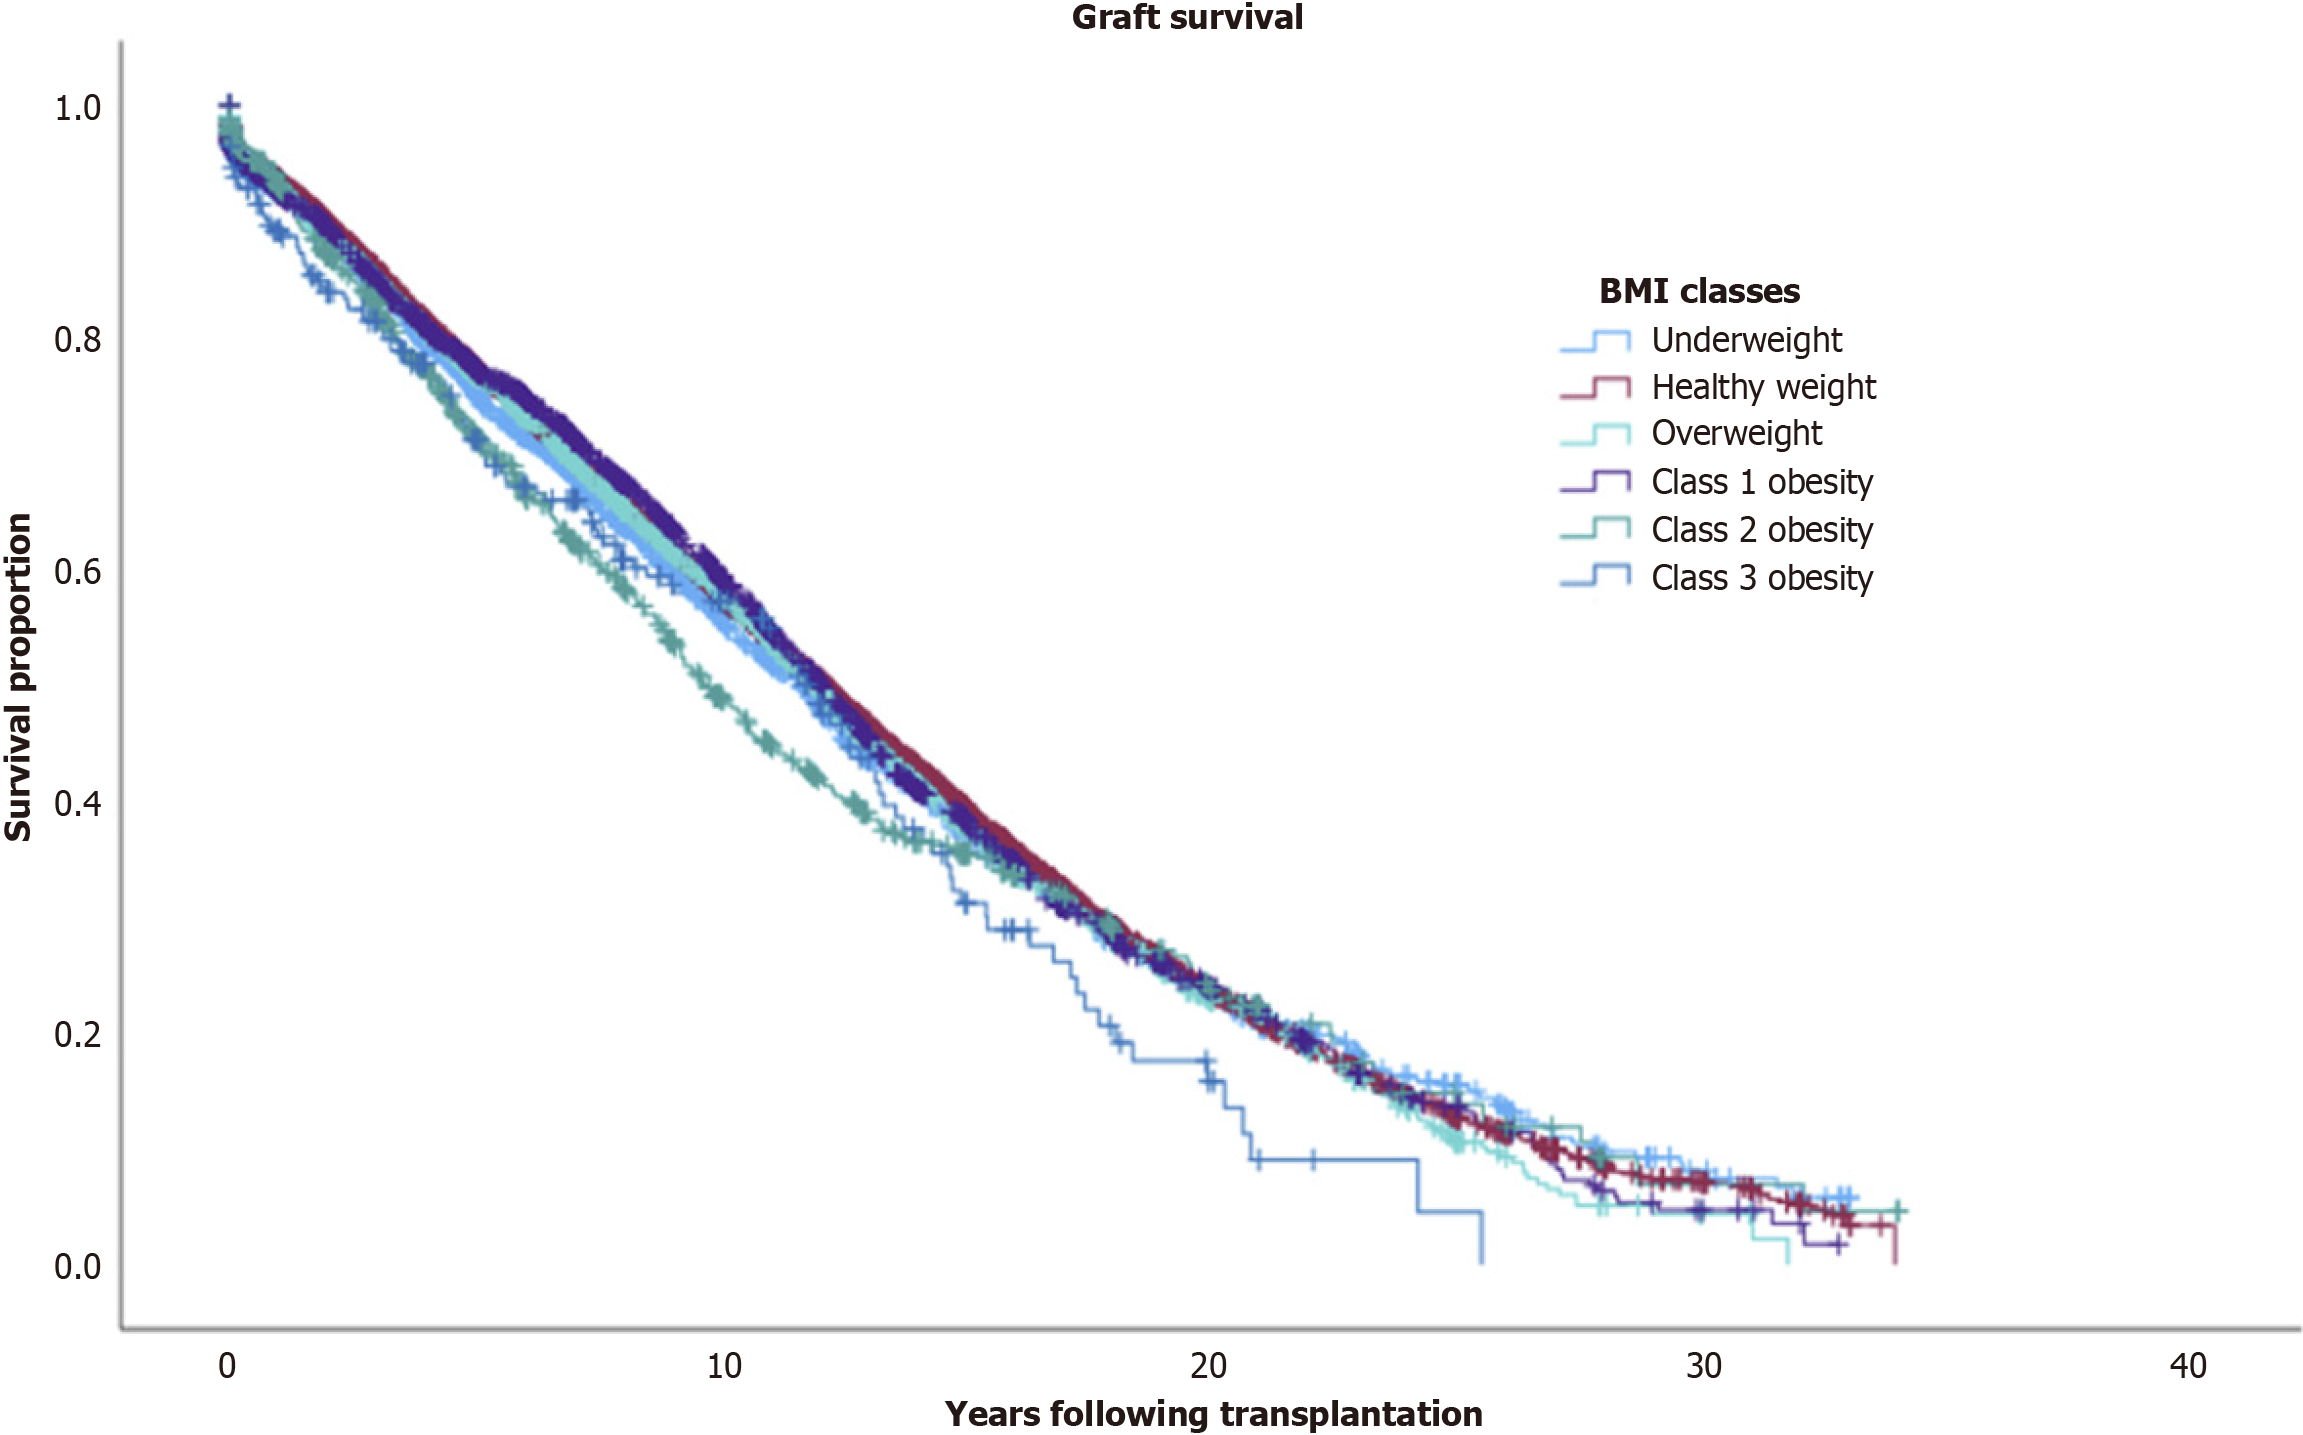
Figure 3 Kaplan-Meier estimates of kidney allograft survival between body mass index classes.
Correlate statistically significant differences in graft survival between body mass index classes using the log-rank testing in Table 2. BMI: Body mass index.
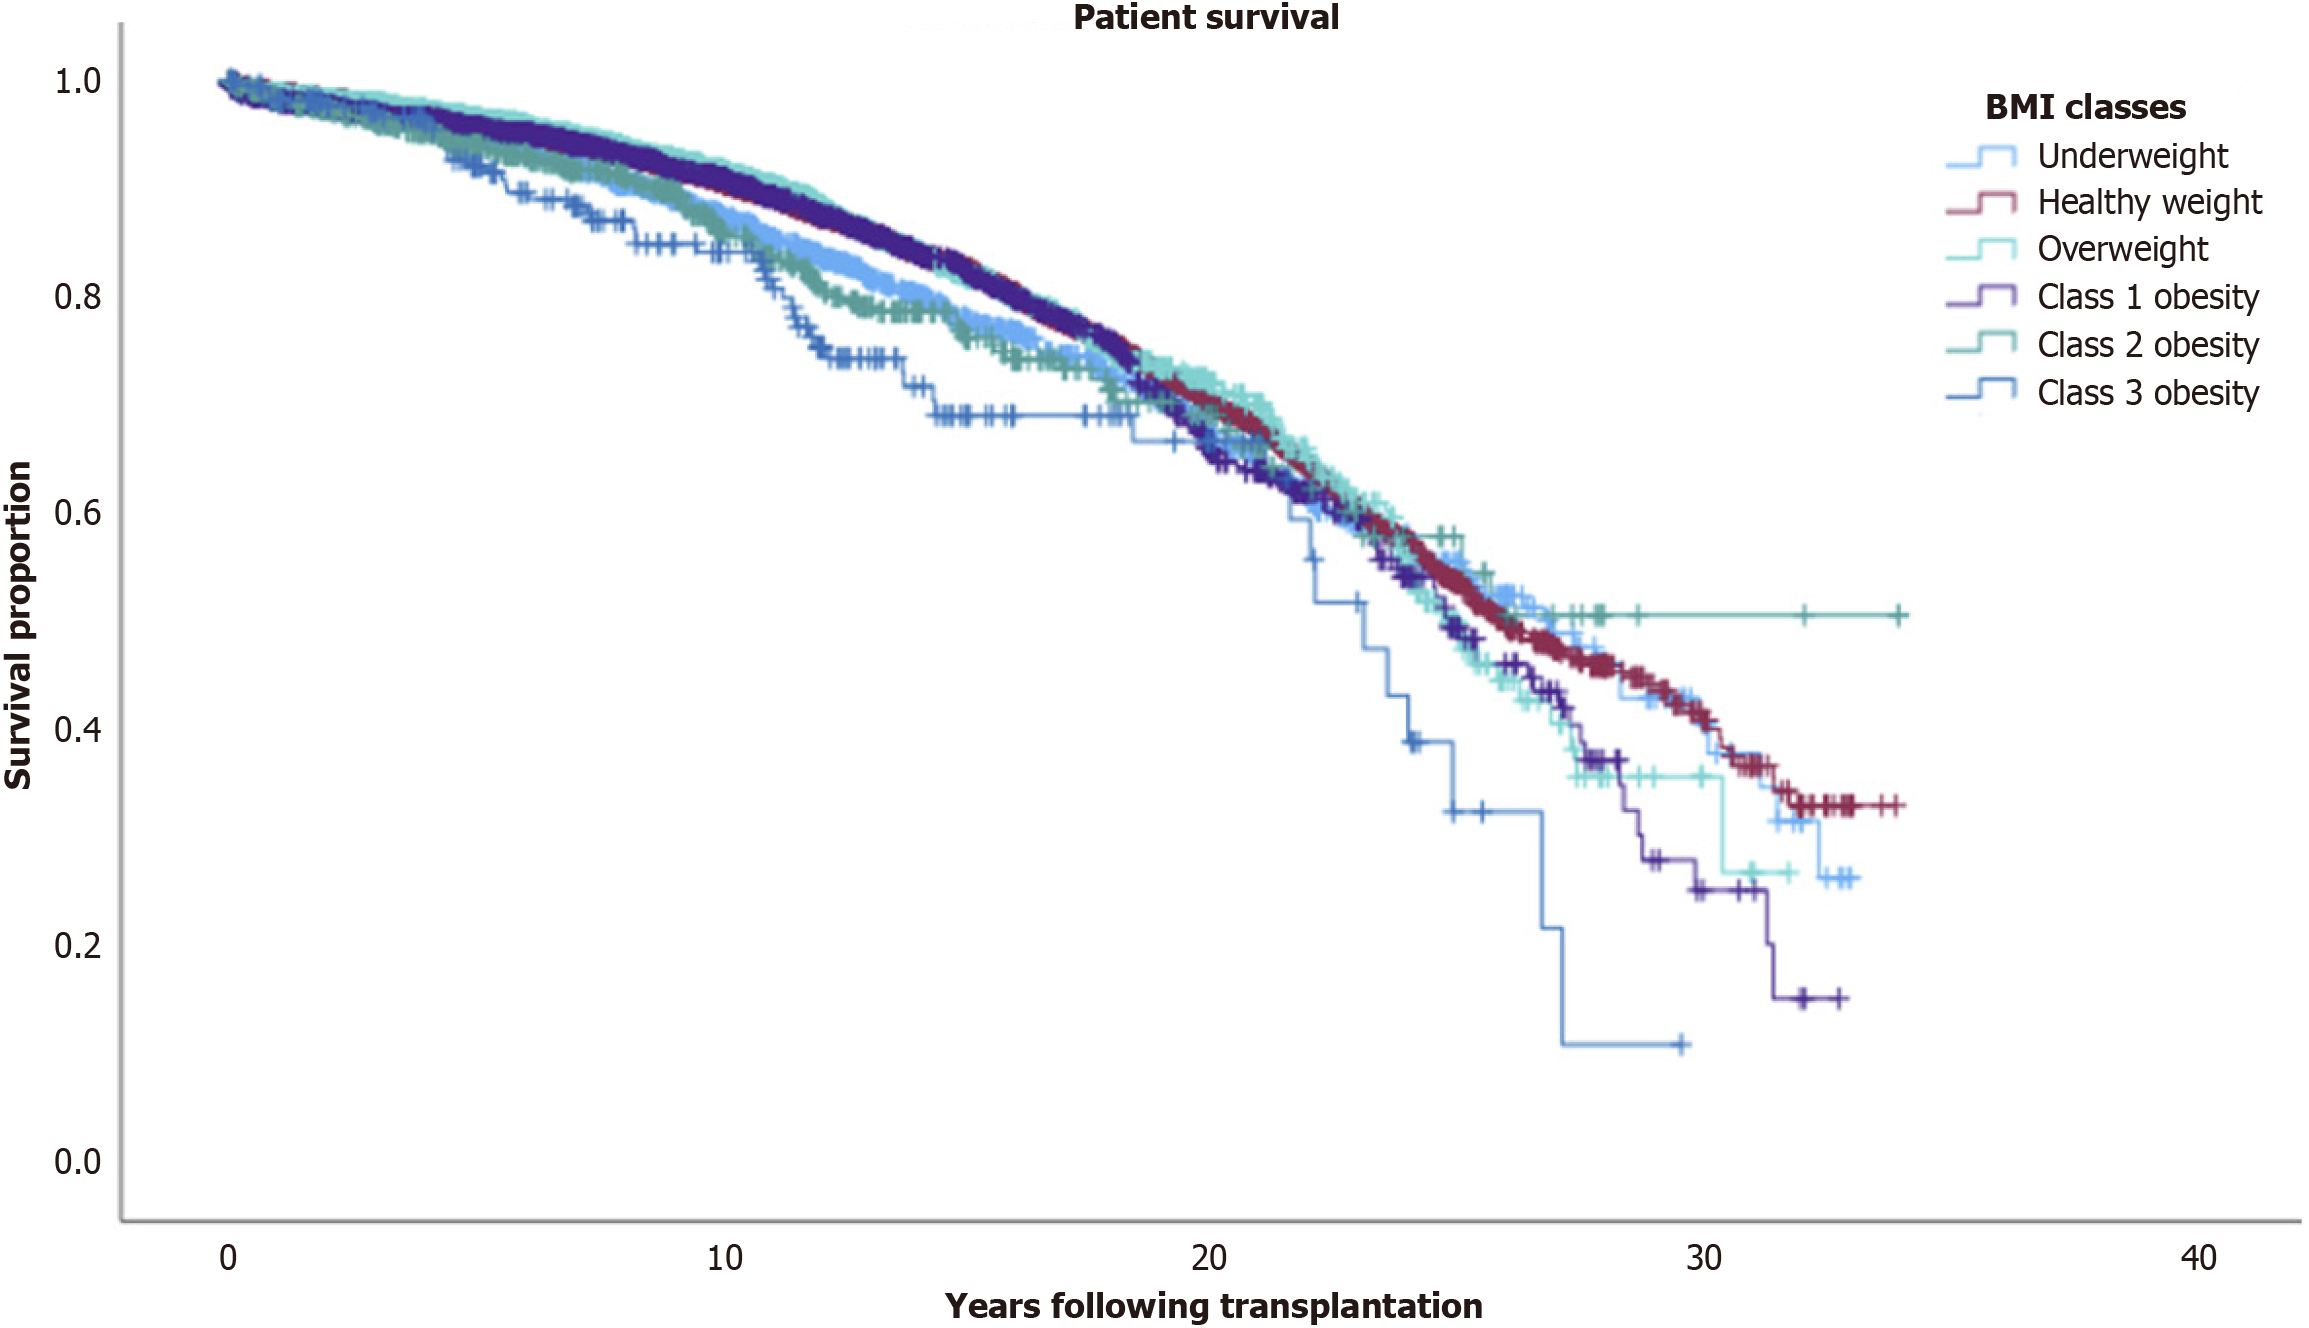
Figure 4 Kaplan–Meier estimates of kidney allograft recipient survival between the different body mass index classes.
Correlate statistically significant differences in patient survival between body mass index classes using the log-rank testing in Table 2.
- Citation: Stanicki B, Puntiel DA, Peticca B, Egan N, Prudencio TM, Robinson SG, Karhadkar SS. Investigating the controversial link between pediatric obesity and graft survival in kidney transplantation. World J Nephrol 2025; 14(2): 101961
- URL: https://www.wjgnet.com/2220-6124/full/v14/i2/101961.htm
- DOI: https://dx.doi.org/10.5527/wjn.v14.i2.101961


