Copyright
©The Author(s) 2016.
World J Virol. Nov 12, 2016; 5(4): 161-169
Published online Nov 12, 2016. doi: 10.5501/wjv.v5.i4.161
Published online Nov 12, 2016. doi: 10.5501/wjv.v5.i4.161
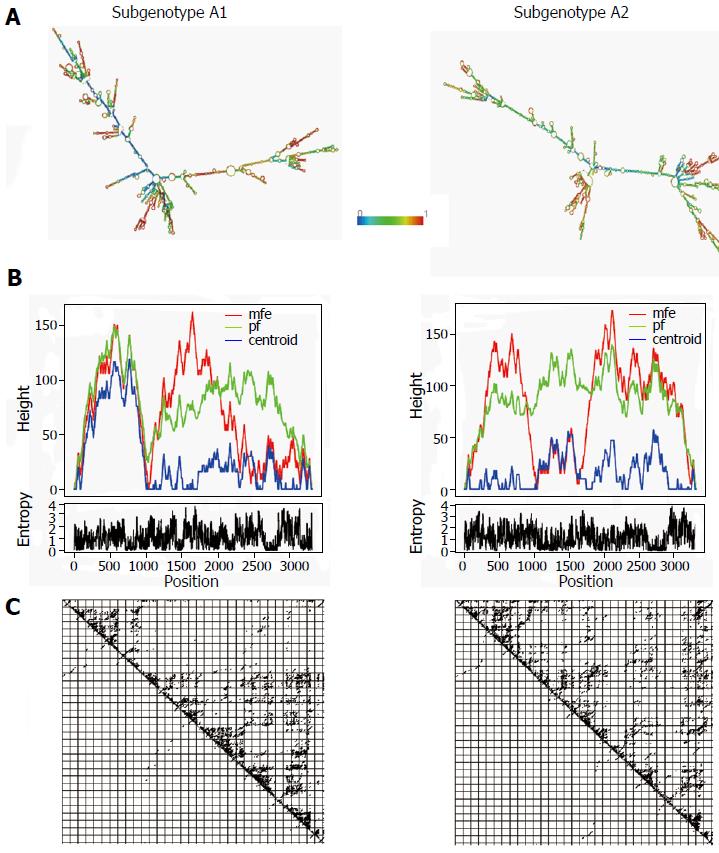
Figure 1 Comparative diagram showing the differences between different aspects of the predicted secondary structures of the pgRNA, specific for HBV subgenotype A1 and subgenotype A2.
A: Predicted minimum free energy (mfe) structures, coloured by base-pairing probabilities (according to the rainbow scale shown in the middle, denoting base pair probabilities from 0 to 1). Colour of the unpaired regions denotes the probability of being unpaired; B: Mountain plot representing the mfe structure (red line), the thermodynamic ensemble of RNA structures (green line), and the centroid structure (blue line). Positional entropy for each position is presented below the mountain plot; C: Dot-plot showing the base-pairing probabilities of the two predictions.
- Citation: Datta S, Chakravarty R. Role of RNA secondary structure in emergence of compartment specific hepatitis B virus immune escape variants. World J Virol 2016; 5(4): 161-169
- URL: https://www.wjgnet.com/2220-3249/full/v5/i4/161.htm
- DOI: https://dx.doi.org/10.5501/wjv.v5.i4.161


