Copyright
©The Author(s) 2017.
World J Transplant. Apr 24, 2017; 7(2): 144-151
Published online Apr 24, 2017. doi: 10.5500/wjt.v7.i2.144
Published online Apr 24, 2017. doi: 10.5500/wjt.v7.i2.144
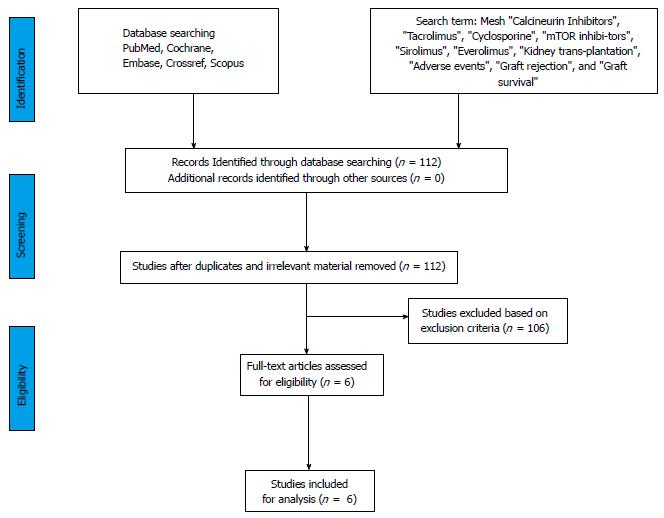
Figure 1 Search strategy and study selection used in this systematic review as per PRISMA protocol.
Figure 2 Forest plot represents the glomerular filtration rate at 12 mo in kidney trans-plant recipients when treated with mammalian target of rapamycin inhibitor or calcineurin inhibitor therapy.
Squares represent size effects of studies, comparing the weight of the study in the meta-analysis. The diamond summary effect shows signifi-cant favour towards mTOR inhibitors. 95%CIs represented in horizontal bars. mTOR: Mammalian target of rapamycin.
Figure 3 Forest plot represents the serum creatinine at 12 mo in kidney transplant re-cipients when treated with mammalian target of rapamycin inhibitor or calcineurin inhibitor therapy.
Squares represent size effects of studies, comparing the weight of the study in the meta-analysis. The diamond shows summary effect towards mTOR inhibitorss with 95%CIs represented in horizontal bars. mTOR: Mammalian target of rapamycin.
Figure 4 Forest plot represents the biopsy proven acute rejection at 12 mo in kidney transplant recipients when treated with mammalian target of rapamycin inhibitor or calcineurin inhibitor therapy.
Squares represent size effects of studies, comparing the weight of the study in the meta-analysis. The meta-analysis significantly favours CNI, with 95%CIs represented in horizontal bars. CNI: Calcineurin inhibitor.
- Citation: Kumar J, Reccia I, Kusano T, Julie BM, Sharma A, Halawa A. Systemic meta-analysis assessing the short term applicability of early conversion to mammalian target of rapamycin inhibitors in kidney transplant. World J Transplant 2017; 7(2): 144-151
- URL: https://www.wjgnet.com/2220-3230/full/v7/i2/144.htm
- DOI: https://dx.doi.org/10.5500/wjt.v7.i2.144


