Copyright
©The Author(s) 2016.
World J Transplant. Dec 24, 2016; 6(4): 689-696
Published online Dec 24, 2016. doi: 10.5500/wjt.v6.i4.689
Published online Dec 24, 2016. doi: 10.5500/wjt.v6.i4.689
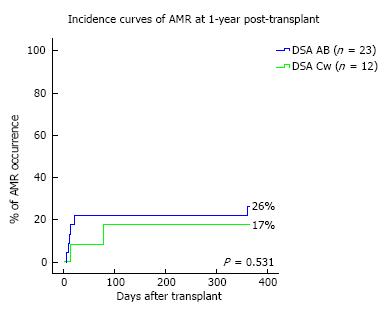
Figure 1 Incidence curves of antibody-mediated rejection at 1-year post-transplant.
AMR: Antibody-mediated rejection; DSA: Donor-specific antibodies.
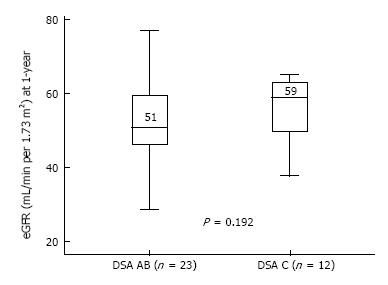
Figure 2 Graft function (estimated glomerular filtration rate at 1-year) post-transplantation according to donor-specific antibodies human leukocyte antigen loci.
Boxes show the interquartile range of the values (median and percentile 25-75); whiskers show the lowest and the highest value within 1.5 times below or above the interquartile range, respectively. DSA: Donor-specific antibodies; eGFR: Estimated glomerular filtration rate.
Figure 3 Kidney graft survival curves according with donor-specific antibodies human leukocyte antigen loci.
DSA: Donor-specific antibodies.
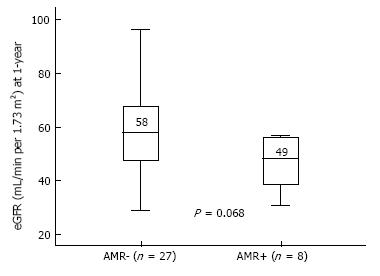
Figure 4 Graft function (estimated glomerular filtration rate at 1-year) post-transplantation according to antibody-mediated rejection occurrence.
Boxes show the interquartile range of the values (median and percentile 25-75); whiskers show the lowest and the highest value within 1.5 times below or above the interquartile range, respectively. AMR: Antibody-mediated rejection; eGFR: Estimated glomerular filtration rate.
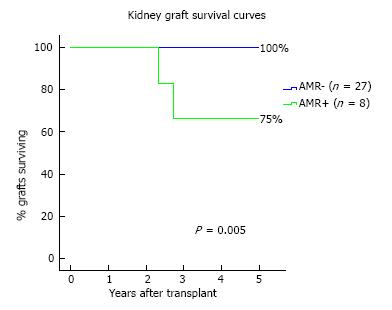
Figure 5 Kidney graft survival curves according with antibody-mediated rejection occurrence.
AMR: Antibody-mediated rejection.
- Citation: Santos S, Malheiro J, Tafulo S, Dias L, Carmo R, Sampaio S, Costa M, Campos A, Pedroso S, Almeida M, Martins LS, Henriques C, Cabrita A. Impact of preformed donor-specific antibodies against HLA class I on kidney graft outcomes: Comparative analysis of exclusively anti-Cw vs anti-A and/or -B antibodies. World J Transplant 2016; 6(4): 689-696
- URL: https://www.wjgnet.com/2220-3230/full/v6/i4/689.htm
- DOI: https://dx.doi.org/10.5500/wjt.v6.i4.689


