Copyright
©The Author(s) 2016.
World J Transplant. Mar 24, 2016; 6(1): 69-90
Published online Mar 24, 2016. doi: 10.5500/wjt.v6.i1.69
Published online Mar 24, 2016. doi: 10.5500/wjt.v6.i1.69
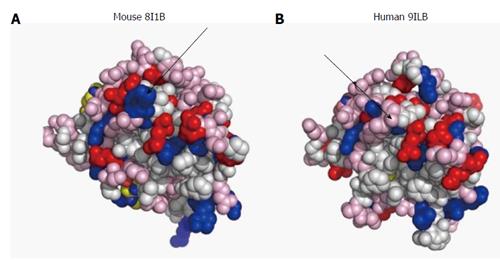
Figure 1 Surface design of mouse (A) and human (B) interleukin-1β.
The proteins are imaged at identical angles. Blue: Positively-charged amino acids; red: Negatively-charged amino acids; pink: Polar amino acids (slightly negative at physiological pH). The arrows point to differences in surface charges between the 2 proteins. Image resolved using ASAview[214].
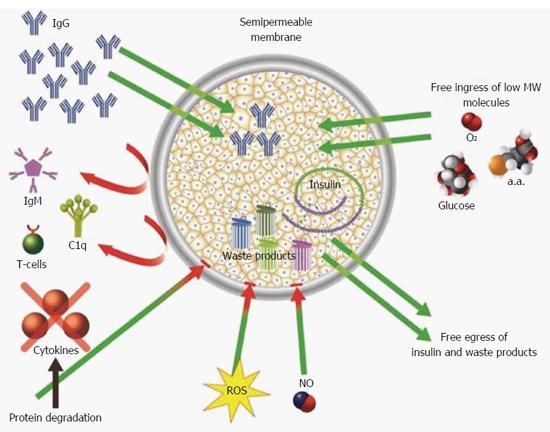
Figure 2 Mechanisms (demonstrated and putative) by which permselective membrane protect grafted cells from the host immune system.
The permselective membrane allows free ingress of low molecular weight nutrients (e.g., glucose and amino acids) and egress of insulin and waste products. The membrane separates the grafted cells from the cellular arm of the immune system and prevents humoral rejection by preventing ingress of IgM and C1q (due to their high molecular weight). In addition, the membrane attenuates free diffusion of hazardous cytokines thereby exposing them to proteases, and increases the diffusion distance between reactive oxygen species, nitric oxide, and the grafted cells promoting their thermodynamic degradation.
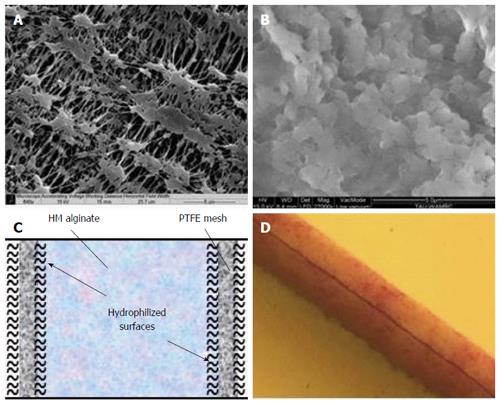
Figure 3 The β-Air immune barrier, a double hydrophilized polytetrafluoroethylene membrane impregnated with 6% high mannuronic alginate.
A: Environmental scanning electron microscope (ESEM) surface image of a virgin membrane; B: ESEM surface image of impregnated membrane; C: Drawing of hypothetical cross section in one polytetrafluoroethylene (PTFE) membrane; D: Cross section of double PTFE membrane impregnated with colored alginate (total width = 60 μm).
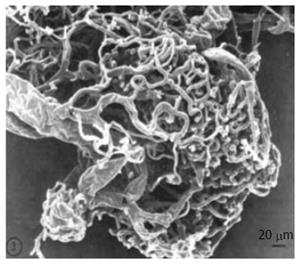
Figure 4 Vasculature of a large islet (300-μm diameter) as seen in scanning electron microscope.
Republished with permission of the American Diabetes Association, from Ref. [119] permission conveyed through Copyright Clearance Center, Inc.
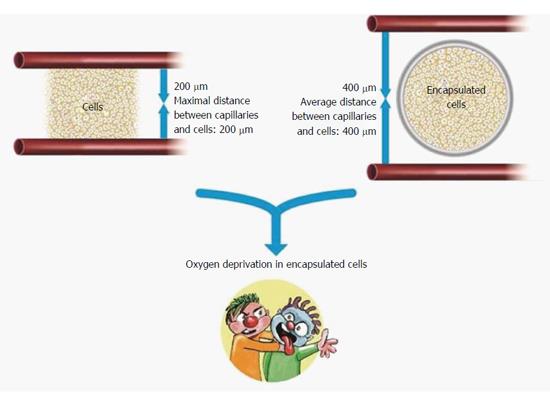
Figure 5 Cartoon representation limitations of oxygen supply to encapsulated islets of Langerhans.
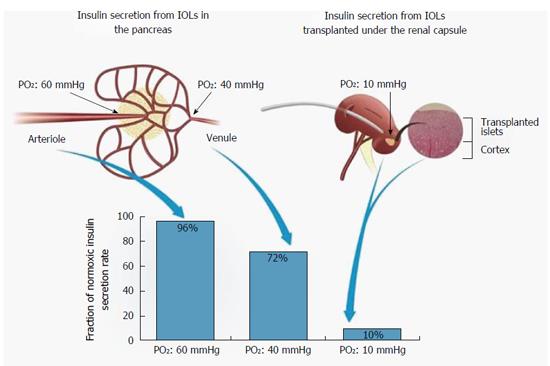
Figure 6 Efficiency of insulin secretion as a function of PO2.
PO2 levels in native IOL (left) and when IOLs are transplanted under subcapsular space in the kidney (right). HE stained section of rat kidney demonstrating integration of isogeneic transplanted IOLs into the kidney tissue (far right). The association between PO2 in each location and the efficiency of insulin secretion is shown (bottom). IOL: Islets of Langerhans.
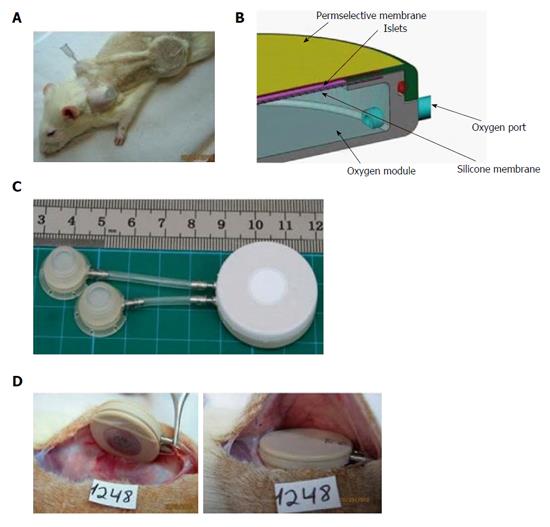
Figure 7 The rat variant of the β-Air device.
A: Shaved animal demonstrating relative positions of the device, connecting tubes, and access ports. A syringe needle used for gas refueling is inserted into one of these ports; B: Schematic illustration of the device. Size of the gas chamber and the islets module is shown; C: The macrochamber and connected access ports (each square is 1 cm × 1 cm); D: Implantation of the device under the skin of diabetic recipient (the inactive surface faces the skin and the active surface faces the fascia).
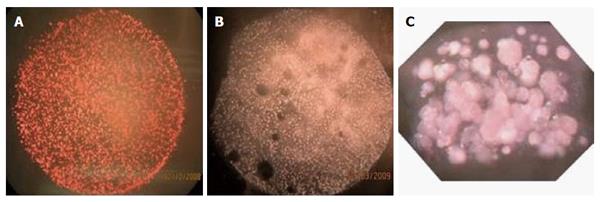
Figure 8 Islet modules of the β-Air device at surface density of 1000 IEQ/cm2.
A: Before implantation; B: At explantation (after 90 d); C: Cross section of an islet module before integration into the β-Air device.
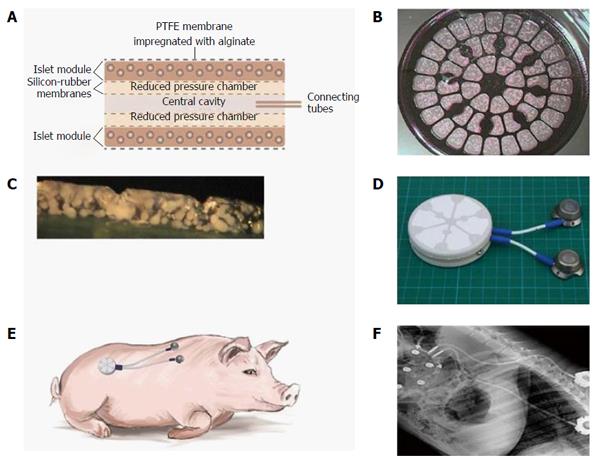
Figure 9 The design, makeup, and implantation site of the porcine-type β-Air device.
A: Schematic cross section of a porcine-type β-Air device. The four dashed lines separating the central cavity from the “reduced pressure chambers” and the “reduced pressure chambers” from the islet modules are silicone rubber membranes; B: A surface image of an islet module; C: Cross section of an islet module; D: The macrochamber and connected access ports (each square is 1 cm × 1 cm); E: Illustration of the device (including the subcutaneous access ports) implanted into a mini-swine recipient; F: X-ray image of an implanted device.
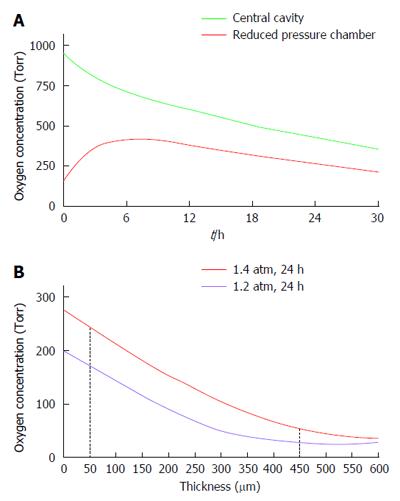
Figure 10 Predictions of the mathematical model for PO2 levels.
The parameters of the model were set as follow: Islet dose in each of the 2 islet modules, 60000 IEQ; surface density of 3600 IEQ/cm2, and OCR of 3.6 pmoles/IEQ/min. A: PO2 profile at the central cavity (green line) and at the “reduced pressure chamber” (red line) of a porcine-type β-Air device. The central cavity was refueled with 95% oxygen/5% CO2 at 1.4 atm (1011 Torr); B: PO2 across a section of an islet module of a β-Air device refueled with 95% oxygen at either 1.2 (purple line) or 1.4 (red line) atm. The red dashed lines represent distances of 50 and 450 μm from the chamber-islet module boundary.
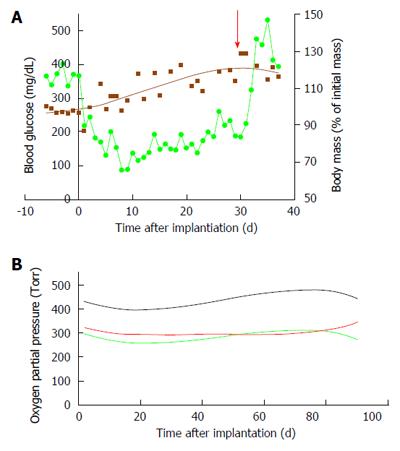
Figure 11 Implanting of the porcine-type β-Air device in diabetic Sinclair mini swine (n = 4).
A: Blood glucose (green line) and body mass (brown line) of diabetic mini-swine implanted with β-Air devices are shown over time. The red arrow represents the day of explantation; B: PO2 in the central chamber (black line) and in the 2 “reduced pressure chambers” (green, body side; red, skin side).
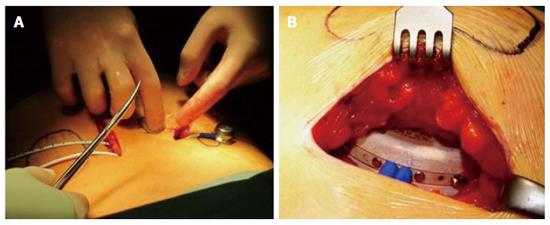
Figure 12 Implantation of the β-Air device into a patient.
A: Relative positions of the device and the access ports; B: Insertion of the device into the subcutis.
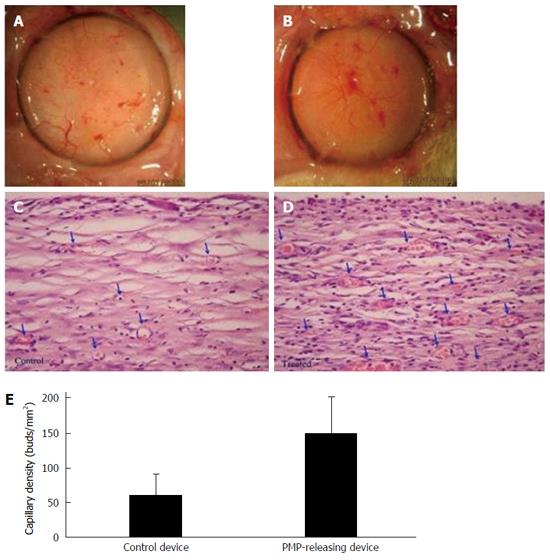
Figure 13 Platelet micro-particles-induced angiogenesis in capsules formed around β-Air devices (n = 4).
A, B: Surface views of capsule formed around a control device (A) and PMP-releasing device (B); C, D: Histological sections of a capsule formed in close proximity with a control (C) and a PMP releasing device (D). Arrows indicate blood capillaries in the capsule. Original magnification, × 40; E: Quantitative analysis of primary mature capillaries (SMA-stained) in the capsule. PMP: Platelet micro-particles; SMS: Smooth muscle actin.
- Citation: Barkai U, Rotem A, de Vos P. Survival of encapsulated islets: More than a membrane story. World J Transplant 2016; 6(1): 69-90
- URL: https://www.wjgnet.com/2220-3230/full/v6/i1/69.htm
- DOI: https://dx.doi.org/10.5500/wjt.v6.i1.69


