Copyright
©The Author(s) 2015.
World J Transplant. Sep 24, 2015; 5(3): 110-128
Published online Sep 24, 2015. doi: 10.5500/wjt.v5.i3.110
Published online Sep 24, 2015. doi: 10.5500/wjt.v5.i3.110
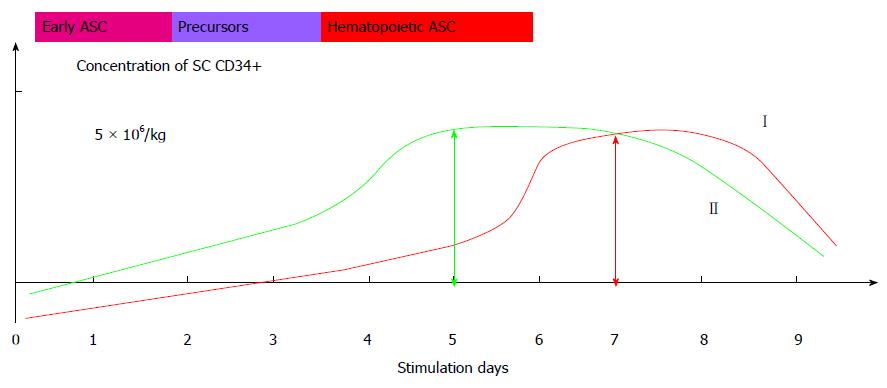
Figure 1 Obtaining cell preparations in various modes of granulocyte colony-stimulating factor stimulation.
Figure 2 General effectiveness of restoration of the spinal functions after hematopoietic stem cells and hematopoietic precursors transplantation.
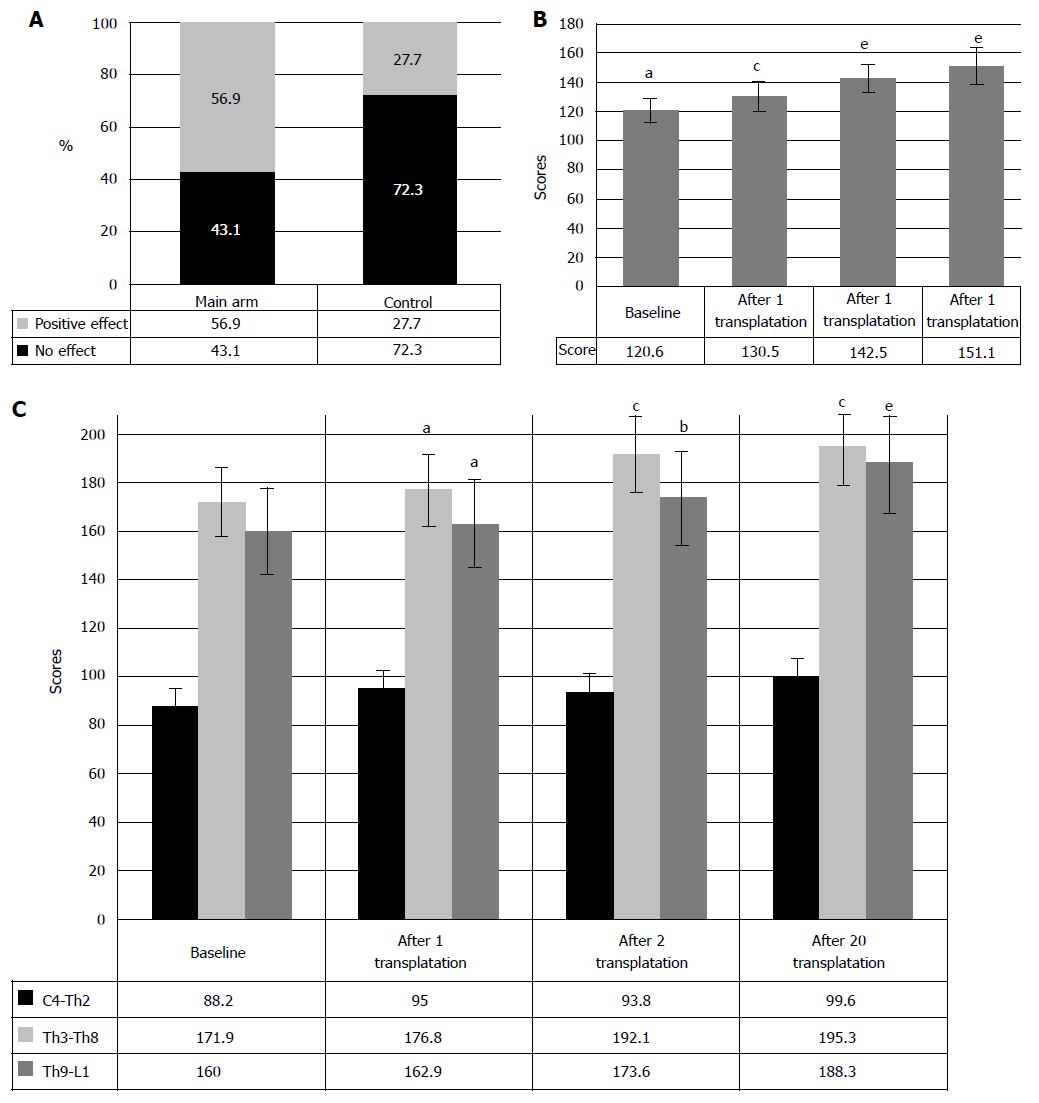
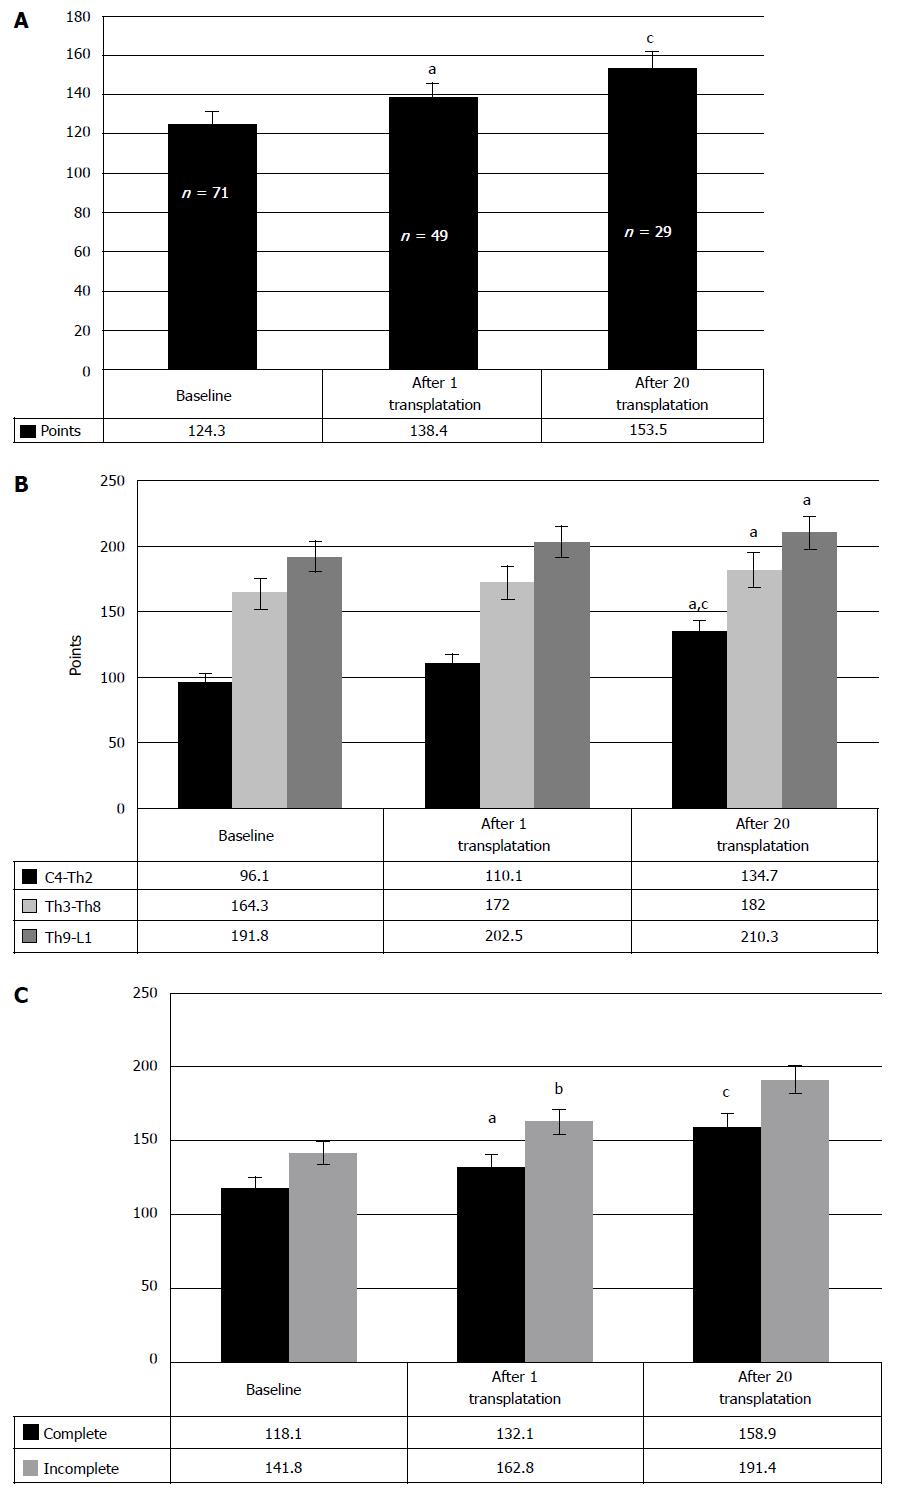
Figure 3 General effectiveness (A), clinical progress (B) and clinical picture (C).
A: General effectiveness of motor functions’ restoration after HSCs and HPs transplantation; B: Clinical progress in motor functions after HSCs and HPs transplantation; C: Clinical picture of motor functions after HSCs and HPs transplantation in SCI patients with different levels of injury. aP < 0.05 as vs the baseline; cP < 0.05 as vs the score after 1 HSCs and HPs transplantation; eP < 0.05 as vs the score after 2 HSCs and HPs transplantations; bP < 0.1 as vs the baseline. HSCs: Hematopoietic stem cells; HPs: Hematopoietic precursors; SCI: Spinal cord injury.
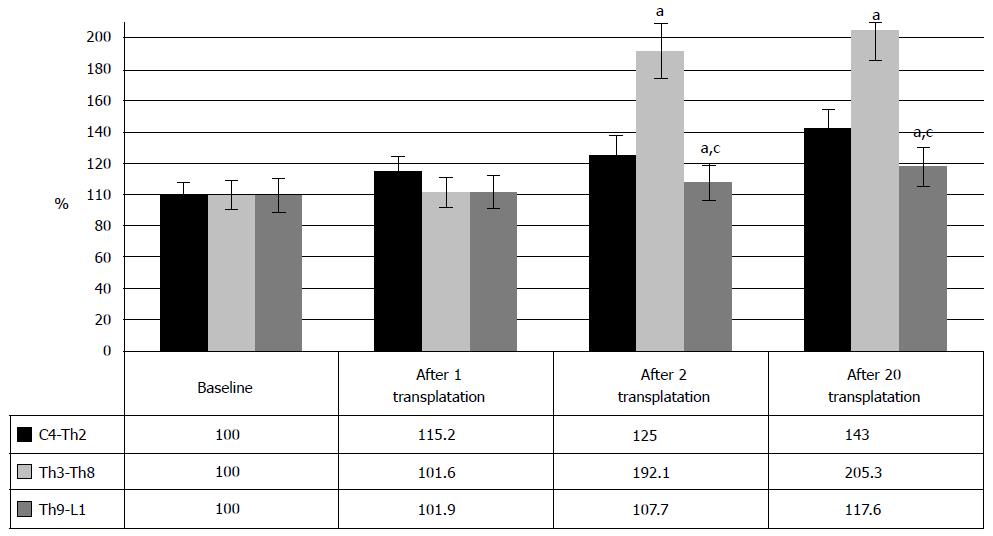
Figure 4 Comparison of clinical motor restoration after hematopoietic stem cells and hematopoietic precursors transplantation among spinal cord injury patient with different injury levels.
aP < 0.05 as vs the level С4-Th2; cP < 0.05 as vs the level Th3-Th8.
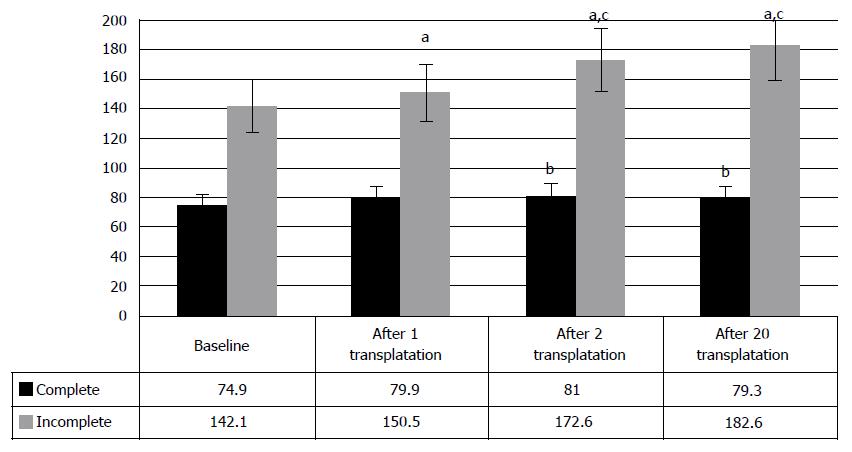
Figure 5 Motor function restoration after hematopoietic stem cells and hematopoietic precursors transplantation in complete spinal cord injury patients and incomplete.
aP < 0.05 as vs the baseline; cP < 0.05 as vs the score after the first transplantation; bP < 0.1 as vs the baseline.
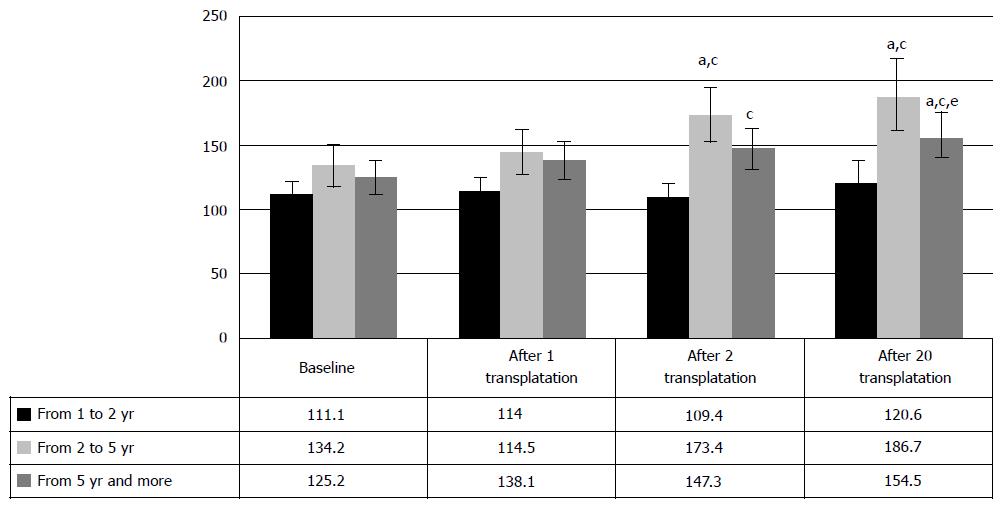
Figure 6 Clinical progress of motor restoration after hematopoietic stem cells and hematopoietic precursors transplantation depending on years post injury.
aP < 0.05 as vs the baseline; cP < 0.05 as vs the score after the first transplantation; eP < 0.05 as vs the group of patients with 2-5 years post injury.
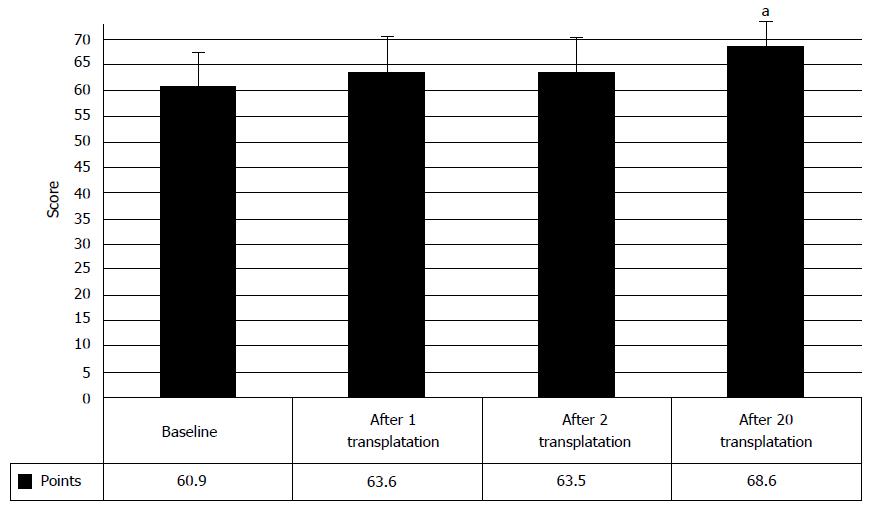
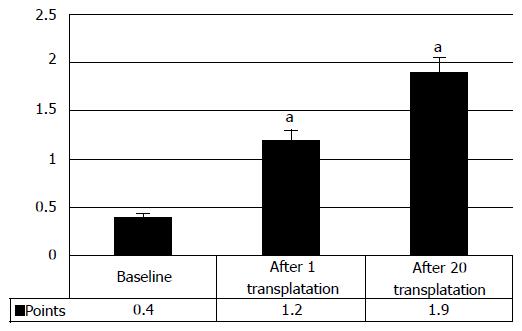
Figure 7 Muscle strength restoration evaluated by Medical Research Council Scale after hematopoietic stem cells and hematopoietic precursors transplantation.
aP < 0.05 as vs the baseline.
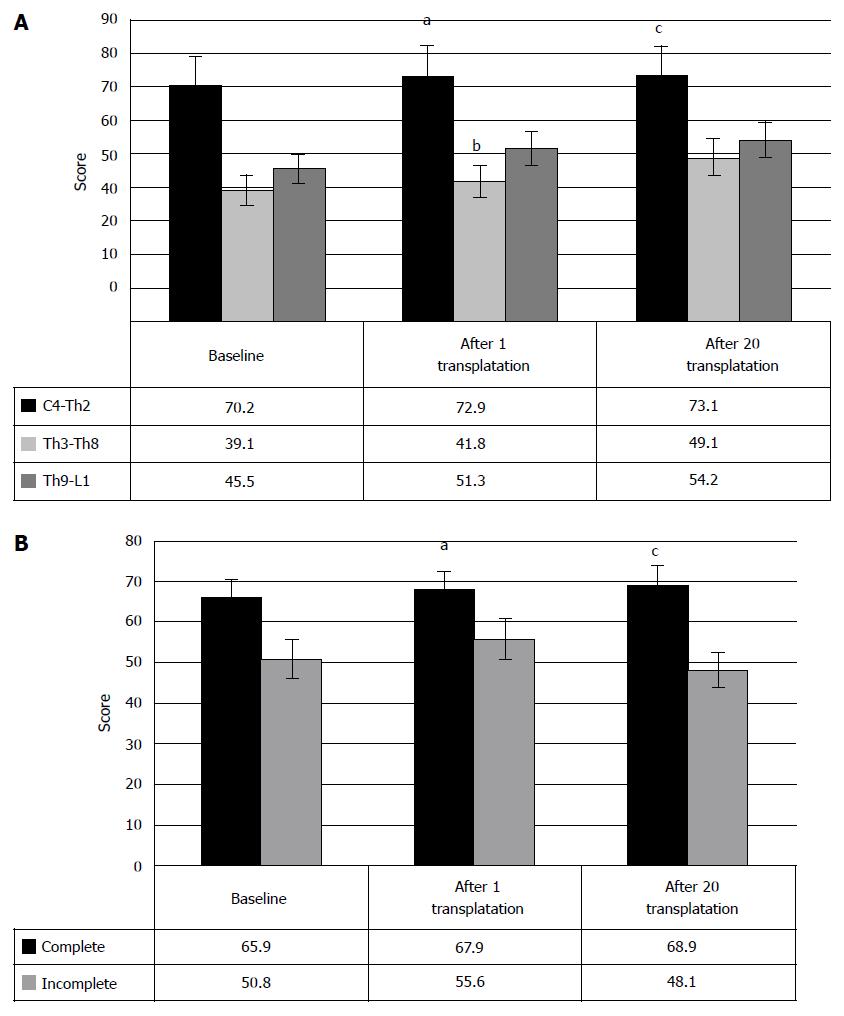
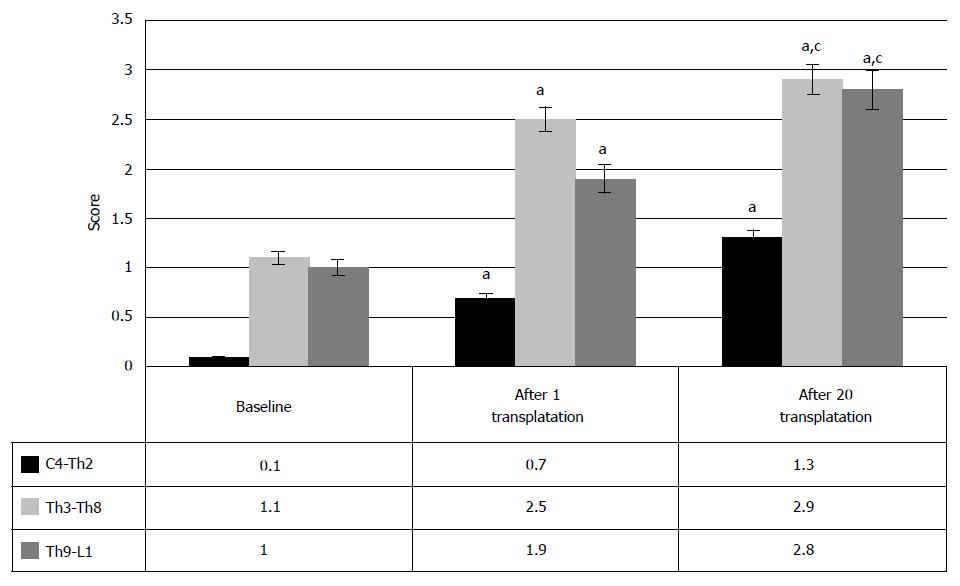
Figure 8 Clinical picture of muscle strength restoration evaluated by the Medical Research Council Scale after Hematopoietic stem cells and Hematopoietic precursors transplantation in the patients with different levels of spinal cord injury (A) and complete and incomplete spinal cord injury (B).
aP < 0.05 as vs the baseline; cP < 0.05 as vs the score after 1 HSCs and HPs transplantation; bP < 0.1 as vs the baseline. HSCs: Hematopoietic stem cells; HPs: Hematopoietic precursors.
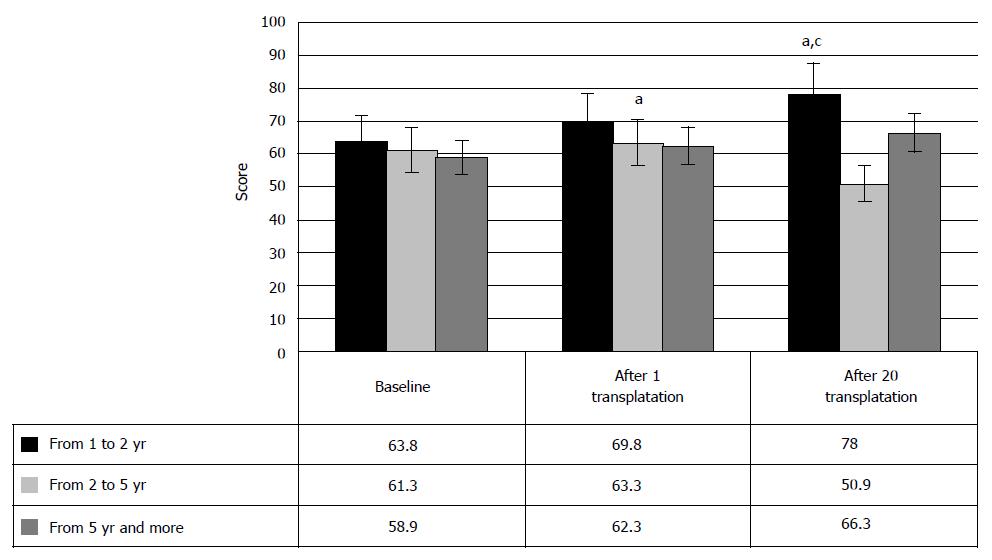
Figure 9 Clinical picture of muscle force restoration evaluated by Medical Research Council Scale after hematopoietic stem cells and hematopoietic precursors transplantation depending on years post injury.
aP < 0.05 as vs the baseline; cP < 0.05 as vs the score after 1 HSCs and HPs transplantation. HSCs: Hematopoietic stem cells; HPs: Hematopoietic precursors.
Figure 10 General efficiency of sensation restoration after hematopoietic stem cells and hematopoietic precursors transplantation.
Figure 11 Clinical changes in sensation after hematopoietic stem cells and hematopoietic precursors transplantation (A) in the spinal cord injury patients with different levels of injury (B) and in the patients with complete and incomplete spinal cord injury (C).
aP < 0.05 as vs the baseline; cP < 0.05 as vs the score after 1 transplantation; bP < 0.1 as vs the baseline.
Figure 12 Clinical progress of urinary restoration after hematopoietic stem cells and hematopoietic precursors transplantation.
aP < 0.05 as vs the baseline.
Figure 13 Clinical changes of urinary function after hematopoietic stem cells and hematopoietic precursors transplantation at different levels of spinal cord injury.
aP < 0.05 as vs compared to the baseline; cP < 0.05 as vs the score after the first transplantation.
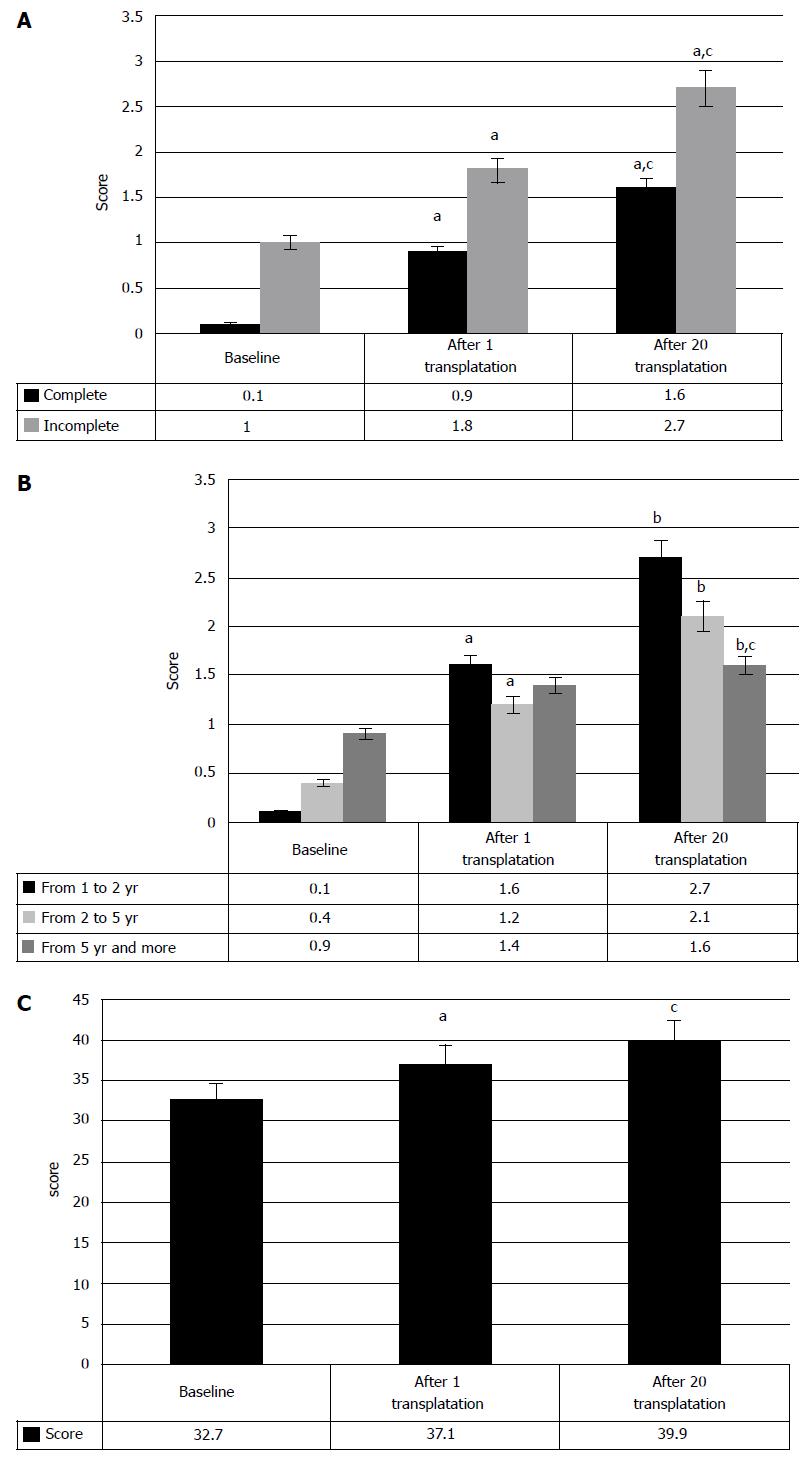
Figure 14 Urinary restoration after hematopoietic stem cells and hematopoietic precursors transplantation in complete/incomplete spinal cord injury patients (A) and depending on years post spinal cord injury (B); motor restoration after hematopoietic stem cells and hematopoietic precursors transplantation evaluated by ISCISCI-92 (C).
aP < 0.05 as vs the baseline; cP < 0.05 as vs the score after 1 transplantation; bP < 0.1 as vs the baseline.
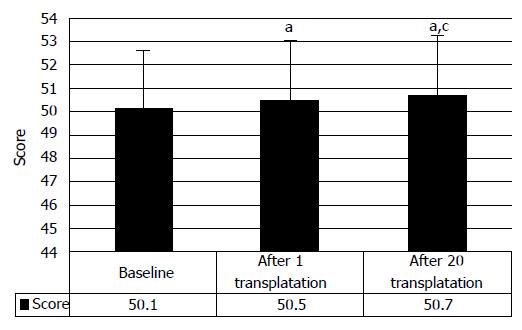
Figure 15 Changes of vital activity in the patients after hematopoietic stem cells and hematopoietic precursors transplantation measured by FIM.
aP < 0.05 as vs the baseline; cP < 0.05 as vs the score after 1 HSCs and HPs transplantation. HSCs: Hematopoietic stem cells; HPs: Hematopoietic precursors.
- Citation: Bryukhovetskiy AS, Bryukhovetskiy IS. Effectiveness of repeated transplantations of hematopoietic stem cells in spinal cord injury. World J Transplant 2015; 5(3): 110-128
- URL: https://www.wjgnet.com/2220-3230/full/v5/i3/110.htm
- DOI: https://dx.doi.org/10.5500/wjt.v5.i3.110


