Copyright
©The Author(s) 2023.
World J Transplant. Dec 18, 2023; 13(6): 344-356
Published online Dec 18, 2023. doi: 10.5500/wjt.v13.i6.344
Published online Dec 18, 2023. doi: 10.5500/wjt.v13.i6.344
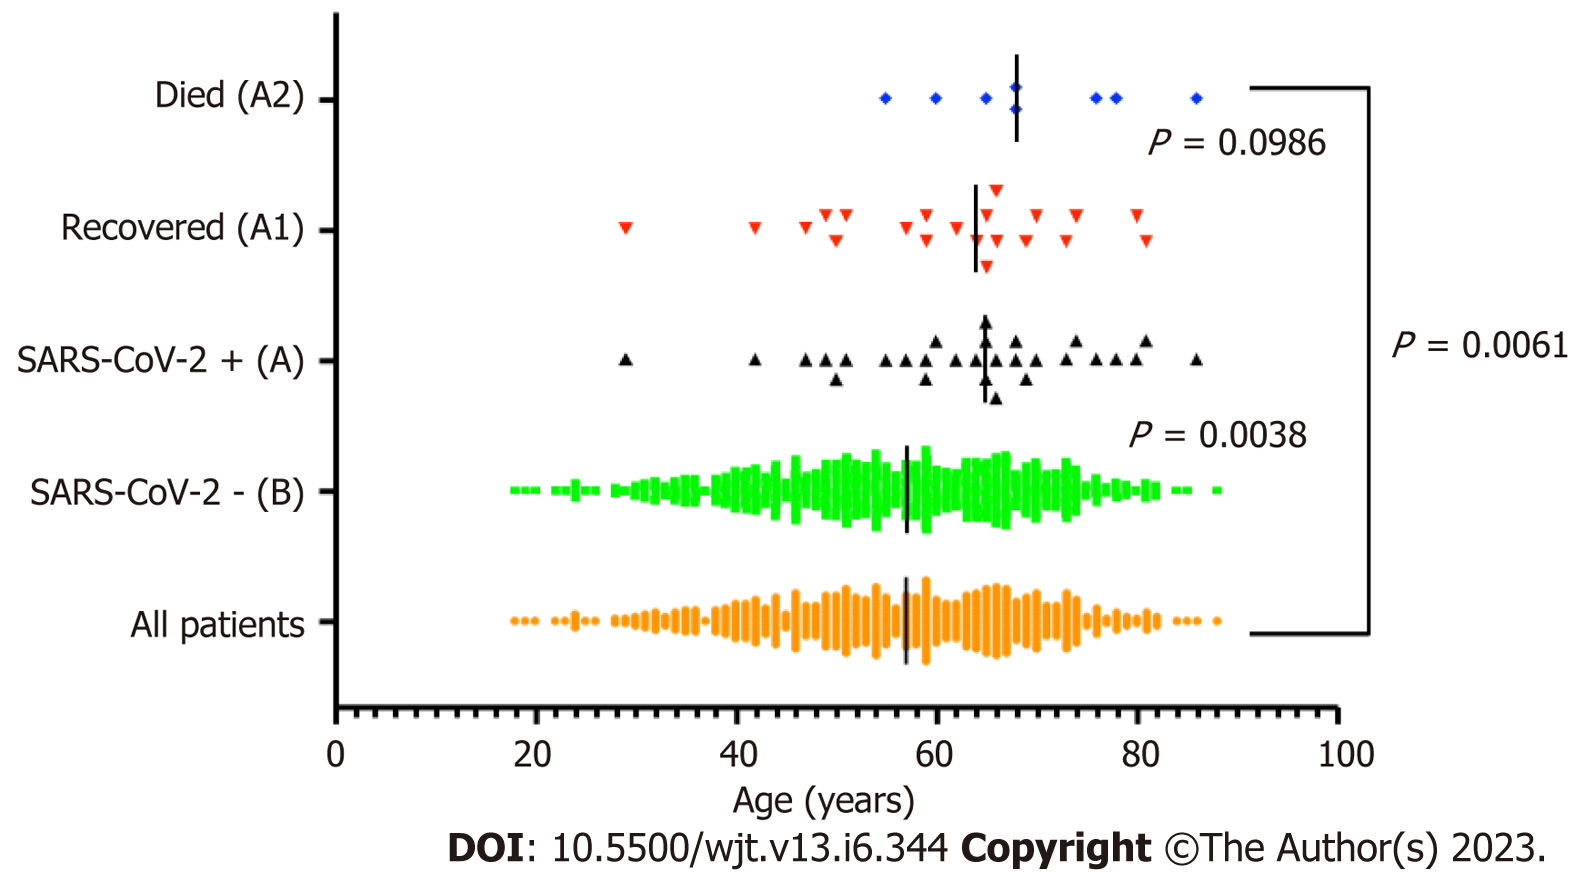
Figure 1 Median age across various cohorts.
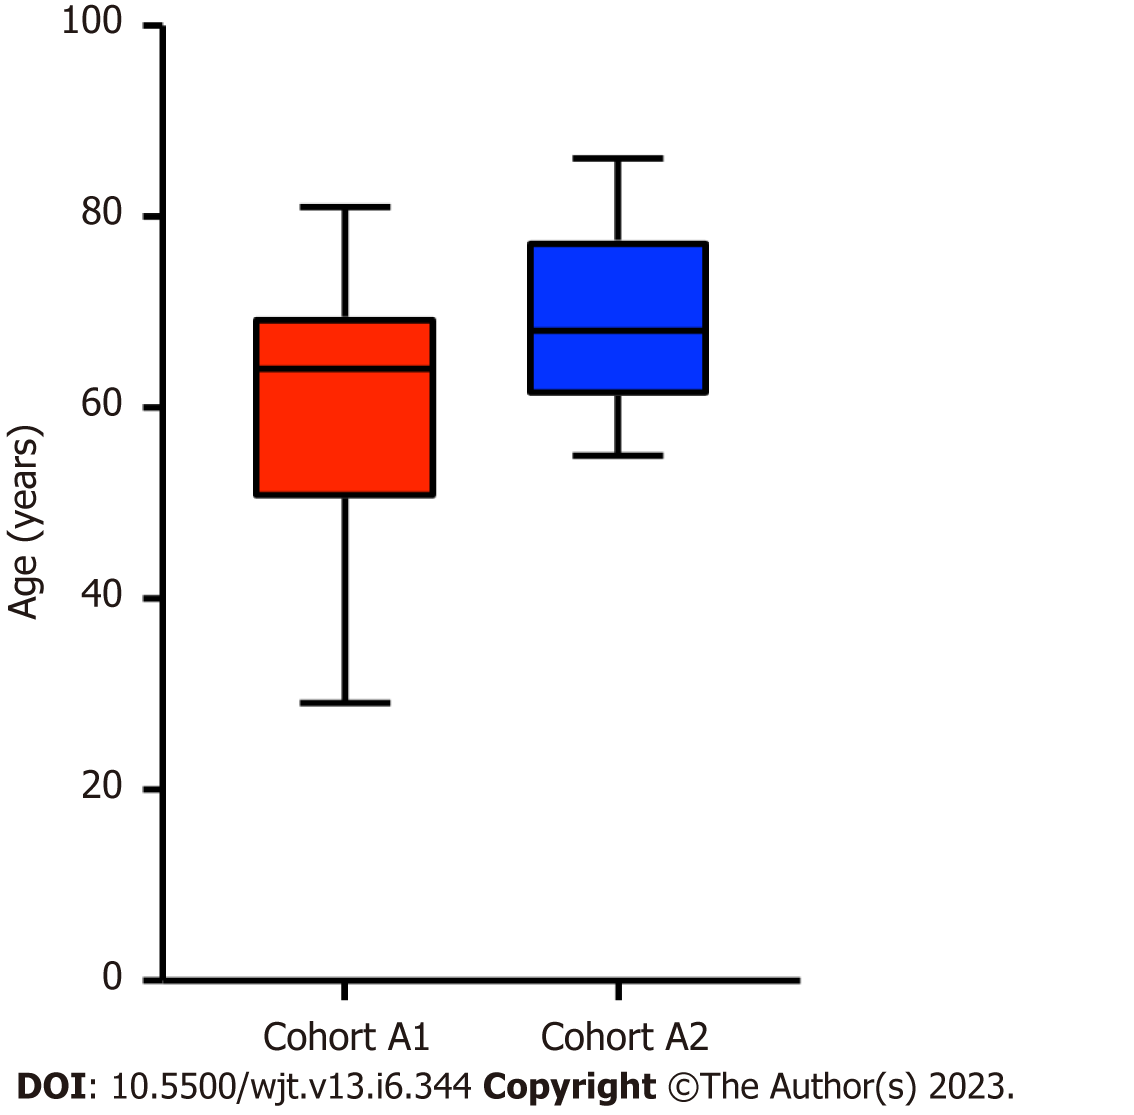
Figure 2 Intra-group age analysis A1 vs A2.
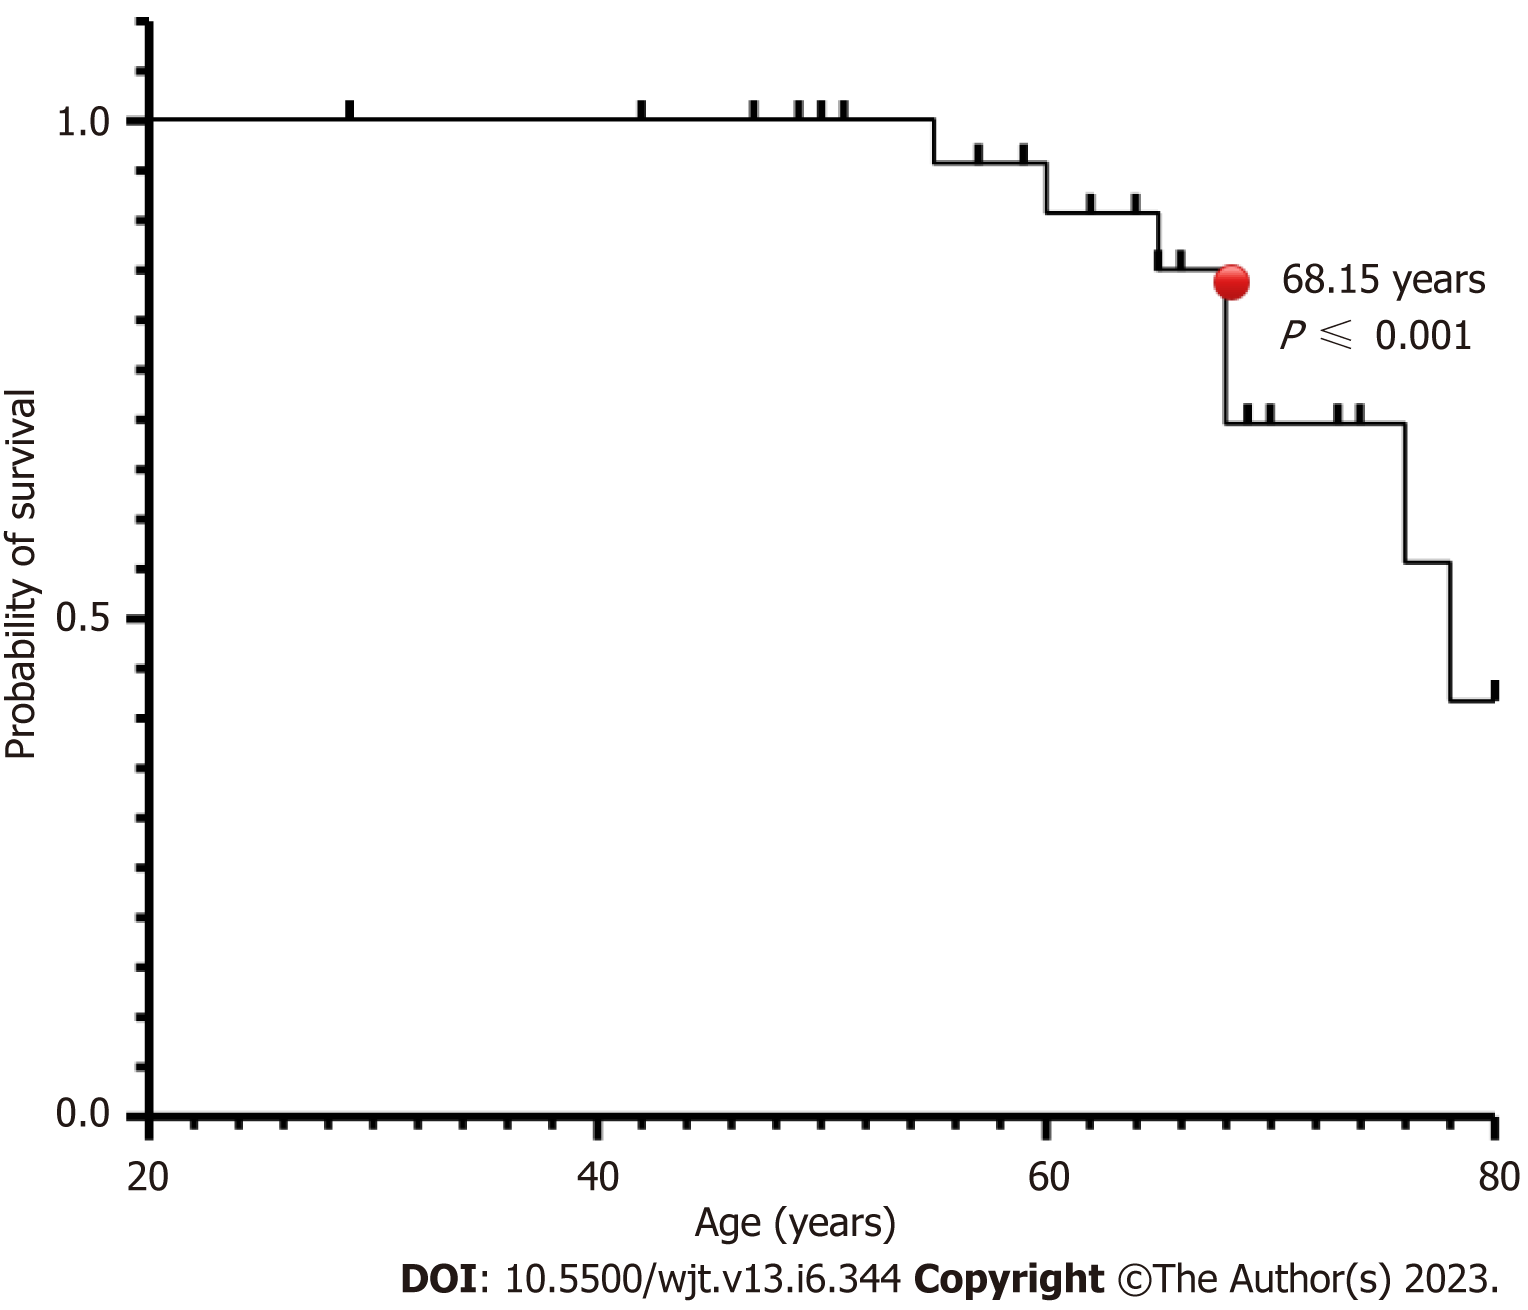
Figure 3 Age-related survival probability.
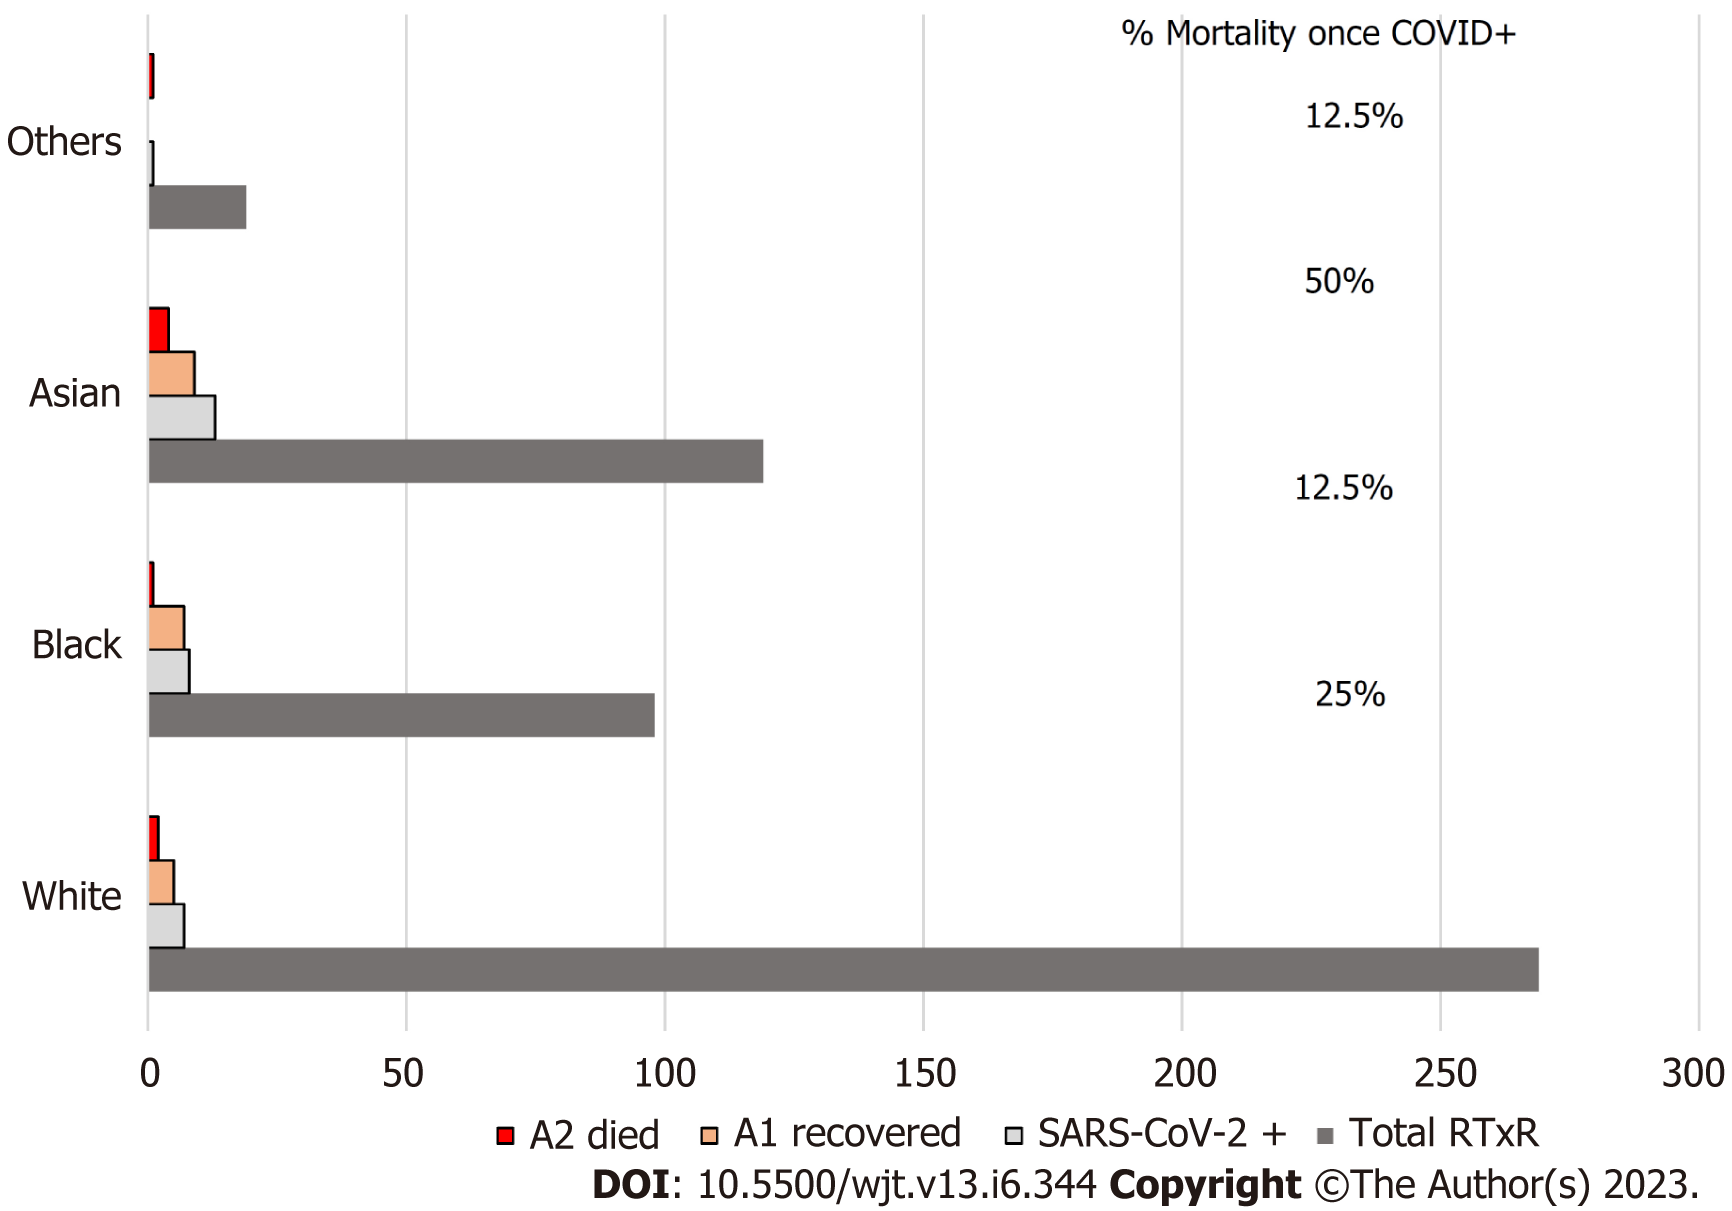
Figure 4 Ethnicity across various cohorts.
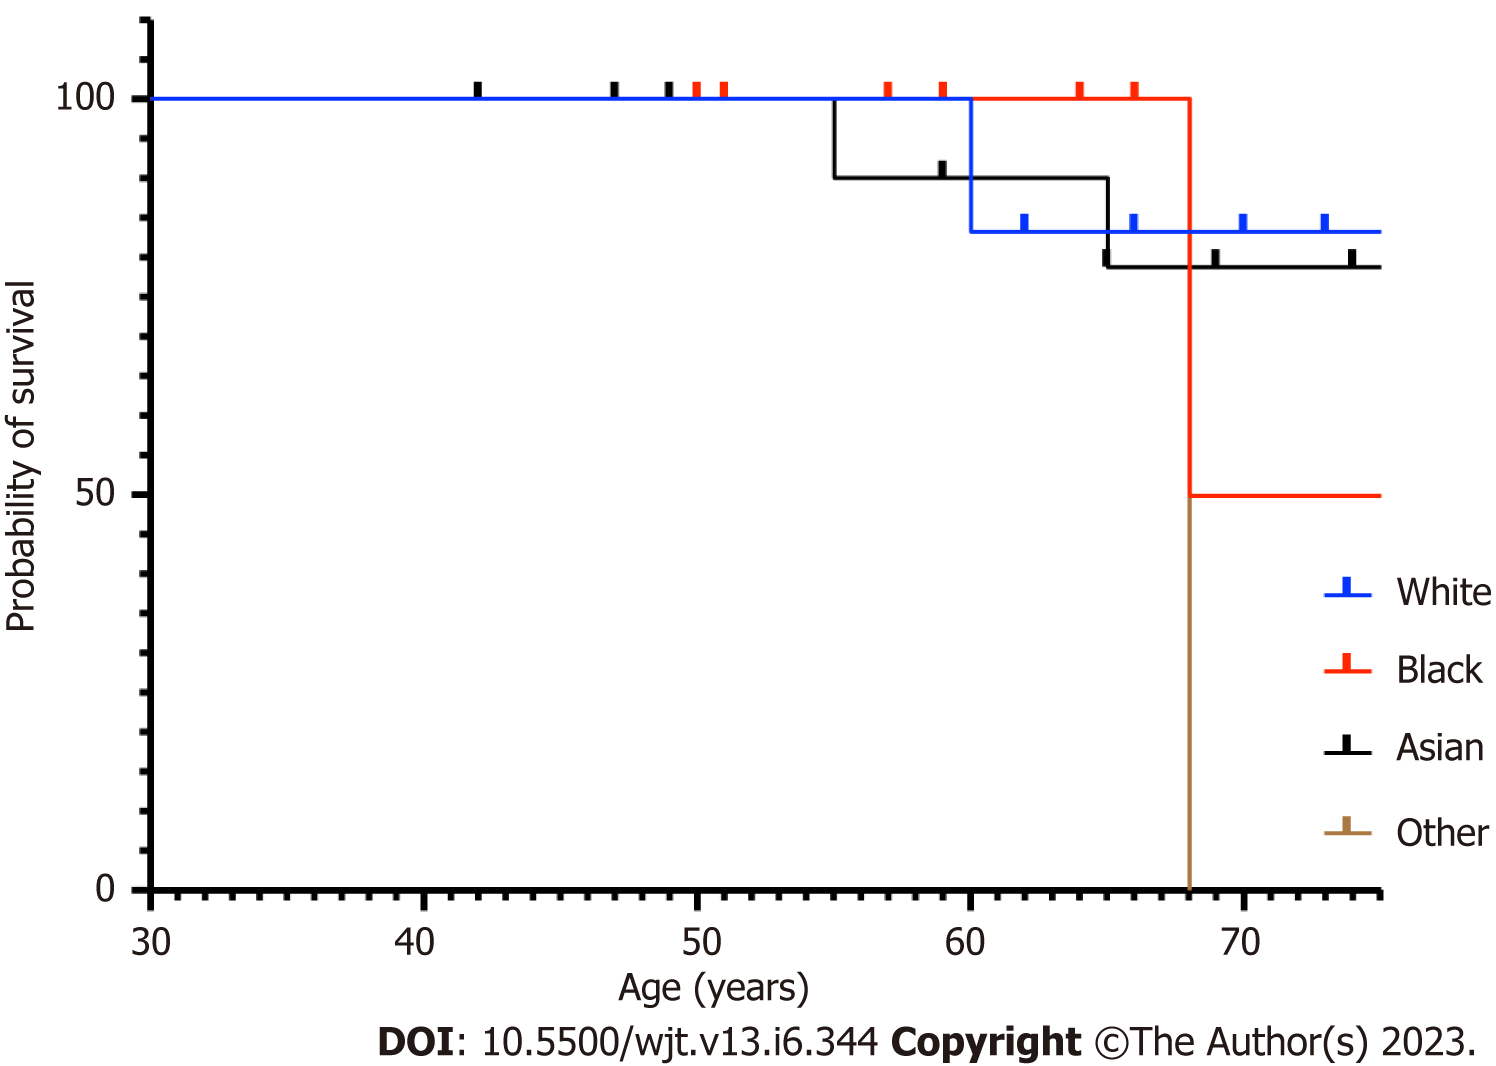
Figure 5 Survival probability with age and ethnicity.
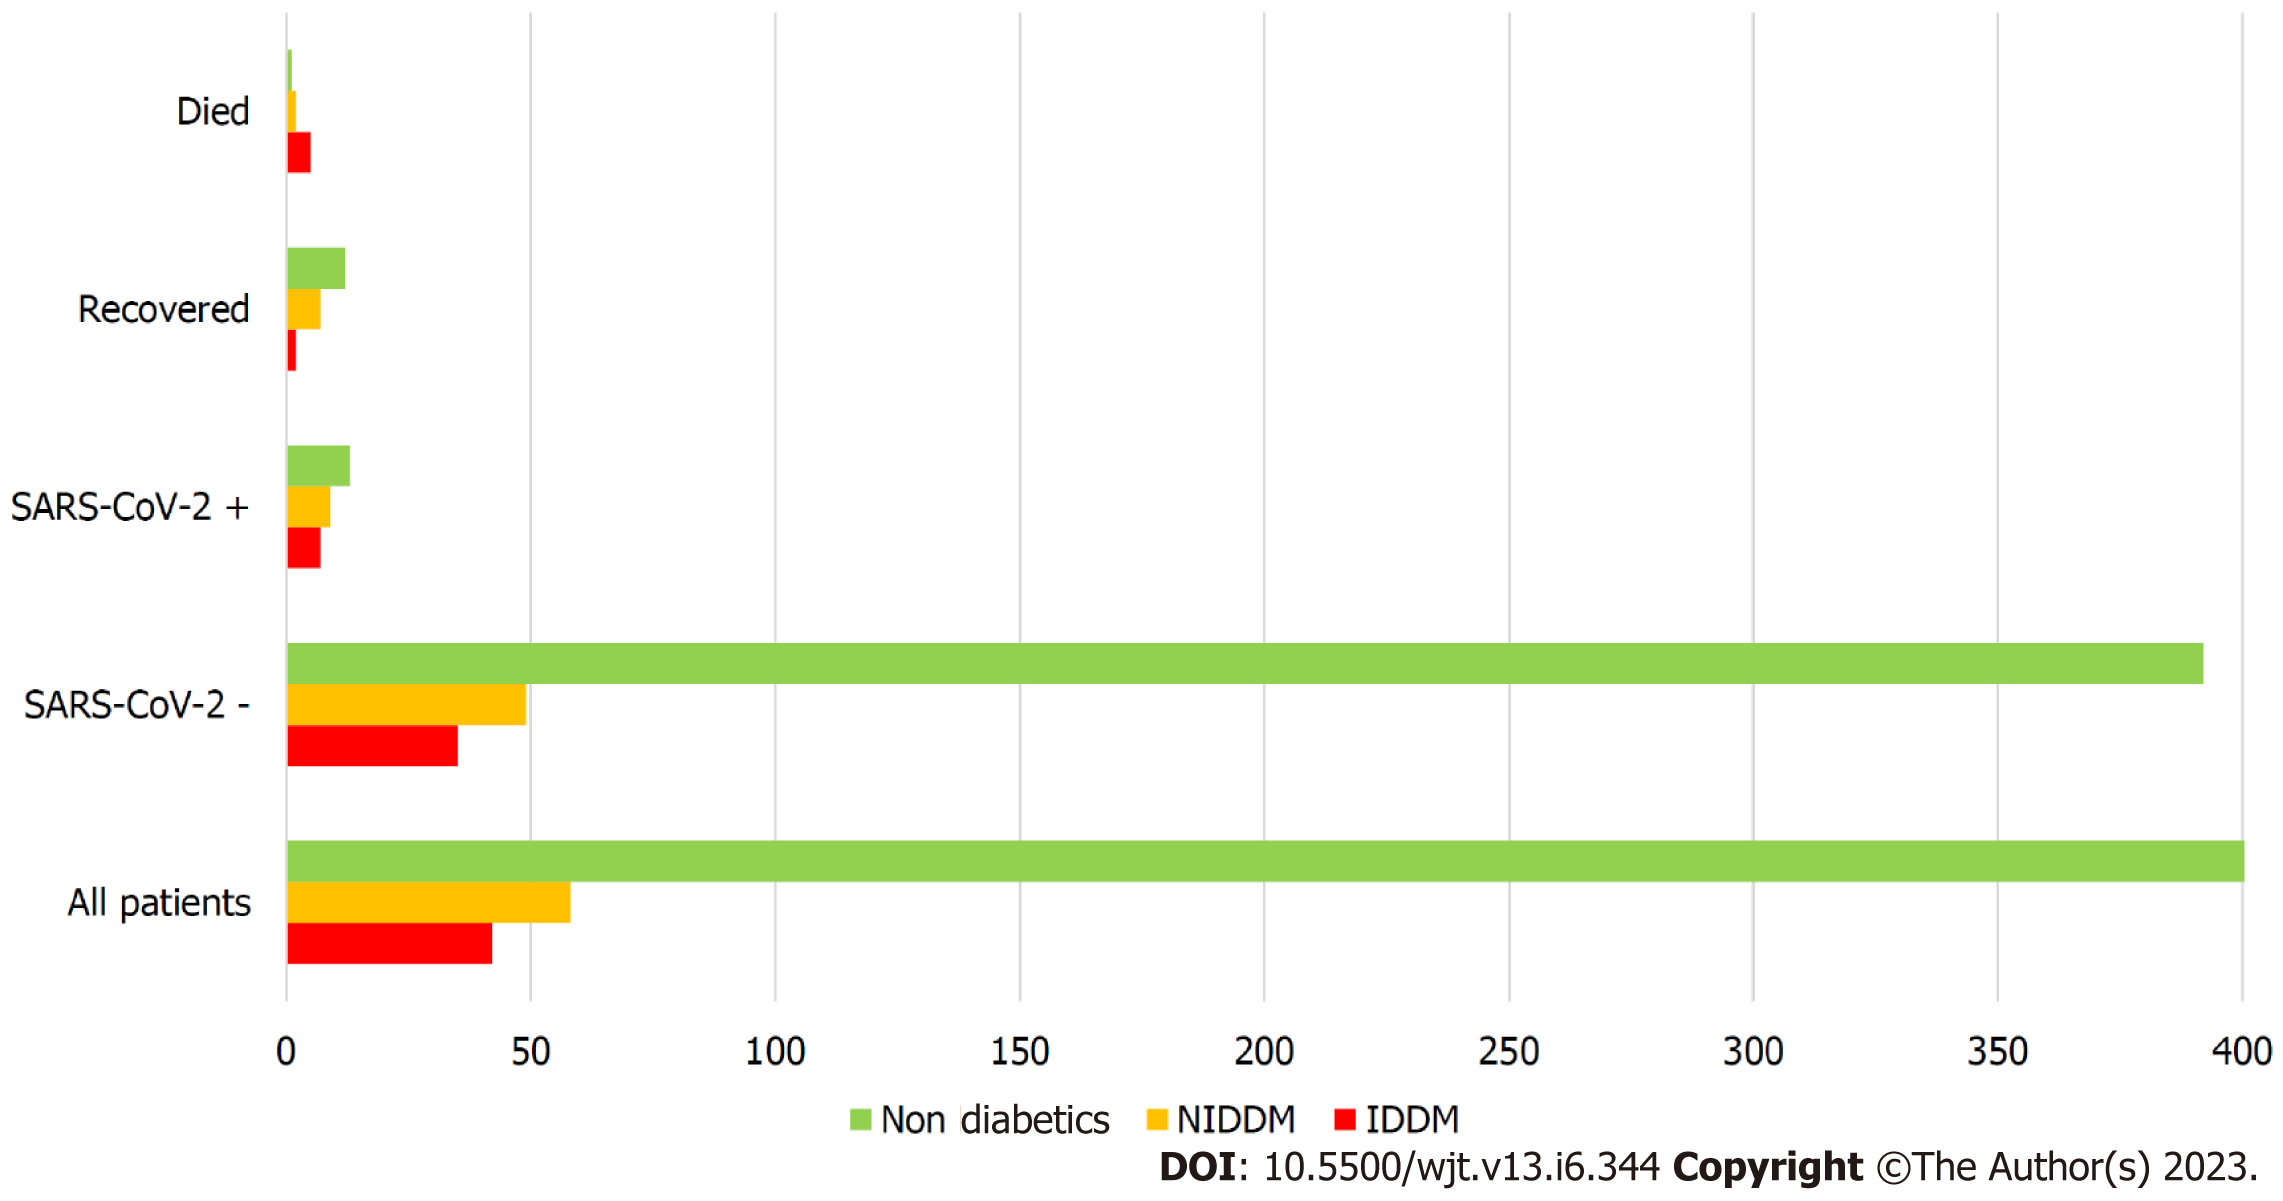
Figure 6 Diabetic status across various cohorts.
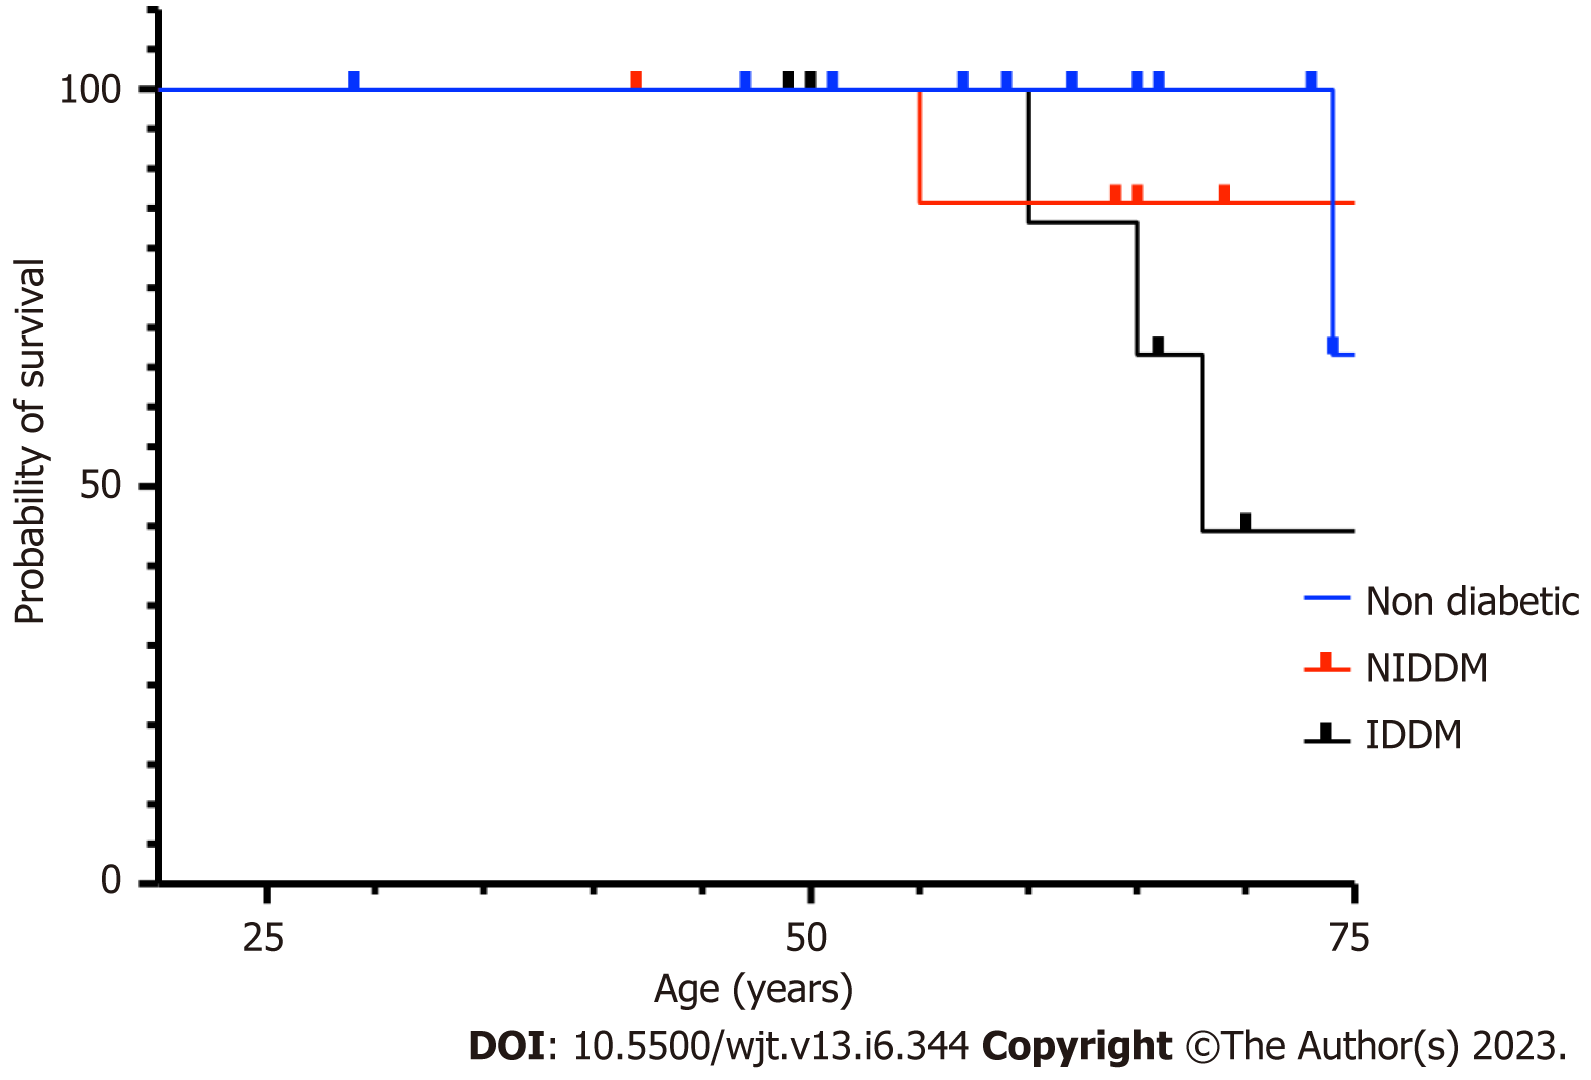
Figure 7 Survival probability with age and diabetic status.
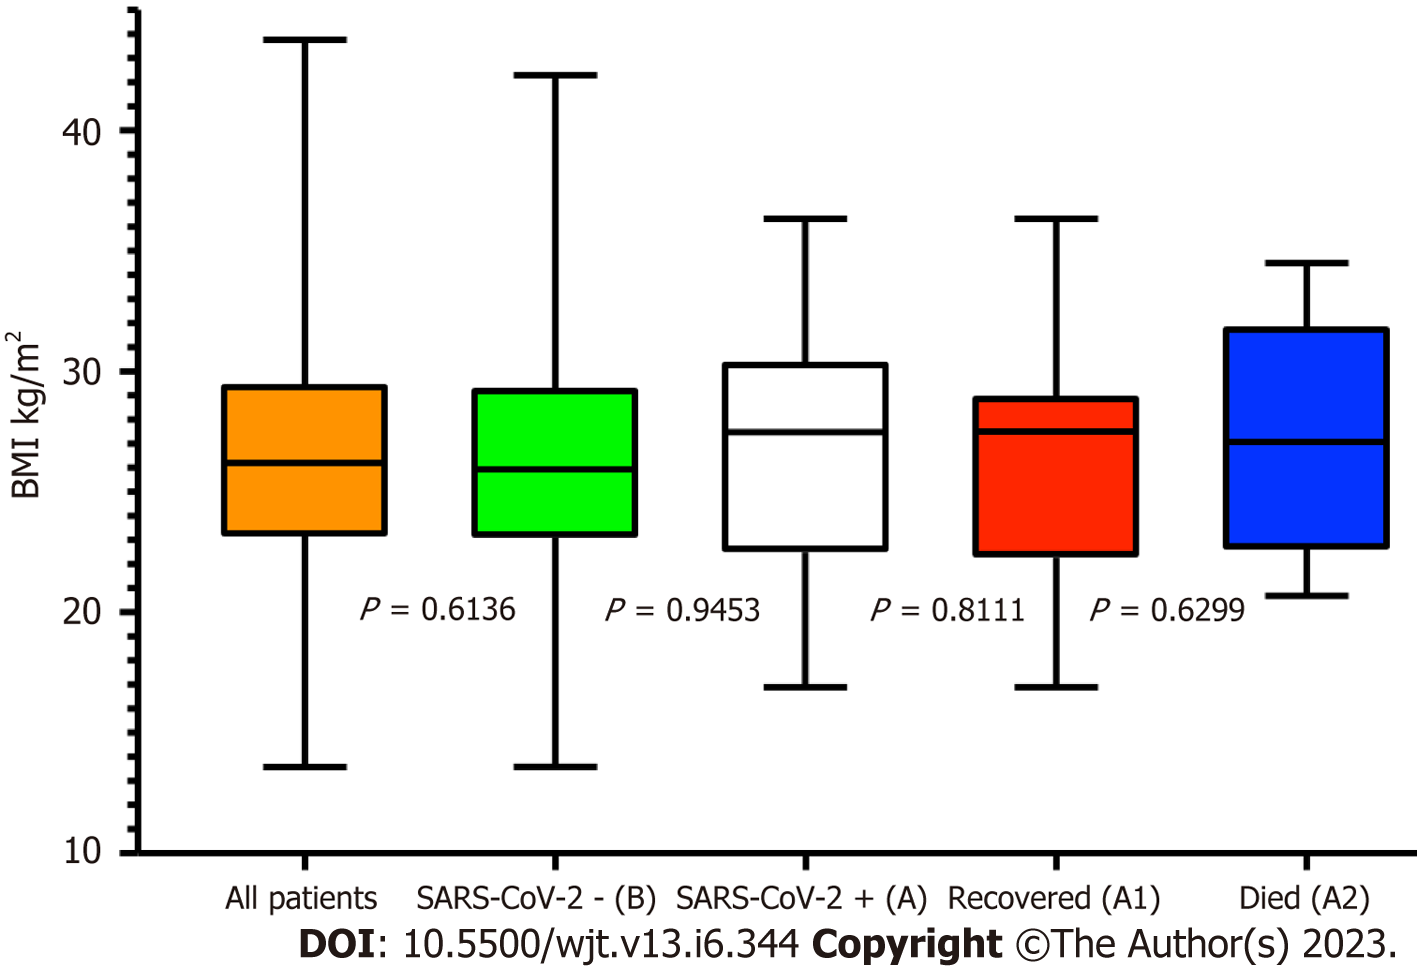
Figure 8 Body mass index range across various cohorts.
BMI: Body mass index; SARS-CoV-2: Severe acute respiratory syndrome coronavirus 2.
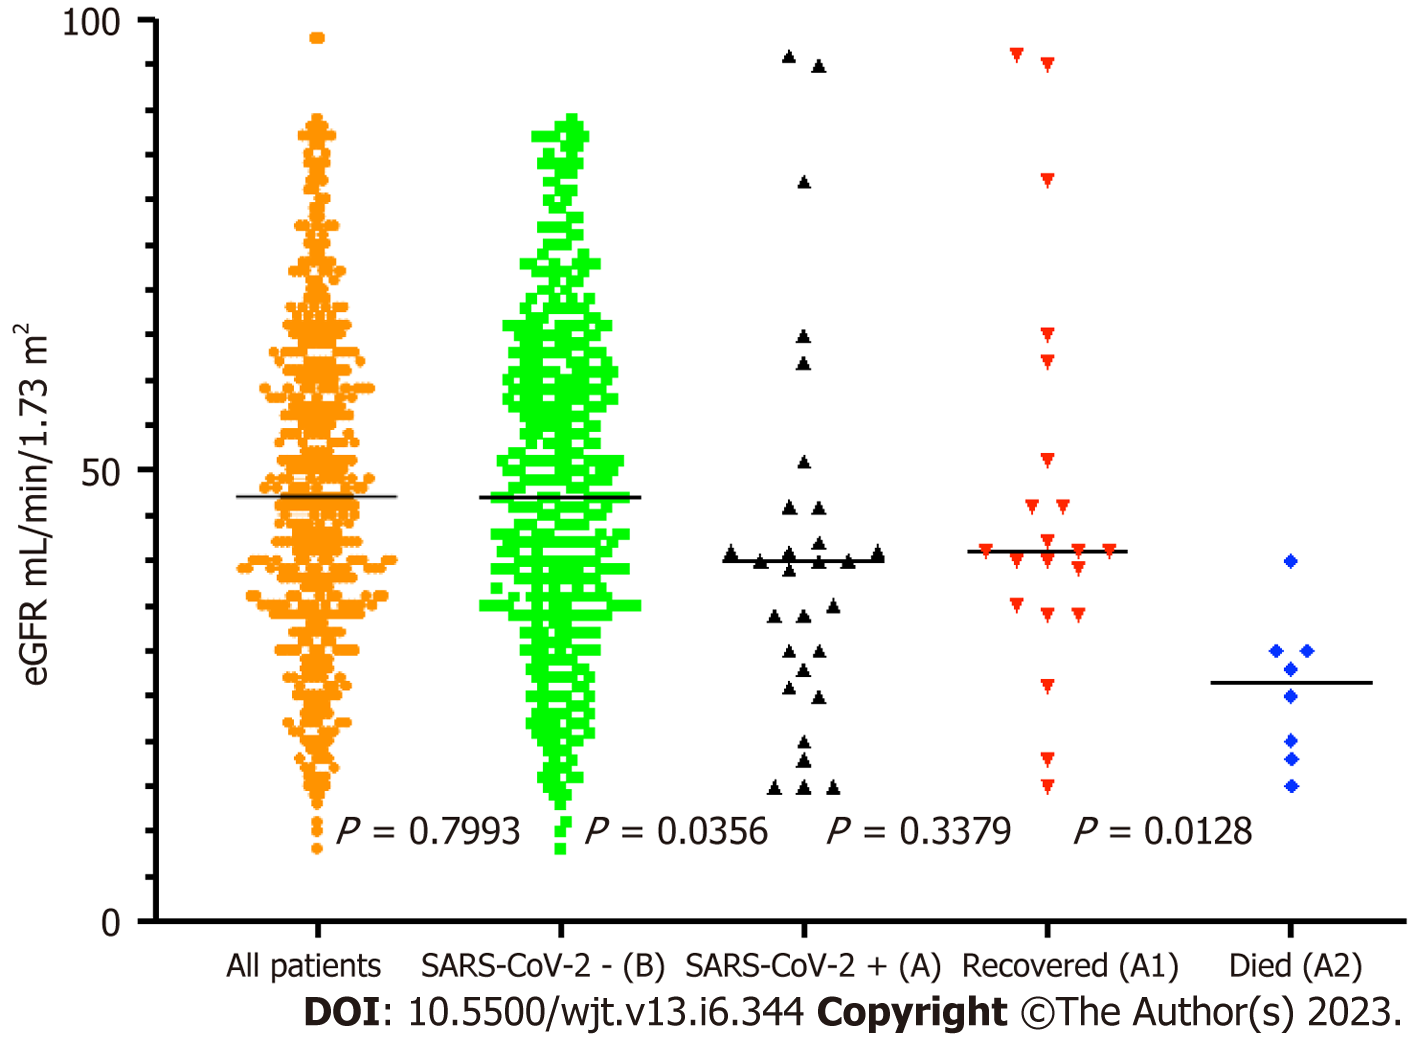
Figure 9 Median estimated glomerular filtration rate across various cohorts.
eGFR: Estimated glomerular filtration rate; SARS-CoV-2: Severe acute respiratory syndrome coronavirus 2.
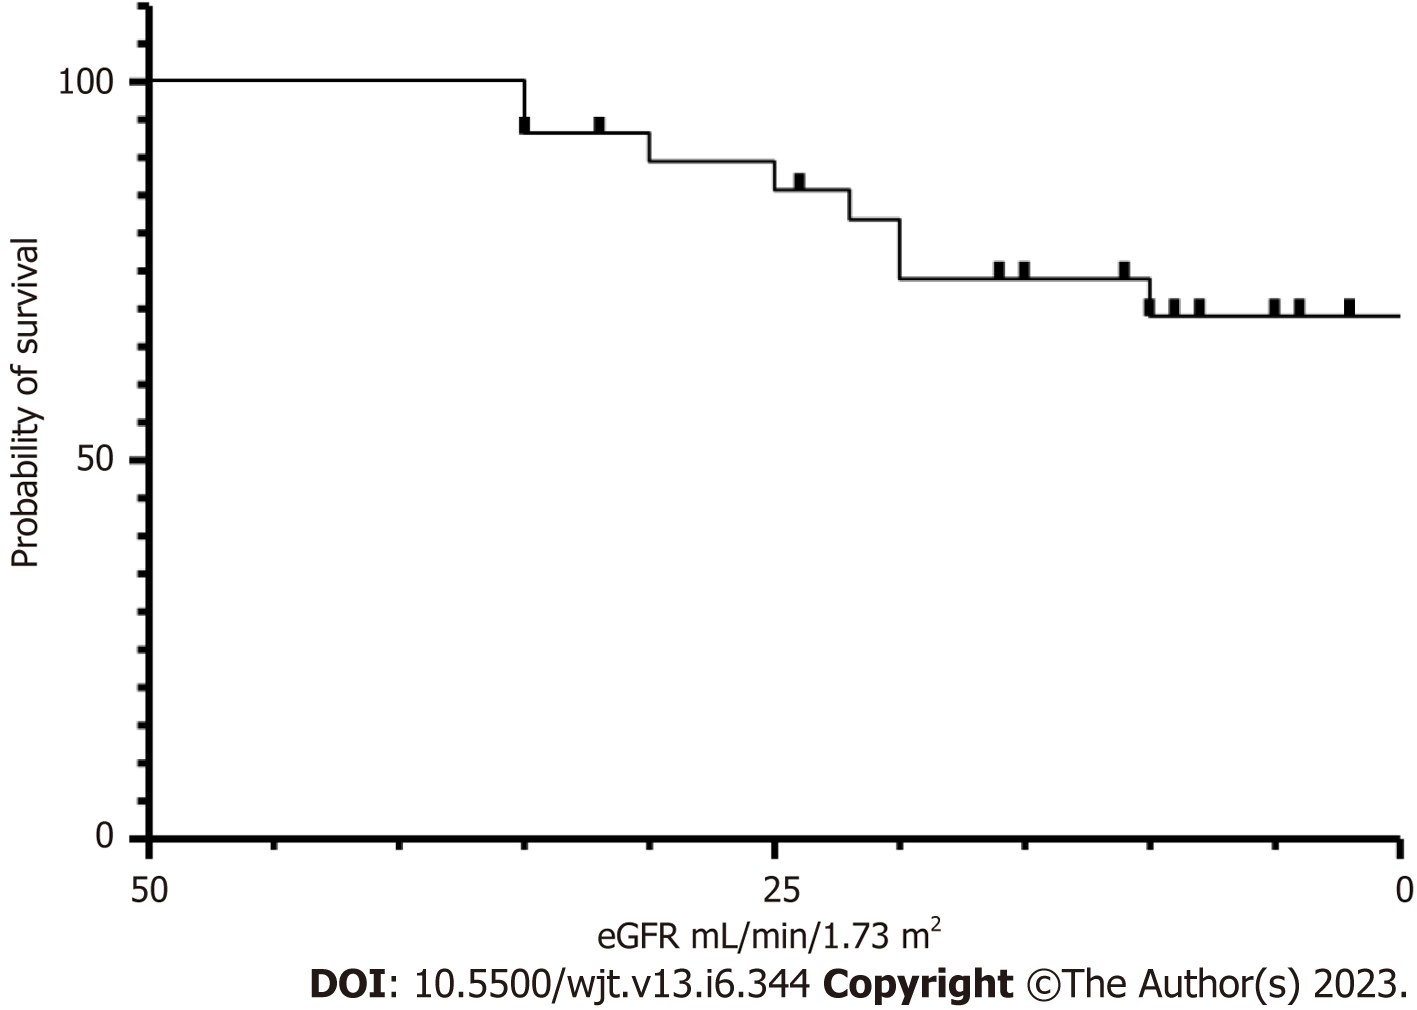
Figure 10 Survival probability dependent on graft estimated glomerular filtration rate.
eGFR: Estimated glomerular filtration rate.
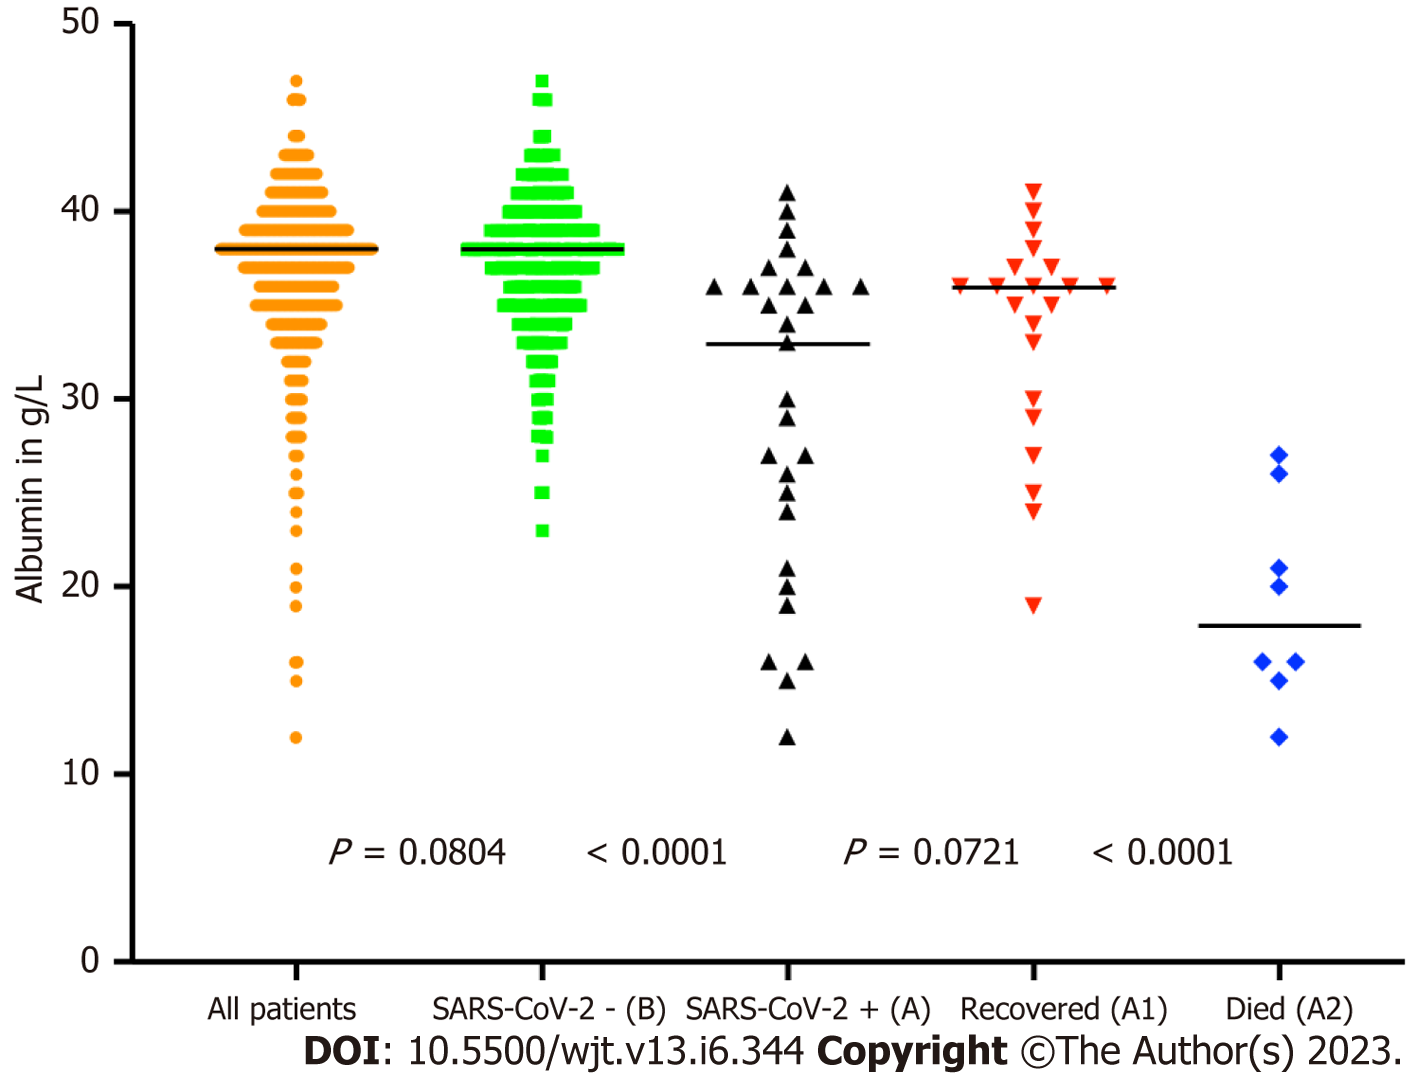
Figure 11 Albumin (g/L) across various cohorts.
SARS-CoV-2: Severe acute respiratory syndrome coronavirus 2.
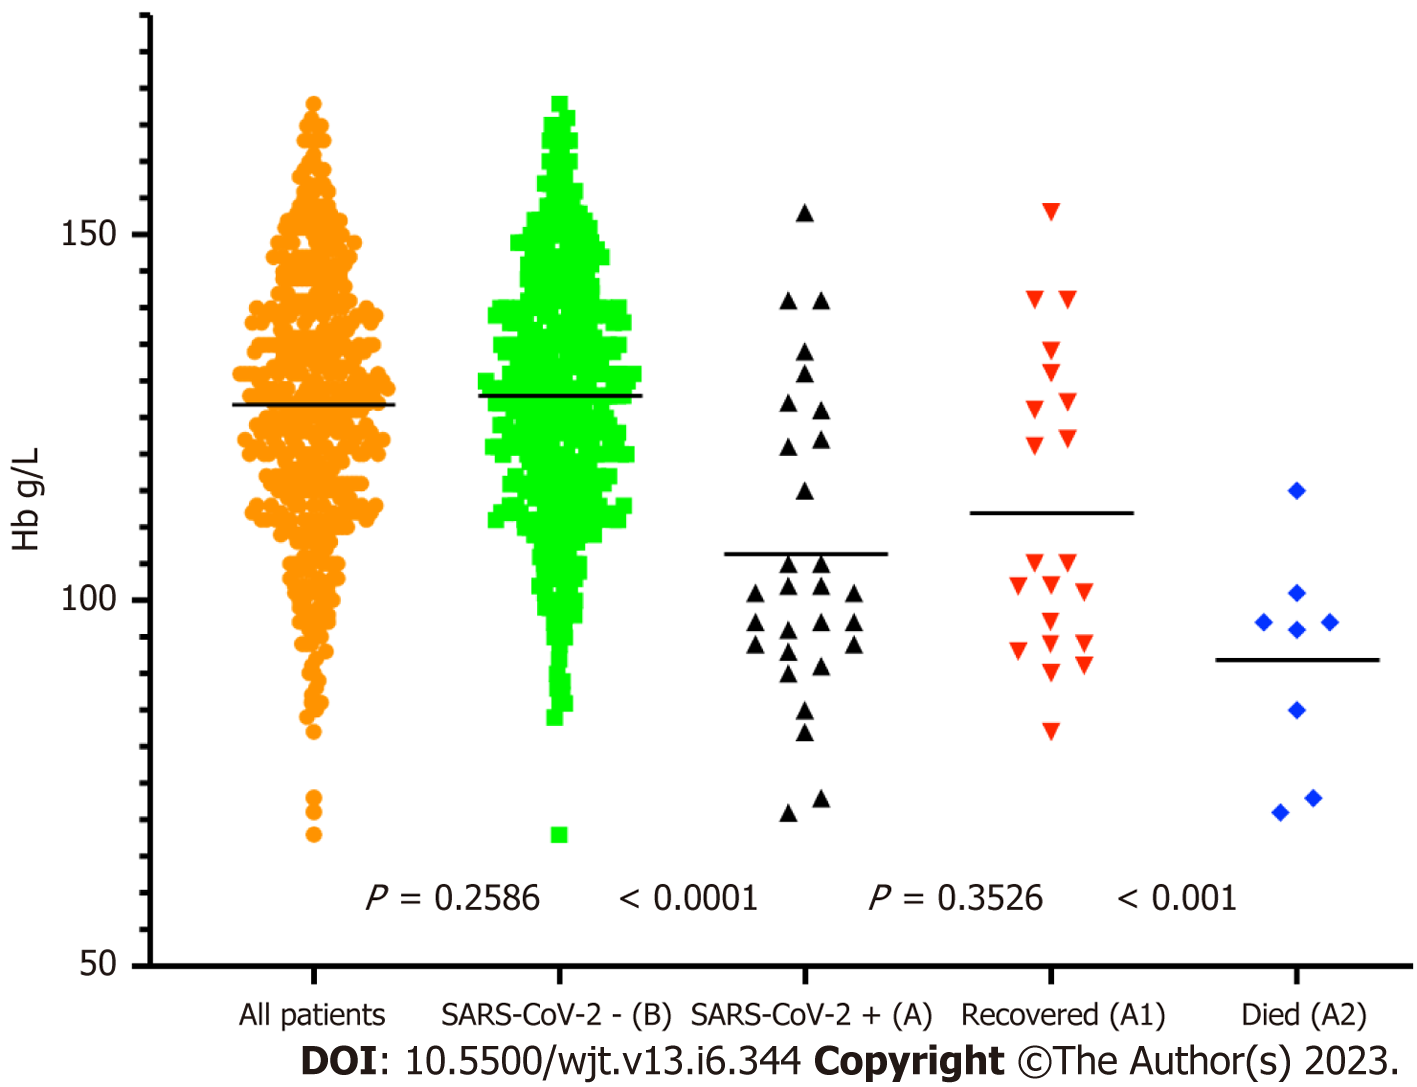
Figure 12 Hb distribution among various cohorts.
SARS-CoV-2: Severe acute respiratory syndrome coronavirus 2.
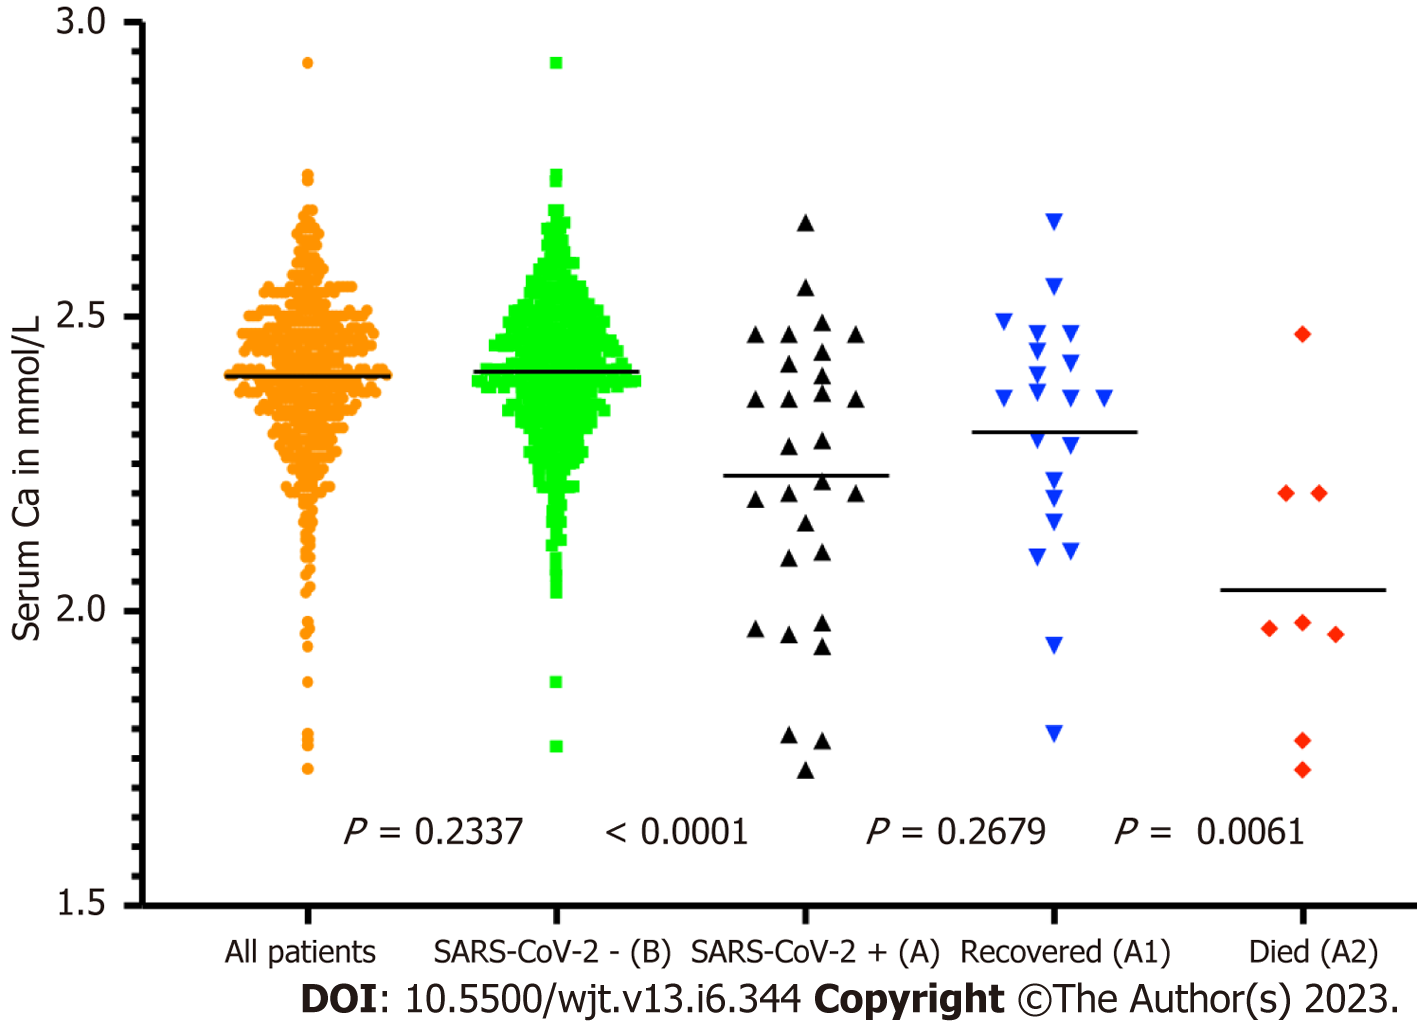
Figure 13 Serum Ca distribution across various cohorts.
SARS-CoV-2: Severe acute respiratory syndrome coronavirus 2.
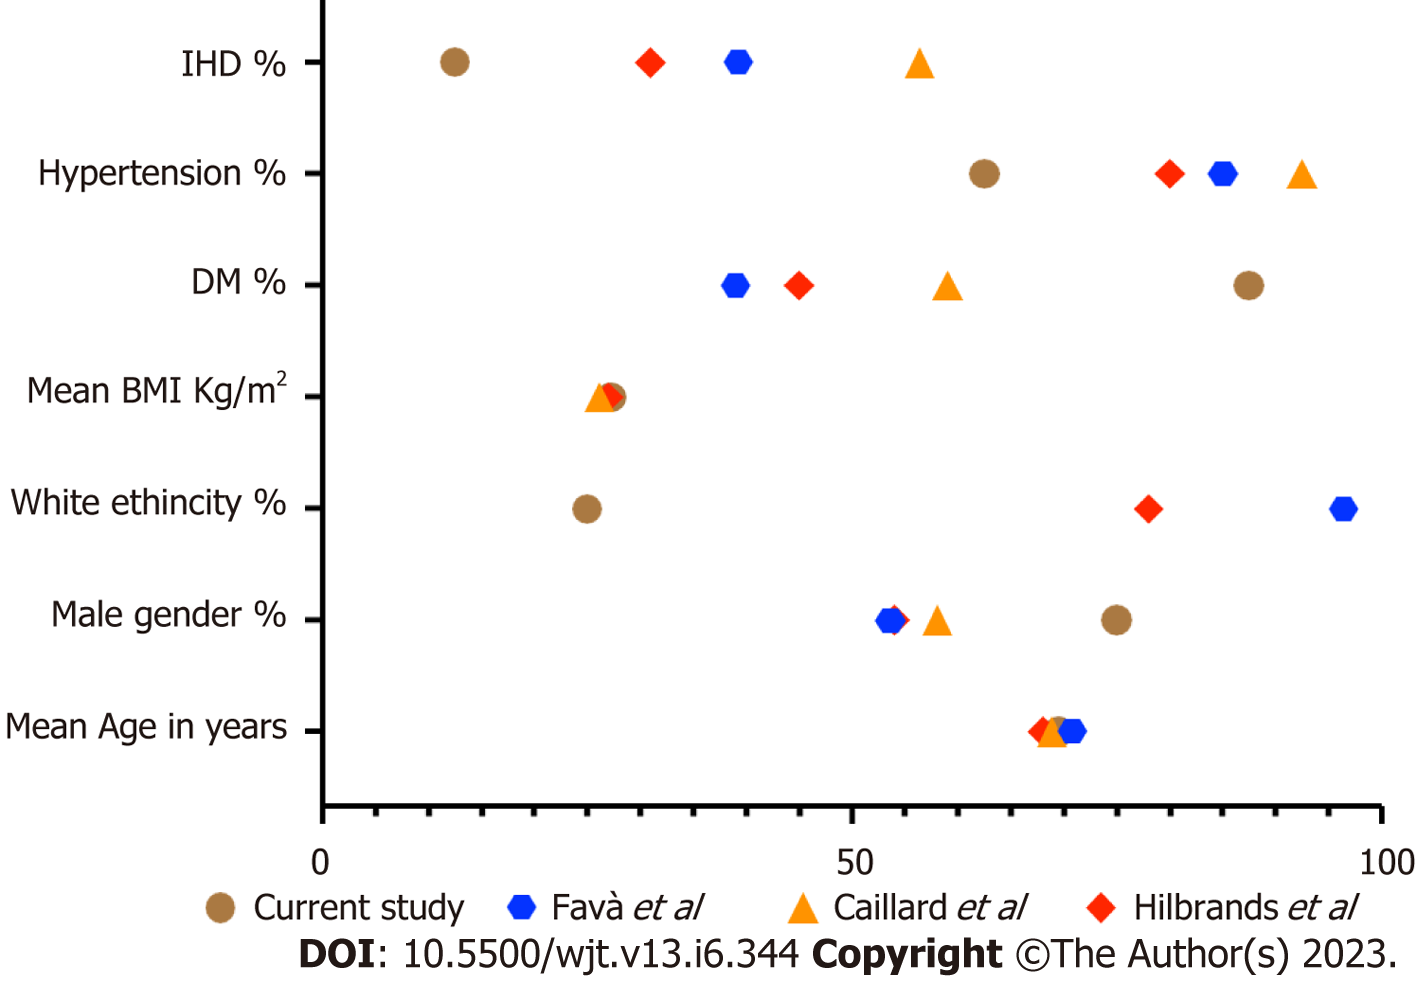
Figure 14 Comparison of current study demographics with published data.
IHD: Ischemic heart disease; DM: Diabetes mellitus; BMI: Body mass index.
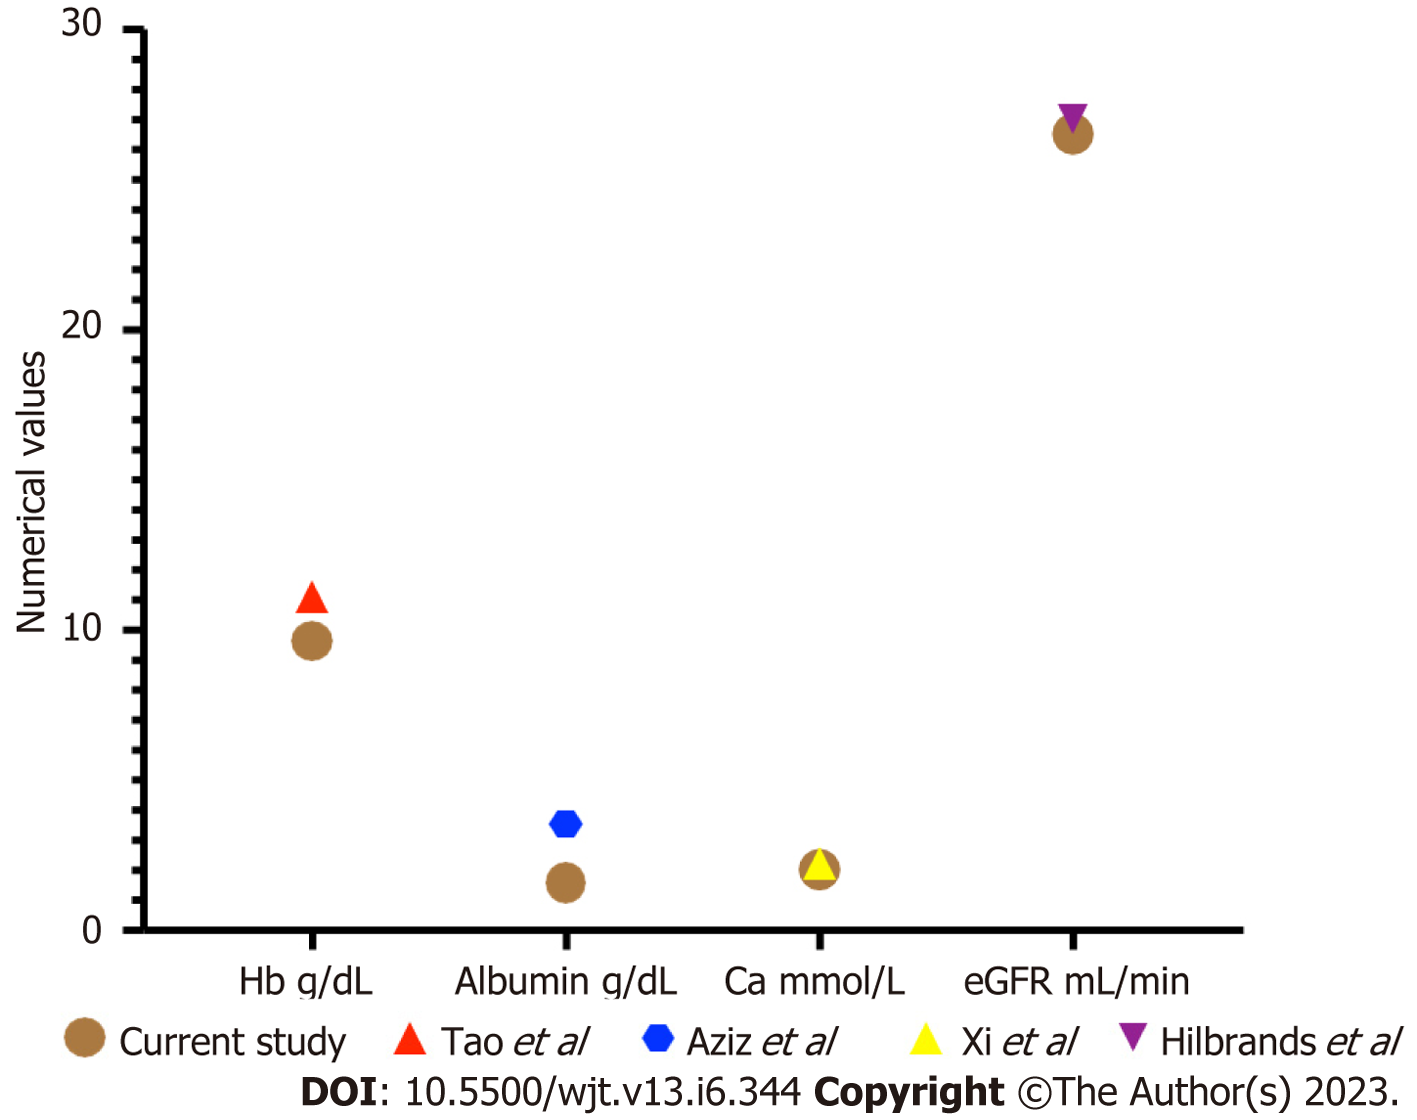
Figure 15 Comparison of current study routine lab parameters with published data.
eGFR: Estimated glomerular filtration rate.
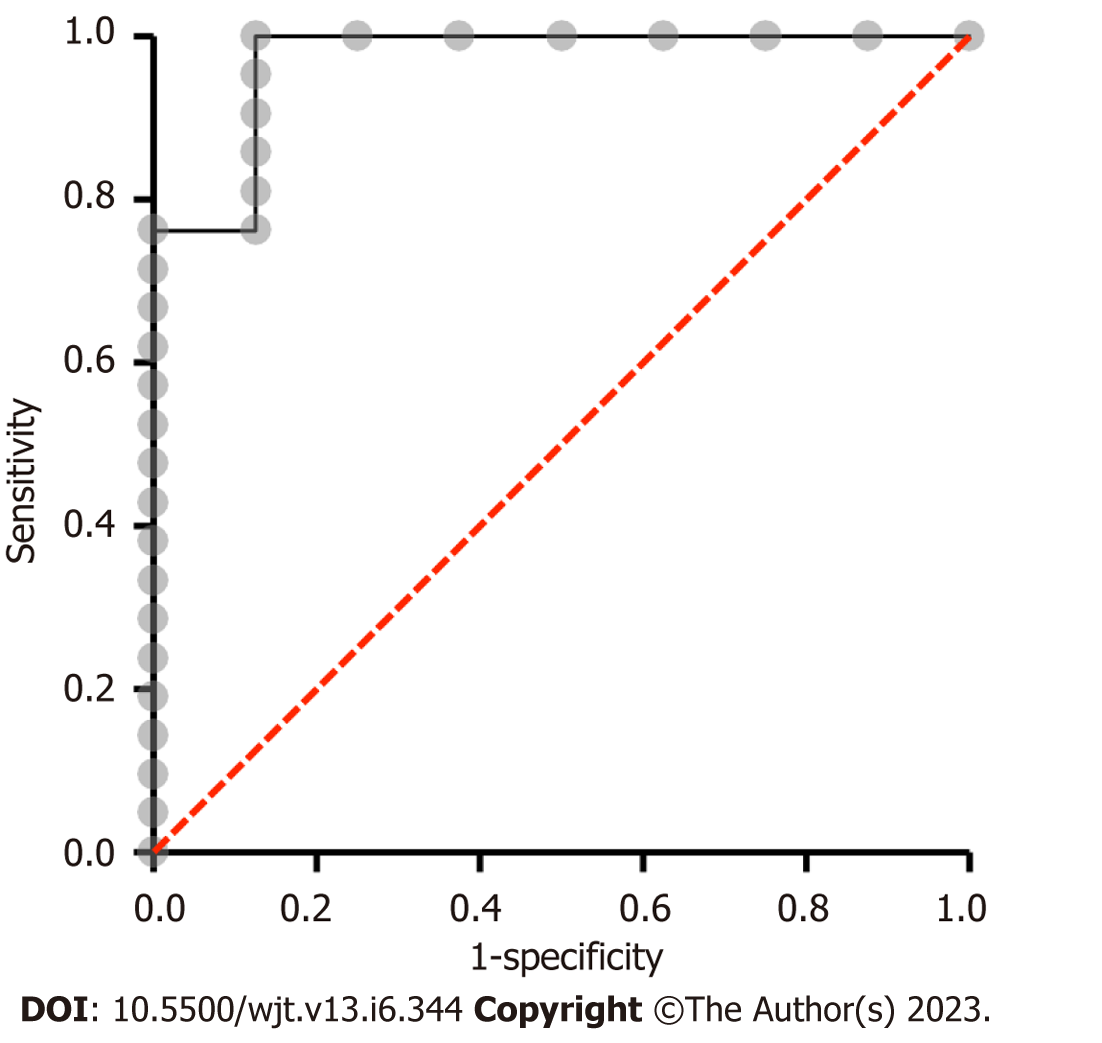
Figure 16 Multiple logistic regression: Mortality with Haemoglobin, Estimated glomerular filtration rate, Albumin and Ca.
- Citation: Ghazanfar A, Abbas M, Hussain MW, Kayal M. Risk stratification of renal transplant recipients using routine parameters: Implication of learning from SARS-CoV-2 into transplant follow-up program. World J Transplant 2023; 13(6): 344-356
- URL: https://www.wjgnet.com/2220-3230/full/v13/i6/344.htm
- DOI: https://dx.doi.org/10.5500/wjt.v13.i6.344


