Copyright
©The Author(s) 2022.
World J Transplant. Jul 18, 2022; 12(7): 184-194
Published online Jul 18, 2022. doi: 10.5500/wjt.v12.i7.184
Published online Jul 18, 2022. doi: 10.5500/wjt.v12.i7.184
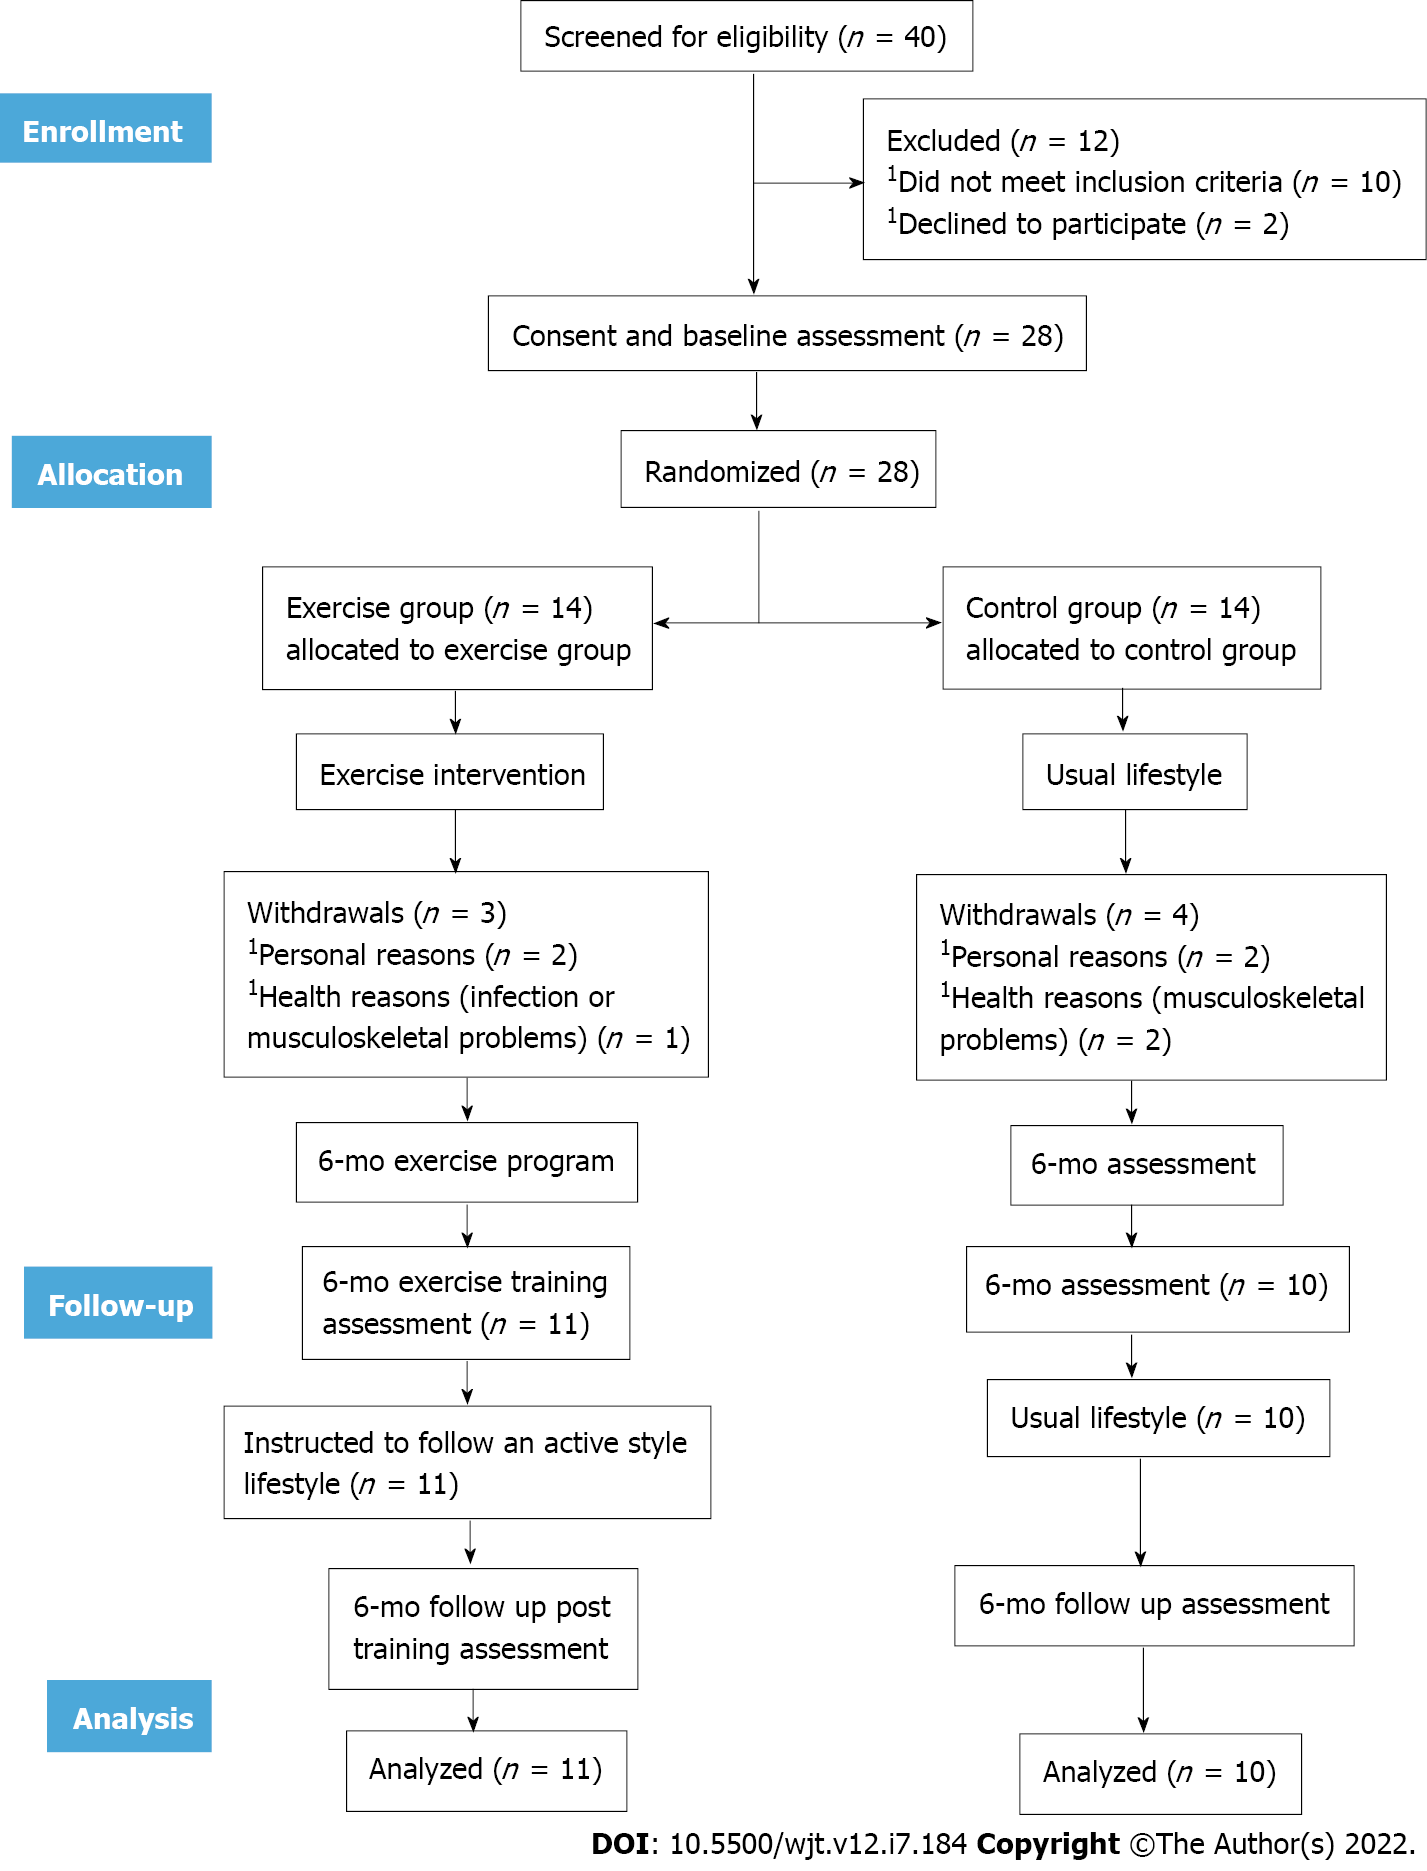
Figure 1 Flow chart diagram of the study design.
1Flowchart of participants was based on recommendations from the Consolidated Standards of Reporting Trials. EX: Exercise; C: Control.
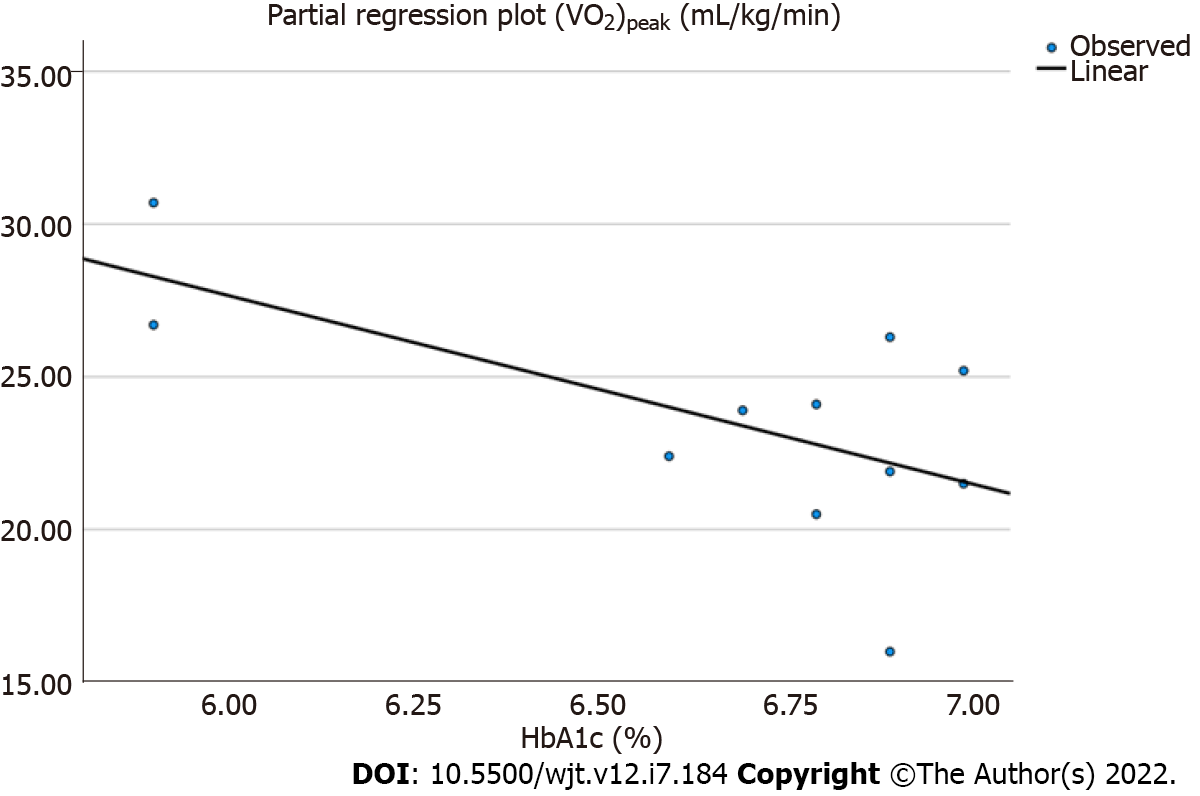
Figure 2 Linear regression analysis between the peak oxygen uptake and glycated hemoglobin (%) after 6 mo in exercise group (r = 0.
408, P = 0.03). HbA1c: Hemoglobin A1c; (VO2)peak: Maximum oxygen consumption.
- Citation: Michou V, Nikodimopoulou M, Deligiannis A, Kouidi E. Metabolic and functional effects of exercise training in diabetic kidney transplant recipients. World J Transplant 2022; 12(7): 184-194
- URL: https://www.wjgnet.com/2220-3230/full/v12/i7/184.htm
- DOI: https://dx.doi.org/10.5500/wjt.v12.i7.184


