Copyright
©The Author(s) 2019.
World J Hypertens. May 10, 2019; 9(2): 17-29
Published online May 10, 2019. doi: 10.5494/wjh.v9.i2.17
Published online May 10, 2019. doi: 10.5494/wjh.v9.i2.17
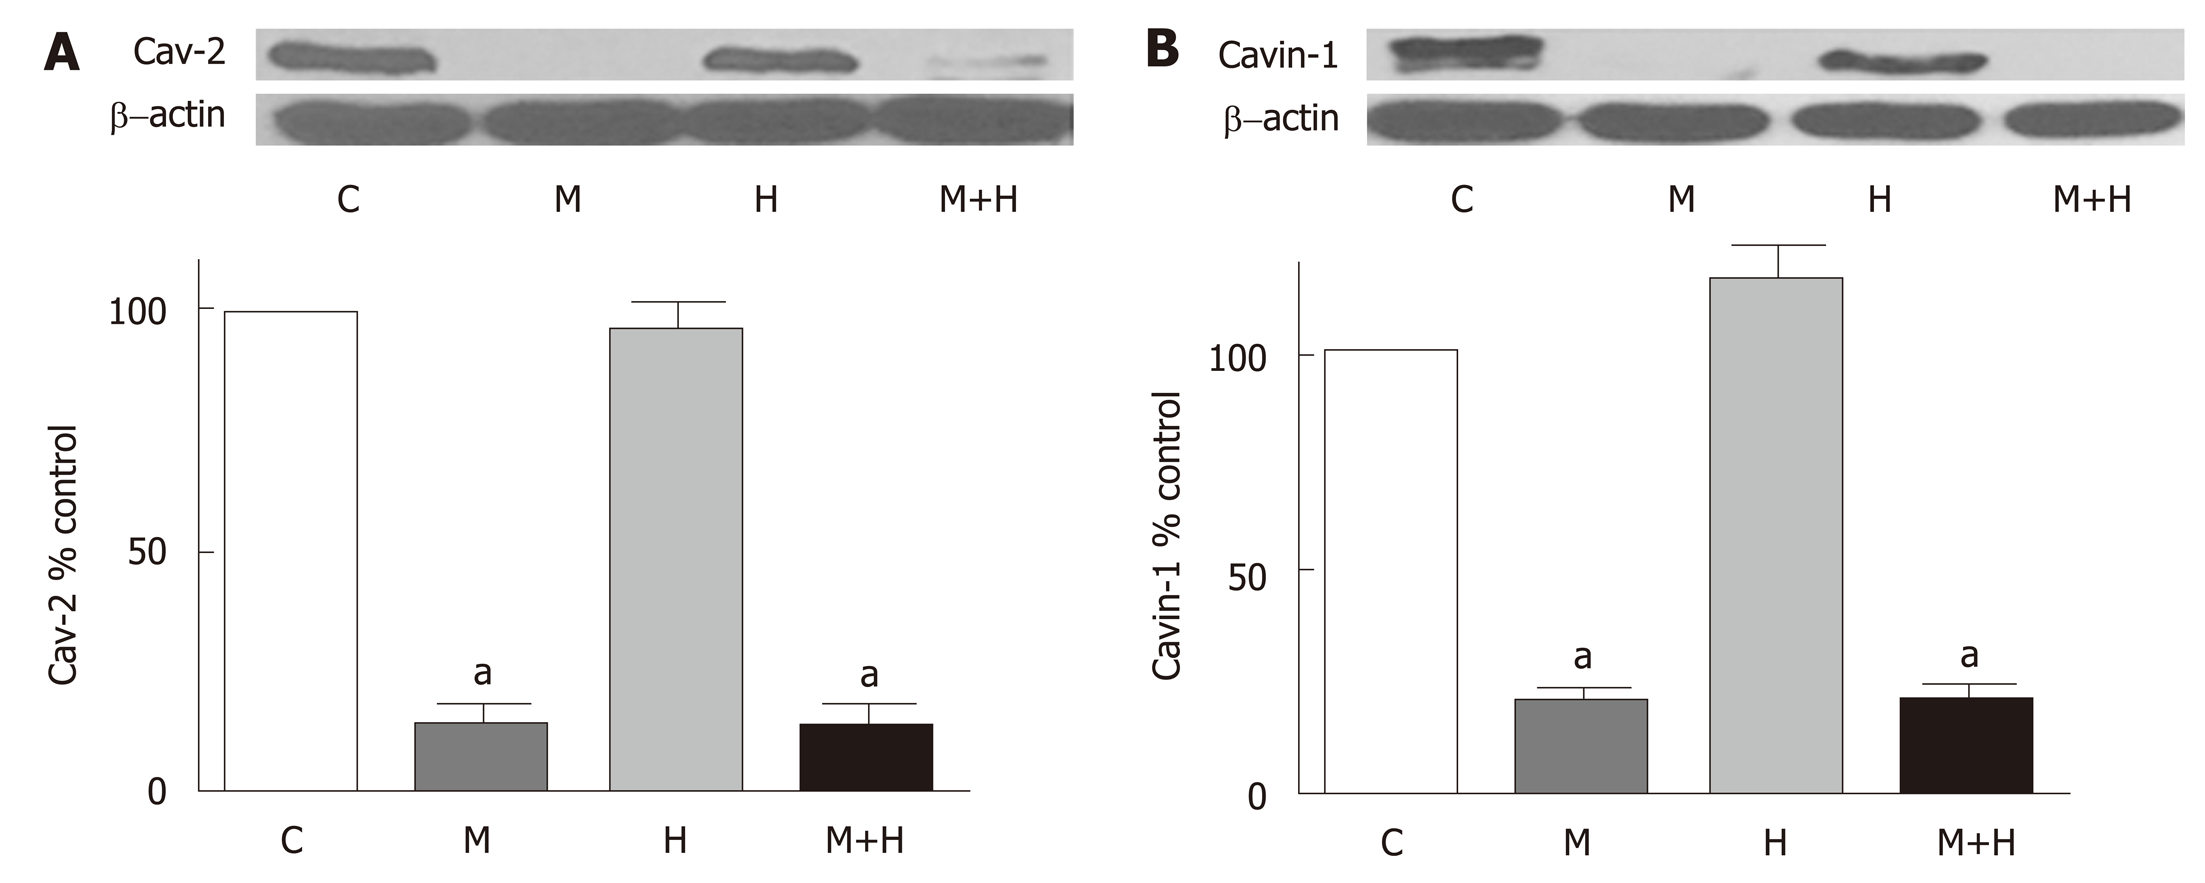
Figure 5 Representative western blot and bar graph depicting the expression of cav-2 (n = 7-8) and cavin1 (n = 6-8) in the lungs from controls (C), Monocrotaline (MCT, M), hypoxia (H) and MCT + hypoxia (M+H) groups.
There is a significant loss of cav-2 (A) and cavin-1 (B) in the M and M+H groups compared with C. There are no alterations in the expression of cav-2 or cavin-1 in the H group. aP < 0.05 vs C.
- Citation: Huang J, Mathew R. Loss of cavin1 and expression of p-caveolin-1 in pulmonary hypertension: Possible role in neointima formation. World J Hypertens 2019; 9(2): 17-29
- URL: https://www.wjgnet.com/2220-3168/full/v9/i2/17.htm
- DOI: https://dx.doi.org/10.5494/wjh.v9.i2.17


