Copyright
©The Author(s) 2015.
World J Exp Med. May 20, 2015; 5(2): 140-153
Published online May 20, 2015. doi: 10.5493/wjem.v5.i2.140
Published online May 20, 2015. doi: 10.5493/wjem.v5.i2.140
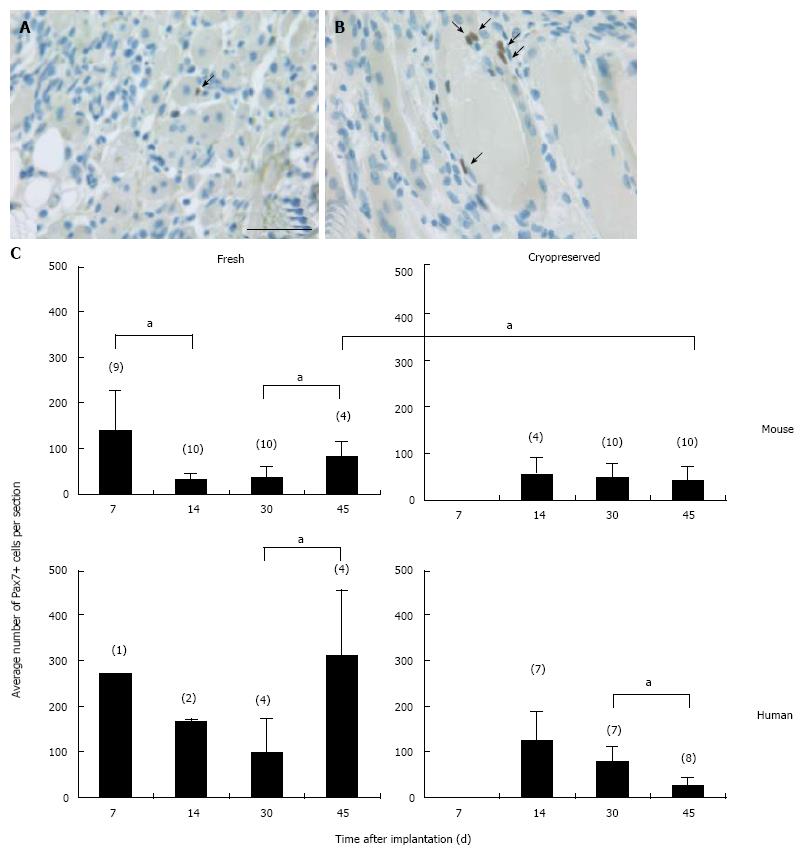
Figure 2 Pax7+ cells in regenerating skeletal muscle implants.
A, B: Examples of single (A and B) and pairs of (B) Pax7+ cells (arrows) attached or positioned in close proximity to myofibers in a fresh mouse implant at 14 d after implantation. Scale bar is 50 μm; C: Pax7+ cell counts in cross sections of fresh and cryopreserved mouse and human implants. From the center of each implant two or three consecutive sections were stained for Pax7. The average number of Pax7+ cells per section and SD are plotted. Data from implants with or without MSCs were pooled as they contained very similar numbers of Pax7+ cells. Numbers in parentheses indicate numbers of implants analyzed. aP < 0.05.
- Citation: Garza-Rodea ASL, Boersma H, Dambrot C, Vries AA, Bekkum DWV, Knaän-Shanzer S. Barriers in contribution of human mesenchymal stem cells to murine muscle regeneration. World J Exp Med 2015; 5(2): 140-153
- URL: https://www.wjgnet.com/2220-315X/full/v5/i2/140.htm
- DOI: https://dx.doi.org/10.5493/wjem.v5.i2.140


