Copyright
©The Author(s) 2025.
World J Exp Med. Sep 20, 2025; 15(3): 99330
Published online Sep 20, 2025. doi: 10.5493/wjem.v15.i3.99330
Published online Sep 20, 2025. doi: 10.5493/wjem.v15.i3.99330
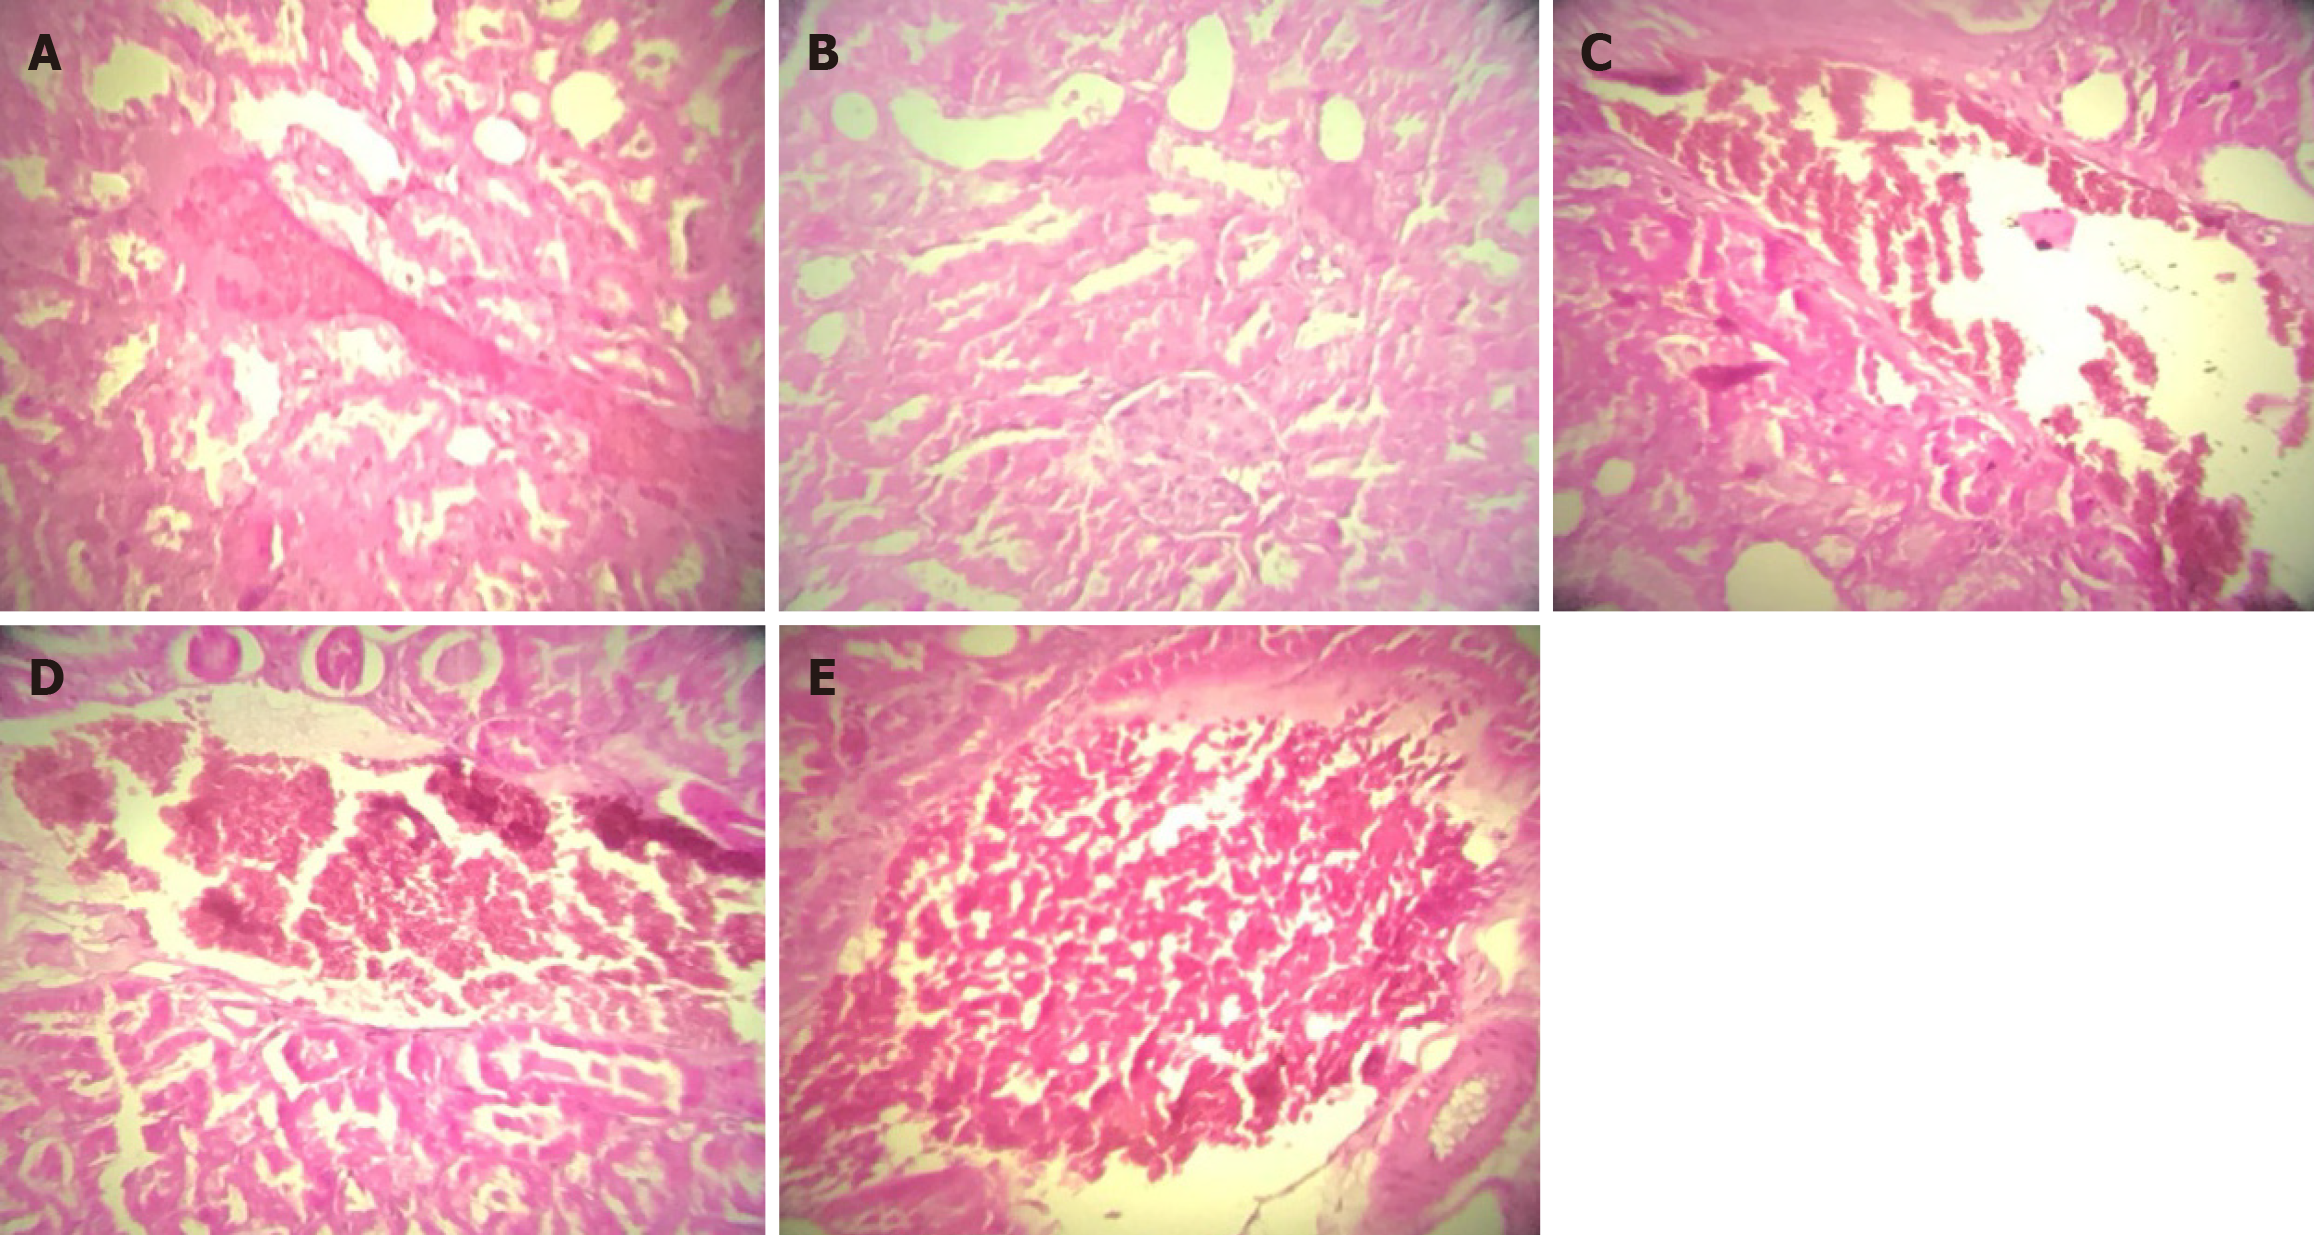
Figure 1 Histopathological changes in kidney tissues after D-glucose administration with and without honey, propolis, and their combination.
A: Control, normal; B: D-glucose + honey, mild vascular congestion; C: D-glucose + propolis, mild vascular congestion; D: D-glucose + honey + propolis, mild vascular congestion; E: D-glucose, vascular congestion + hemorrhagic foci of the kidneys.
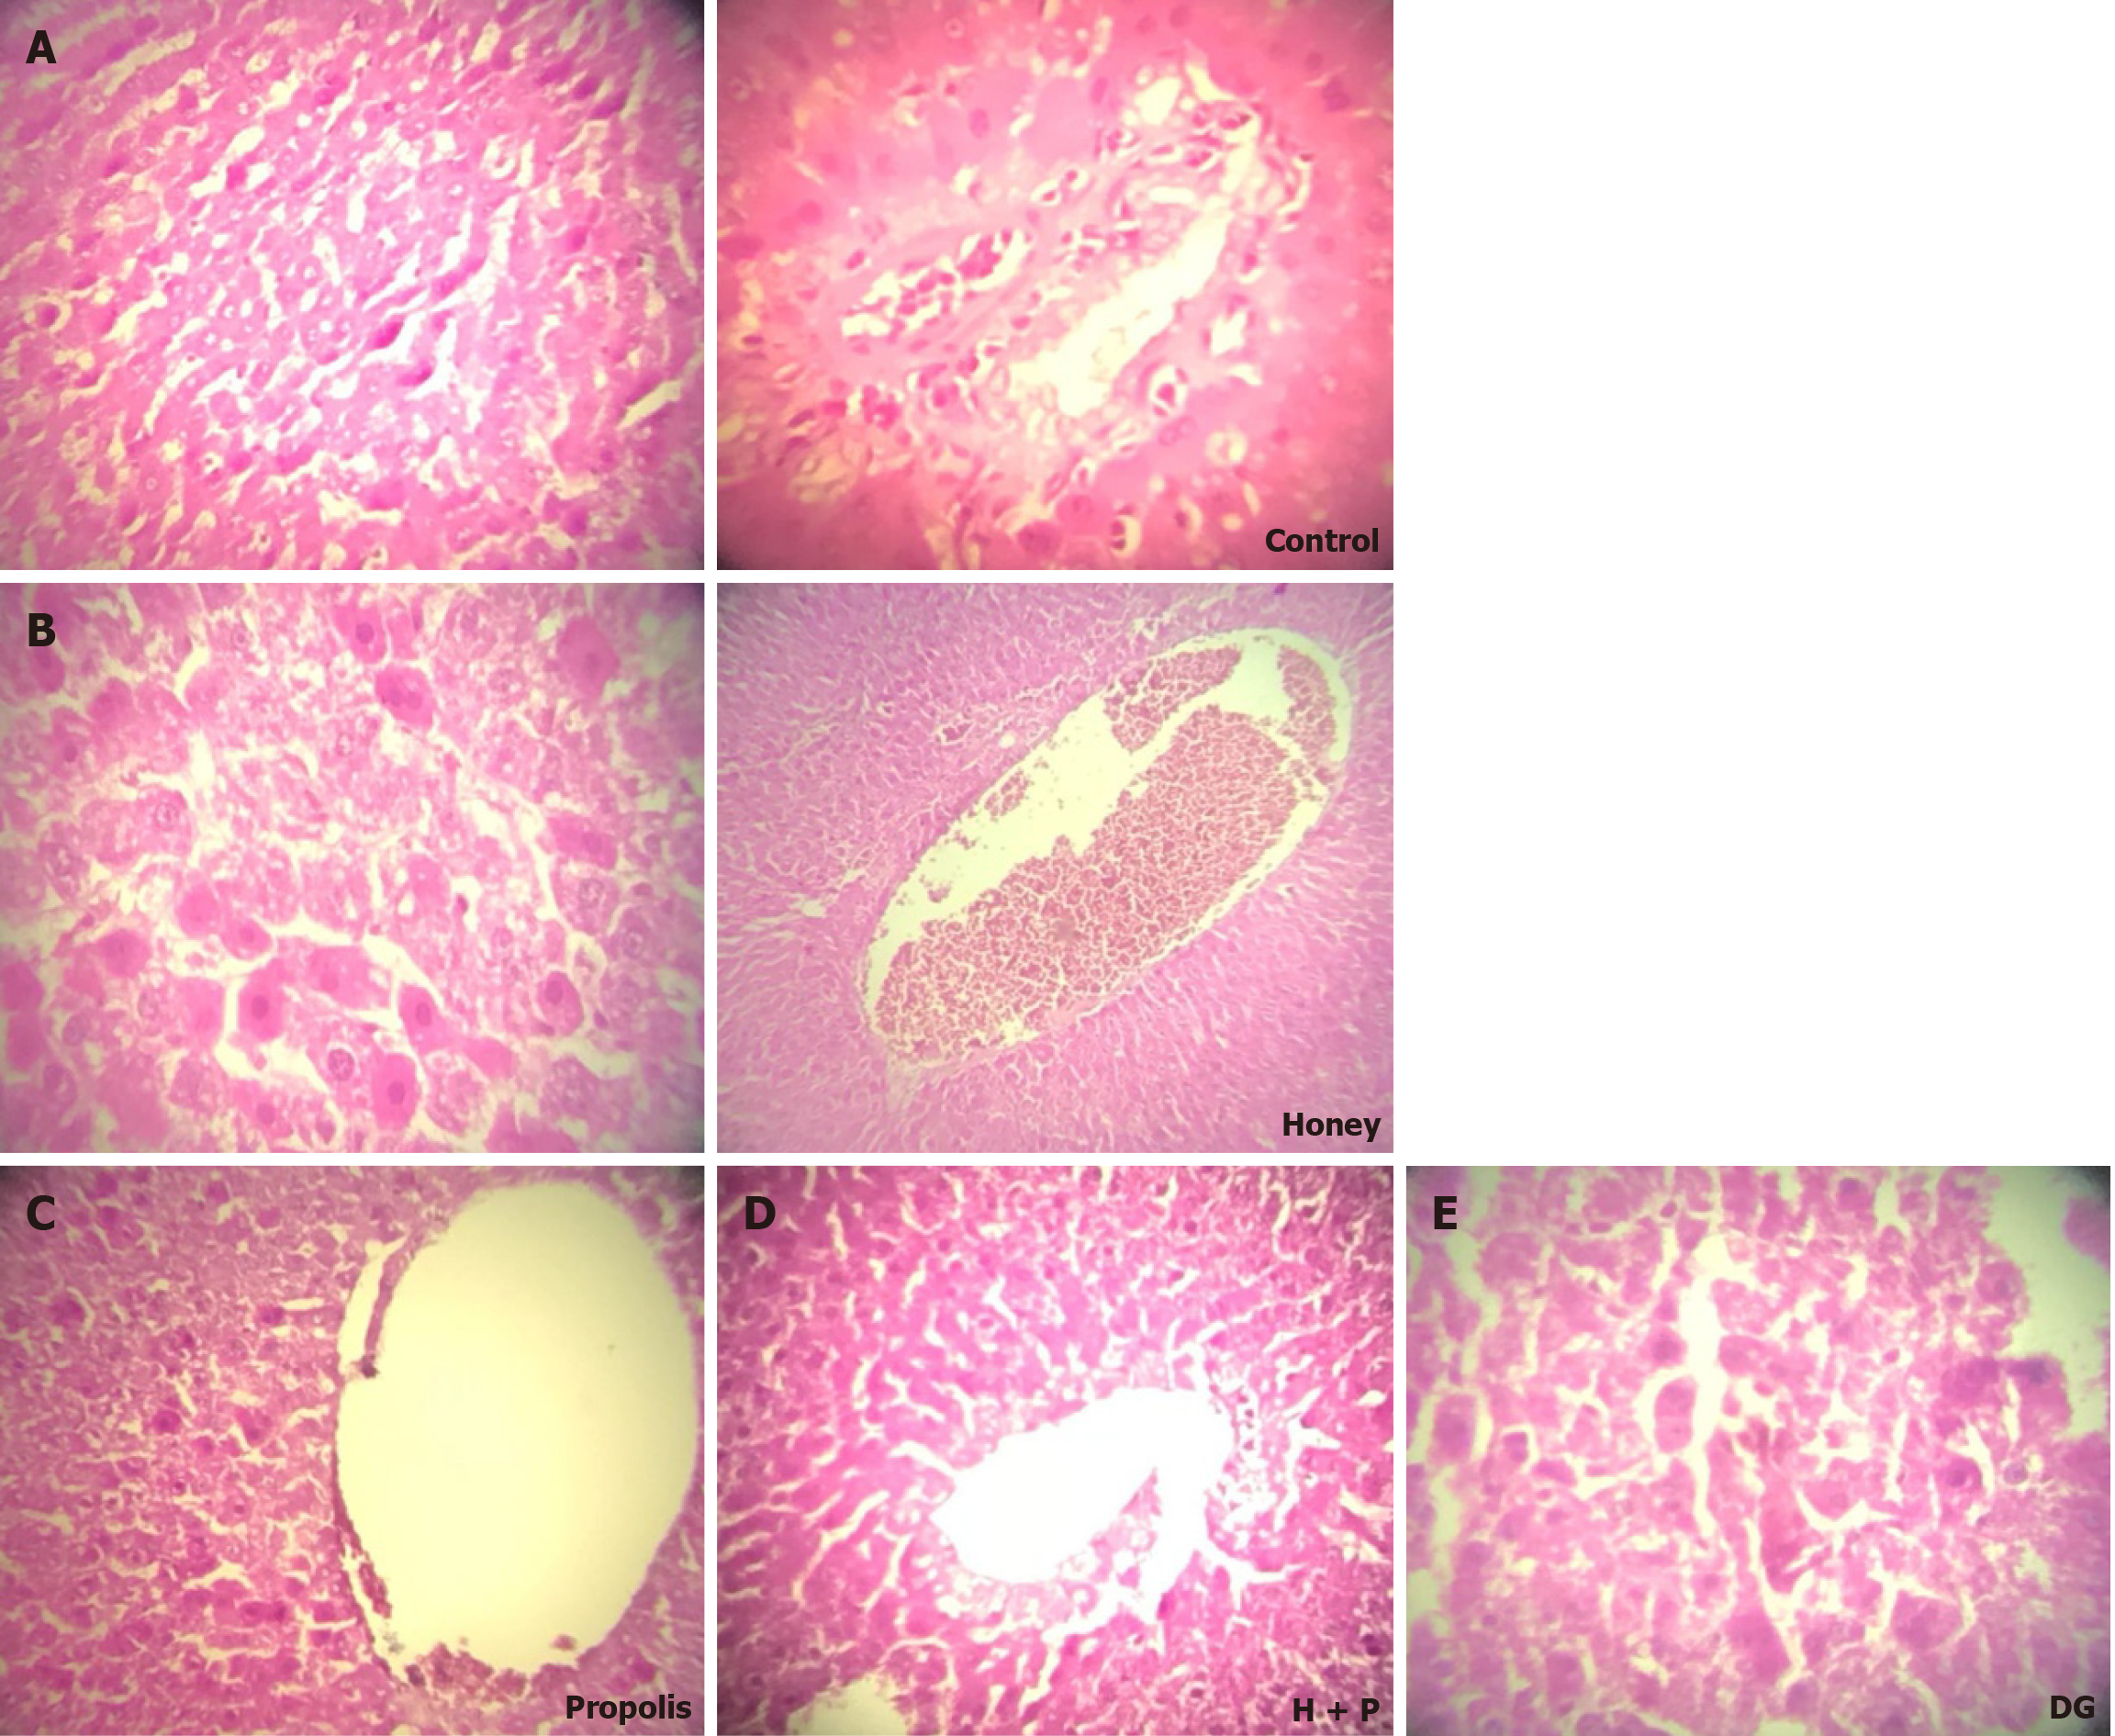
Figure 2 Histopathological changes in liver tissues after D-glucose administration with and without honey, propolis, and their com
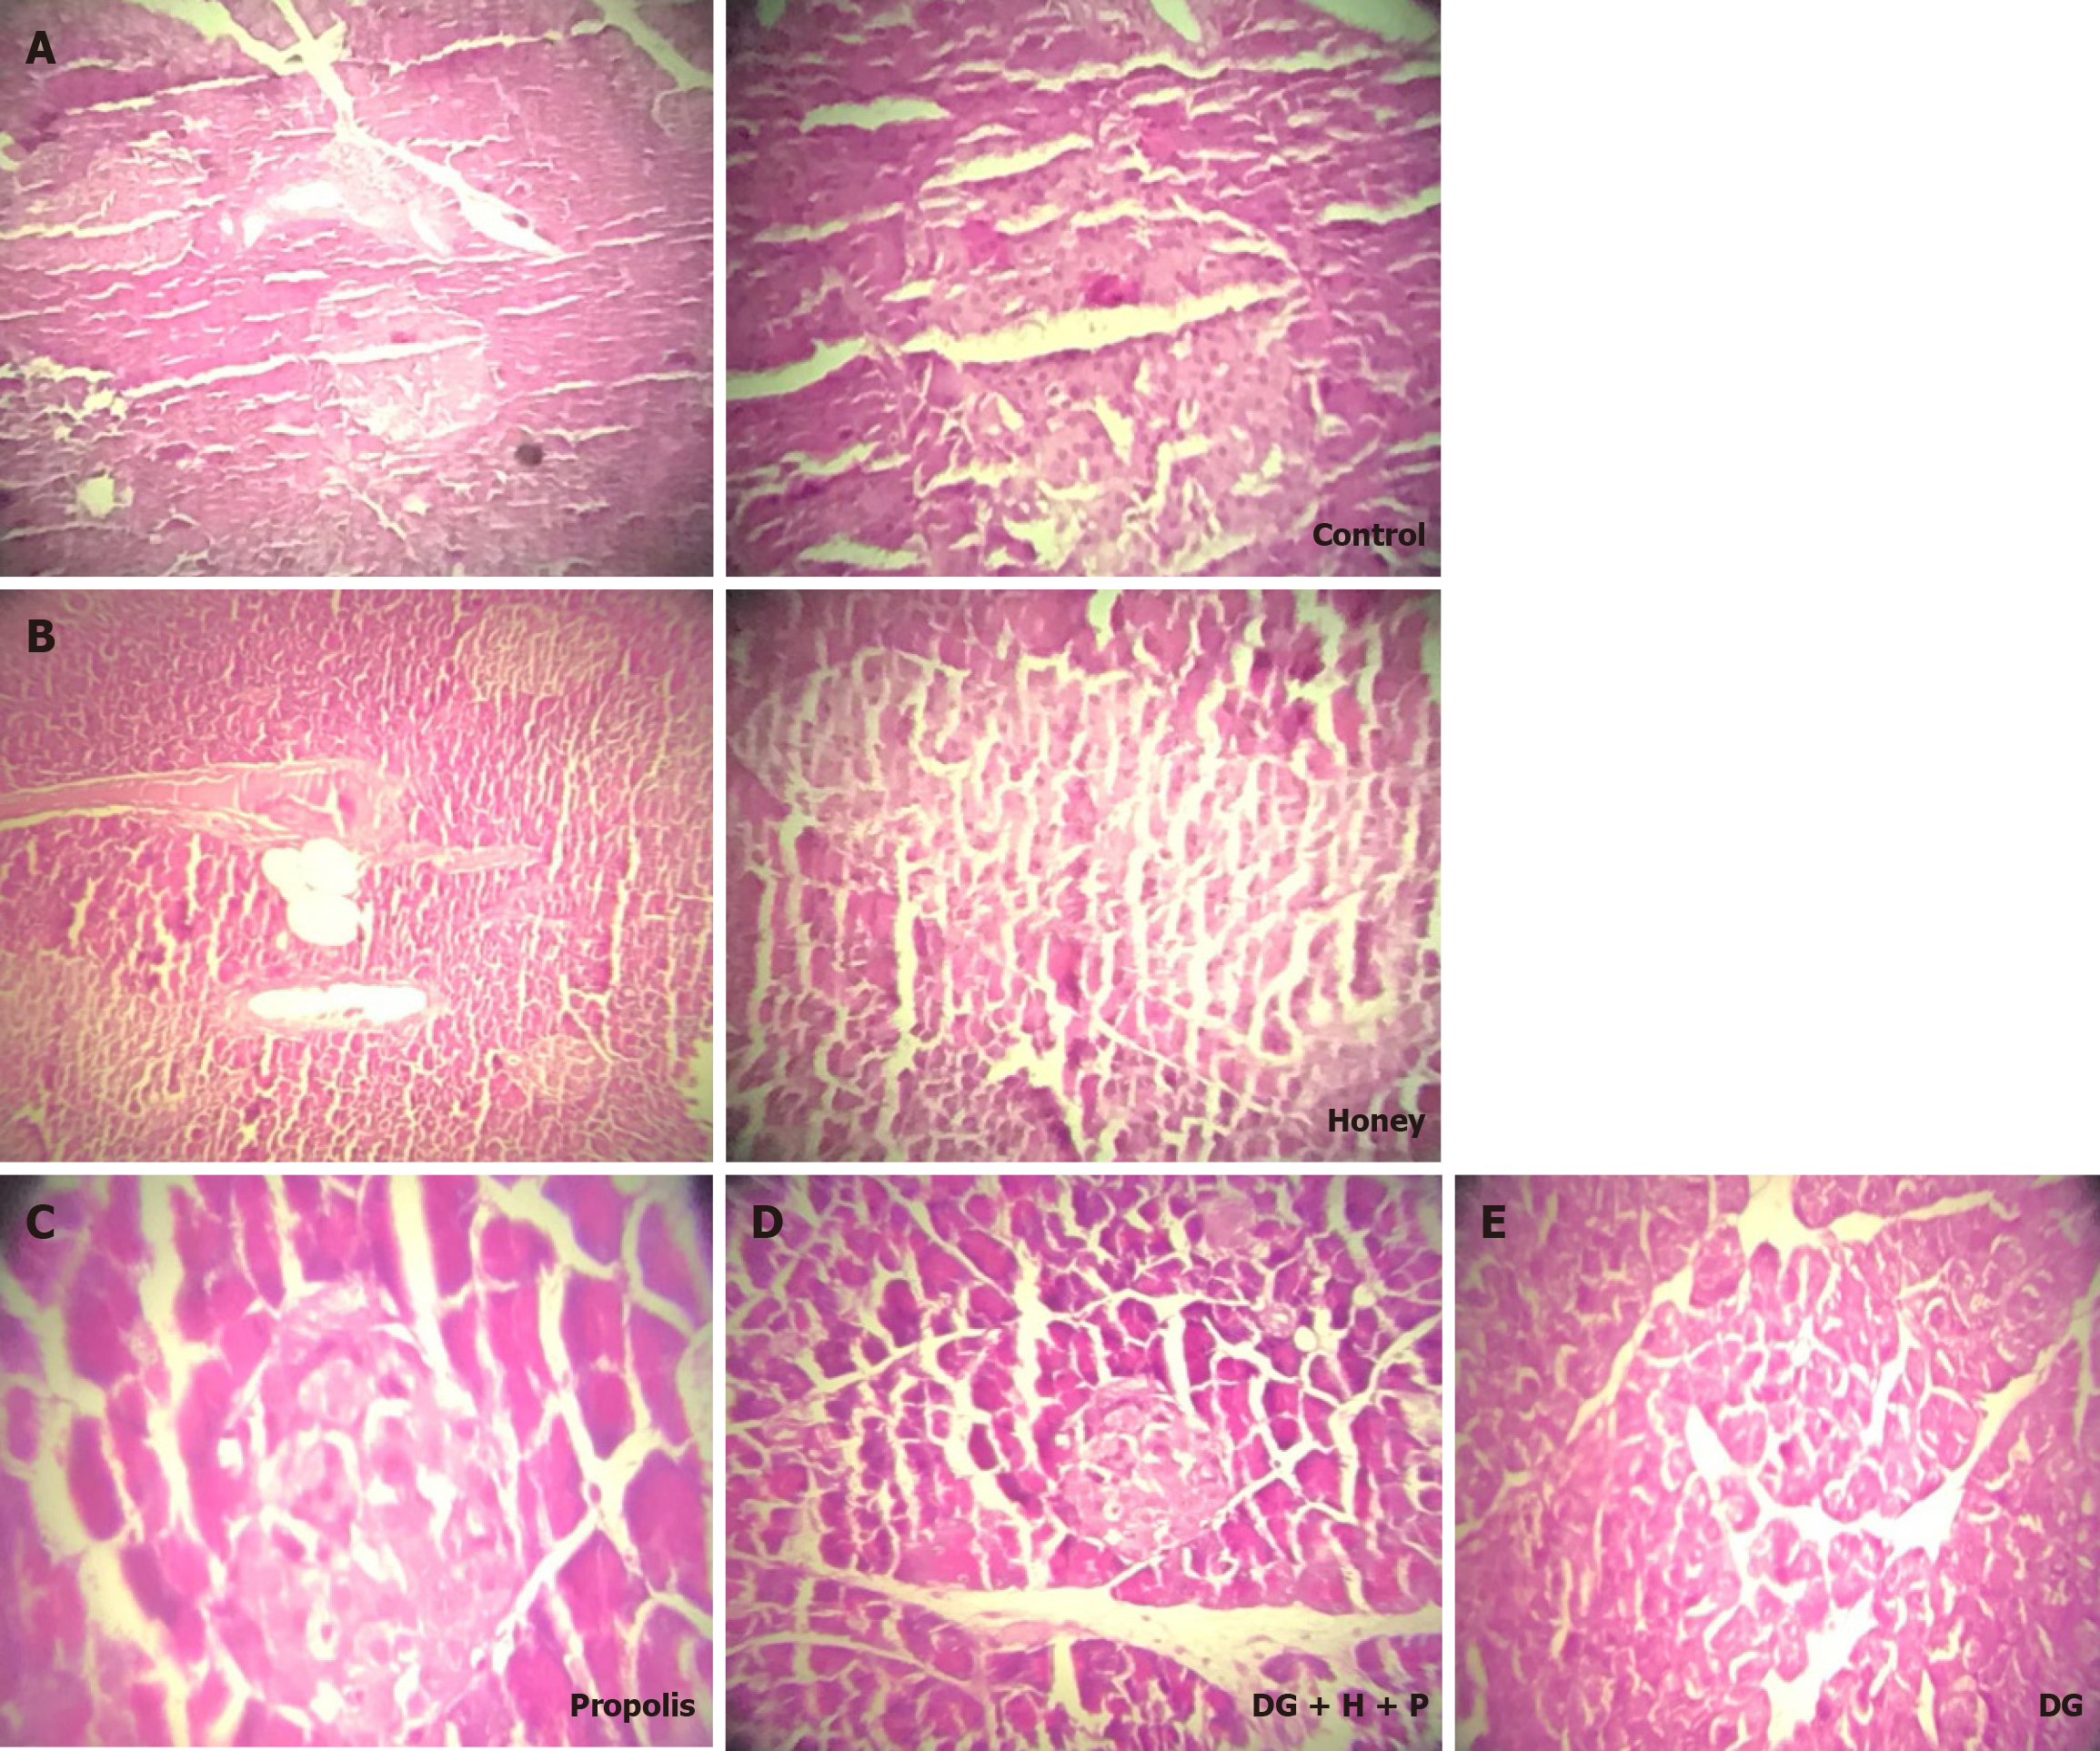
Figure 3 Histopathological changes in pancreatic tissues after D-glucose administration with and without honey, propolis, and their combination.
A: Control, many islets of Langerhans and of Langerhans rich in cells (250c/islet); B: Honey, many islets of Langerhans and of Langerhans rich in cells (150c/islet); C: Propolis, few islets of Langerhans and of Langerhans rich in cells (50c/islet).; D: D-glucose + honey + propolis, few islets of Langerhans and of Langerhans rich in cells (50c/ islet); E: D-glucose, absence islets of Langerhans. DG: D-glucose; H: Honey; P: Propolis.
- Citation: Touzani S, Al-Waili N, Laaroussi H, Aboulghazi A, Hamas N, Imtara H, El Ghouizi A, ElArabi I, Al-Waili A, Lyoussi B. Effect of propolis and honey in hyperglycemia-induced kidney and liver injuries, proteinuria, and oxidant and antioxidant parameters. World J Exp Med 2025; 15(3): 99330
- URL: https://www.wjgnet.com/2220-315X/full/v15/i3/99330.htm
- DOI: https://dx.doi.org/10.5493/wjem.v15.i3.99330


