Copyright
©2013 Baishideng Publishing Group Co.
World J Crit Care Med. Nov 4, 2013; 2(4): 48-55
Published online Nov 4, 2013. doi: 10.5492/wjccm.v2.i4.48
Published online Nov 4, 2013. doi: 10.5492/wjccm.v2.i4.48
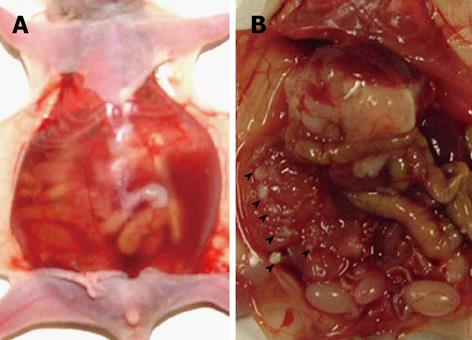
Figure 1 Peritoneal dissemination model.
A: Bloody ascites was recognized in the peritoneal cavity of the peritoneal dissemination model, using the MKN-45P cell line; B: Numerous tumor nodules (arrowheads) were recognized on the mesentery.
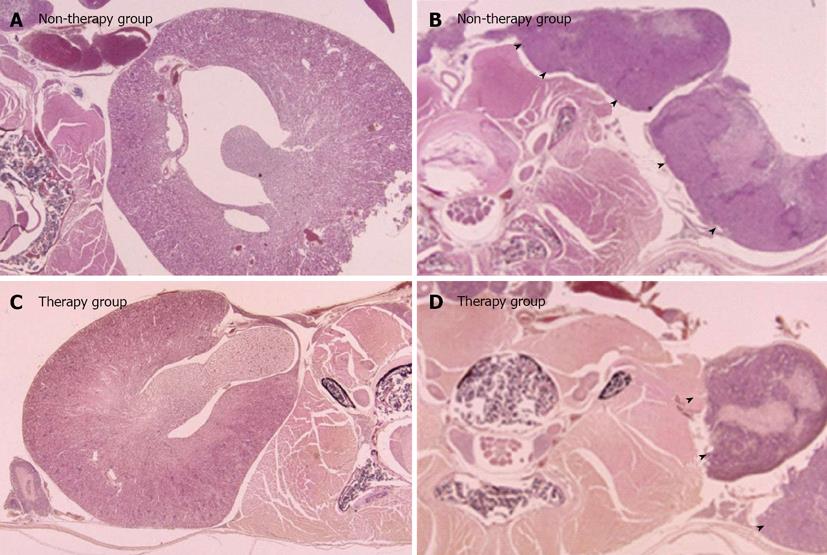
Figure 2 Macroscopic and histological findings of the retroperitoneal tissue.
A: Hydronephrosis in the left kidney in the non-therapy group (HE, × 40); B: A large amount of tumor tissues (arrowheads) was recognized on the retroperitoneum in the non-therapy group (HE, × 40); C: Mild hydronephrosis in the right kidney in the therapy group (HE, × 40); D: A small amount of tumor tissues (arrowheads) was recognized on the retroperitoneum in the therapy group (HE, × 40). HE staining, with low magnification, on the cut surface of retroperitoneal tissues in the non-therapy group and the therapy group.
Figure 3 High magnification of tumor tissue.
High magnification revealed tumor tissue in both the non-therapy group (A) and in the therapy (B) group. The number of mitoses (arrowheads) in the non-therapy group was larger than that in the therapy group (HE, × 400).
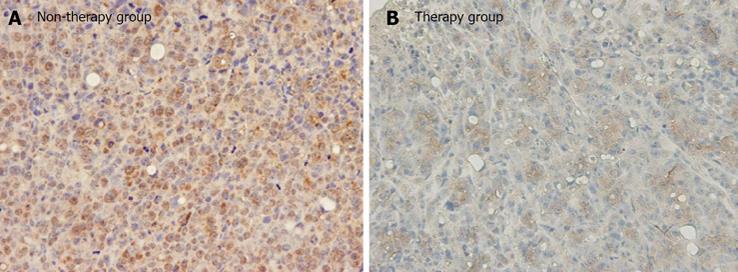
Figure 4 Immunohistochemical staining of tumor tissue.
Immunoreactivity for vascular endothelial growth factor (VEGF) was mainly identified as supranuclear staining or diffused staining in the cytoplasm of cancer cells. A: All 5 mice in the non-therapy group according to the percentage of positive tumor staining were in category 3, with 50% or more cells stained (VEGF, × 200); B: All 5 mice in the therapy group were in category 2, with 30 to 49% stained (VEGF, × 200).
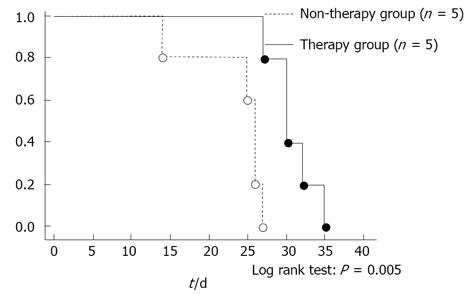
Figure 5 Survival curves.
Survival curves of the bevacizumab-treated (n = 5), and untreated mice (n = 5). The mean survival duration of the treated mice was 30.8 d and of the untreated mice was 23.6 d (P = 0.005).
- Citation: Aoyagi K, Kouhuji K, Miyagi M, Kizaki J, Isobe T, Hashimoto K, Shirouzu K. Molecular targeting therapy using bevacizumab for peritoneal metastasis from gastric cancer. World J Crit Care Med 2013; 2(4): 48-55
- URL: https://www.wjgnet.com/2220-3141/full/v2/i4/48.htm
- DOI: https://dx.doi.org/10.5492/wjccm.v2.i4.48


