
















Copyright: ©Author(s) 2026.
World J Crit Care Med. Sep 9, 2026; 15(3): 120702
Published online Sep 9, 2026. doi: 10.5492/wjccm.120702
Published online Sep 9, 2026. doi: 10.5492/wjccm.120702
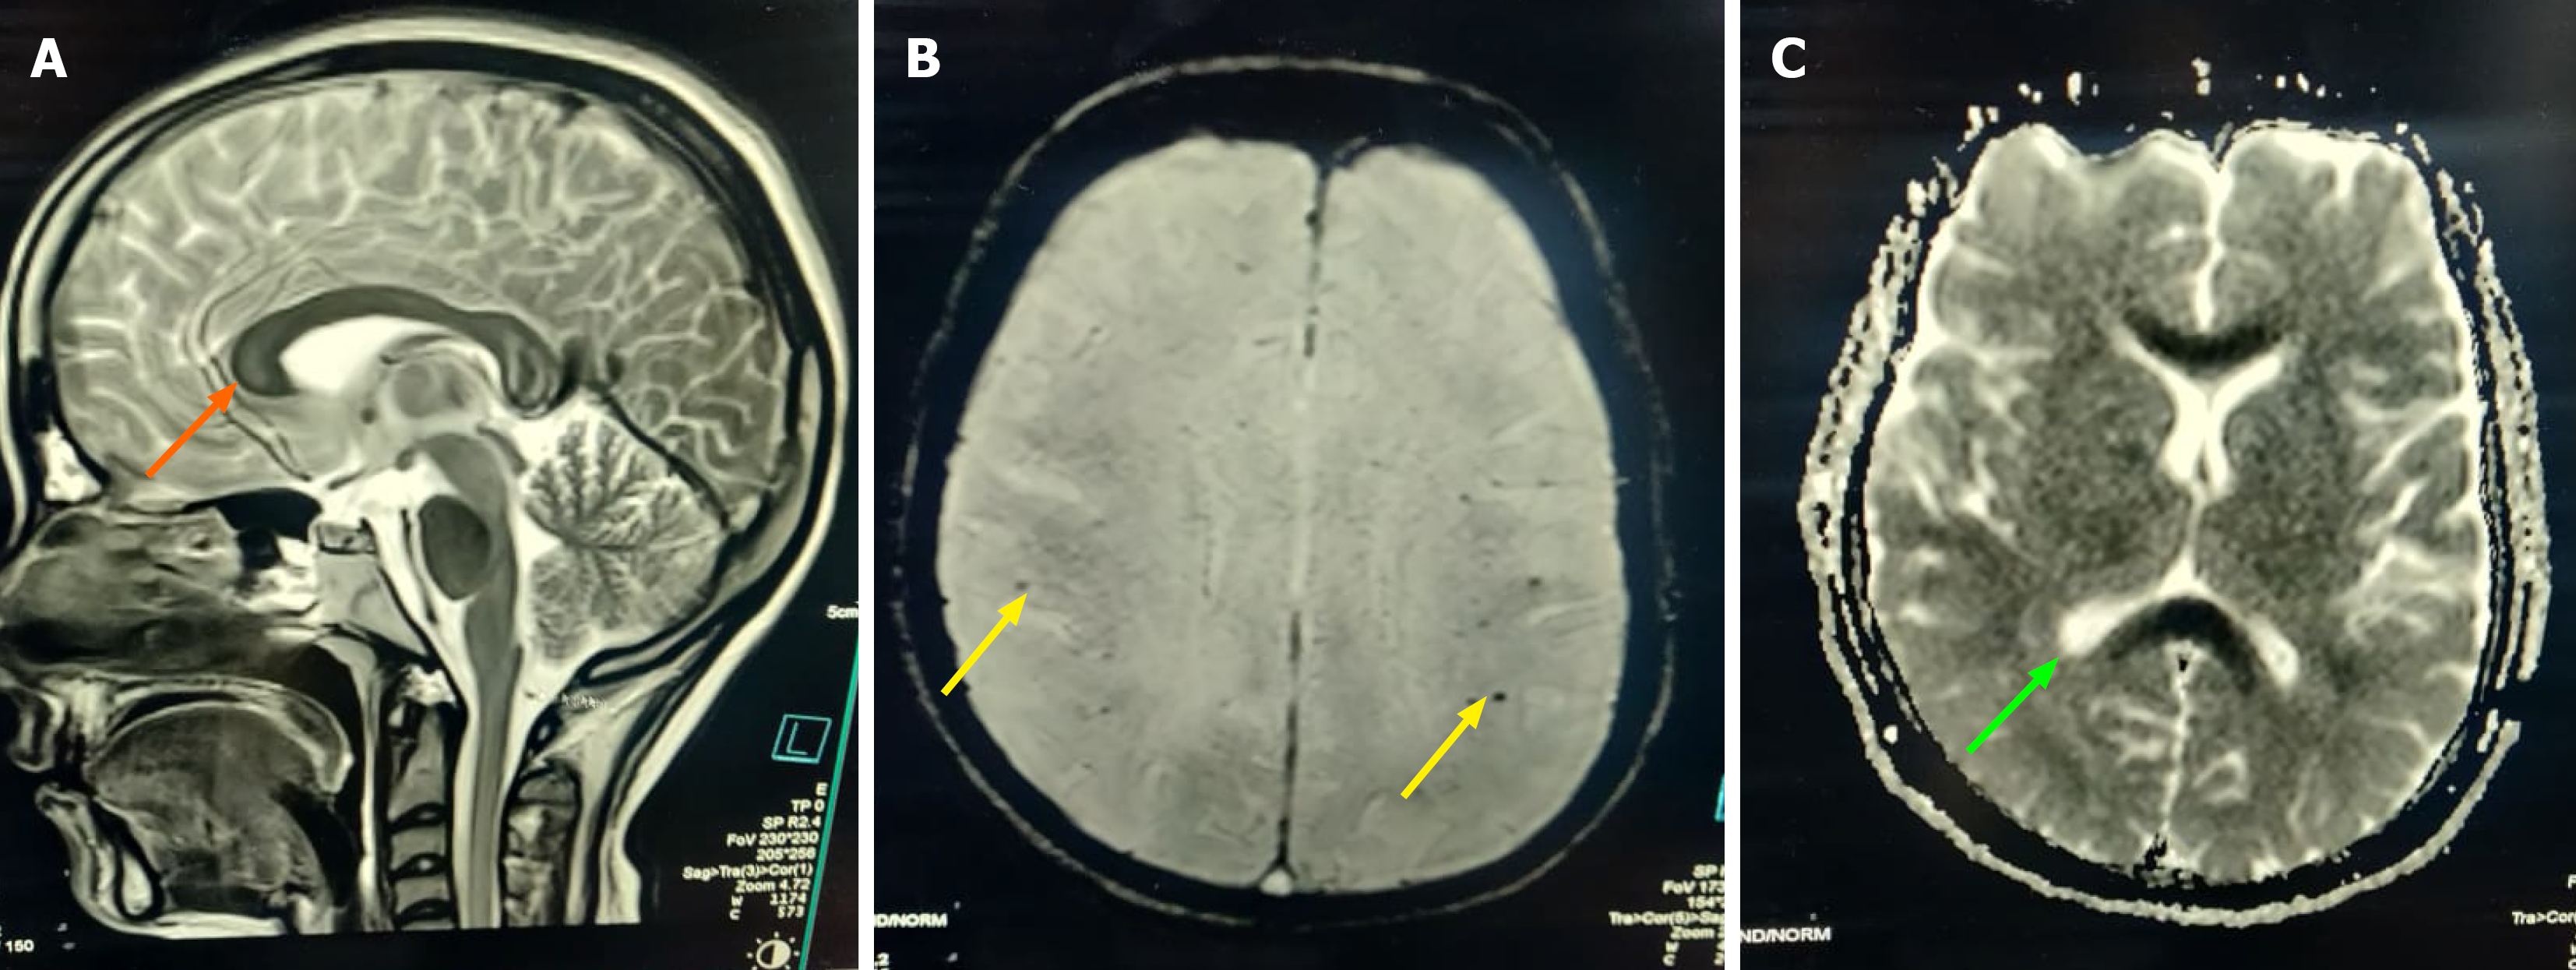
Figure 1 Magnetic resonance imaging findings of nickel-induced toxic encephalopathy.
A: T2/flair hyperintensity in corpus callosum (orange arrow); B: Few small microhemorrhages in bilateral cerebral hemispheres at grey-white matter junction on susceptibility-weighted imaging (yellow arrow); C: Diffusion restriction and apparent diffusion coefficient: Diffusion restriction in splenium (green arrow).
- Citation: Hosur Ravikumar R, Nath S, Quadri JA, Bhattacharjee S. Methylene blue for treating toxic encephalopathy due to acute nickel poisoning: A case report. World J Crit Care Med 2026; 15(3): 120702
- URL: https://www.wjgnet.com/2220-3141/full/v15/i3/120702.htm
- DOI: https://dx.doi.org/10.5492/wjccm.120702