Copyright
©The Author(s) 2024.
World J Crit Care Med. Mar 9, 2024; 13(1): 88540
Published online Mar 9, 2024. doi: 10.5492/wjccm.v13.i1.88540
Published online Mar 9, 2024. doi: 10.5492/wjccm.v13.i1.88540
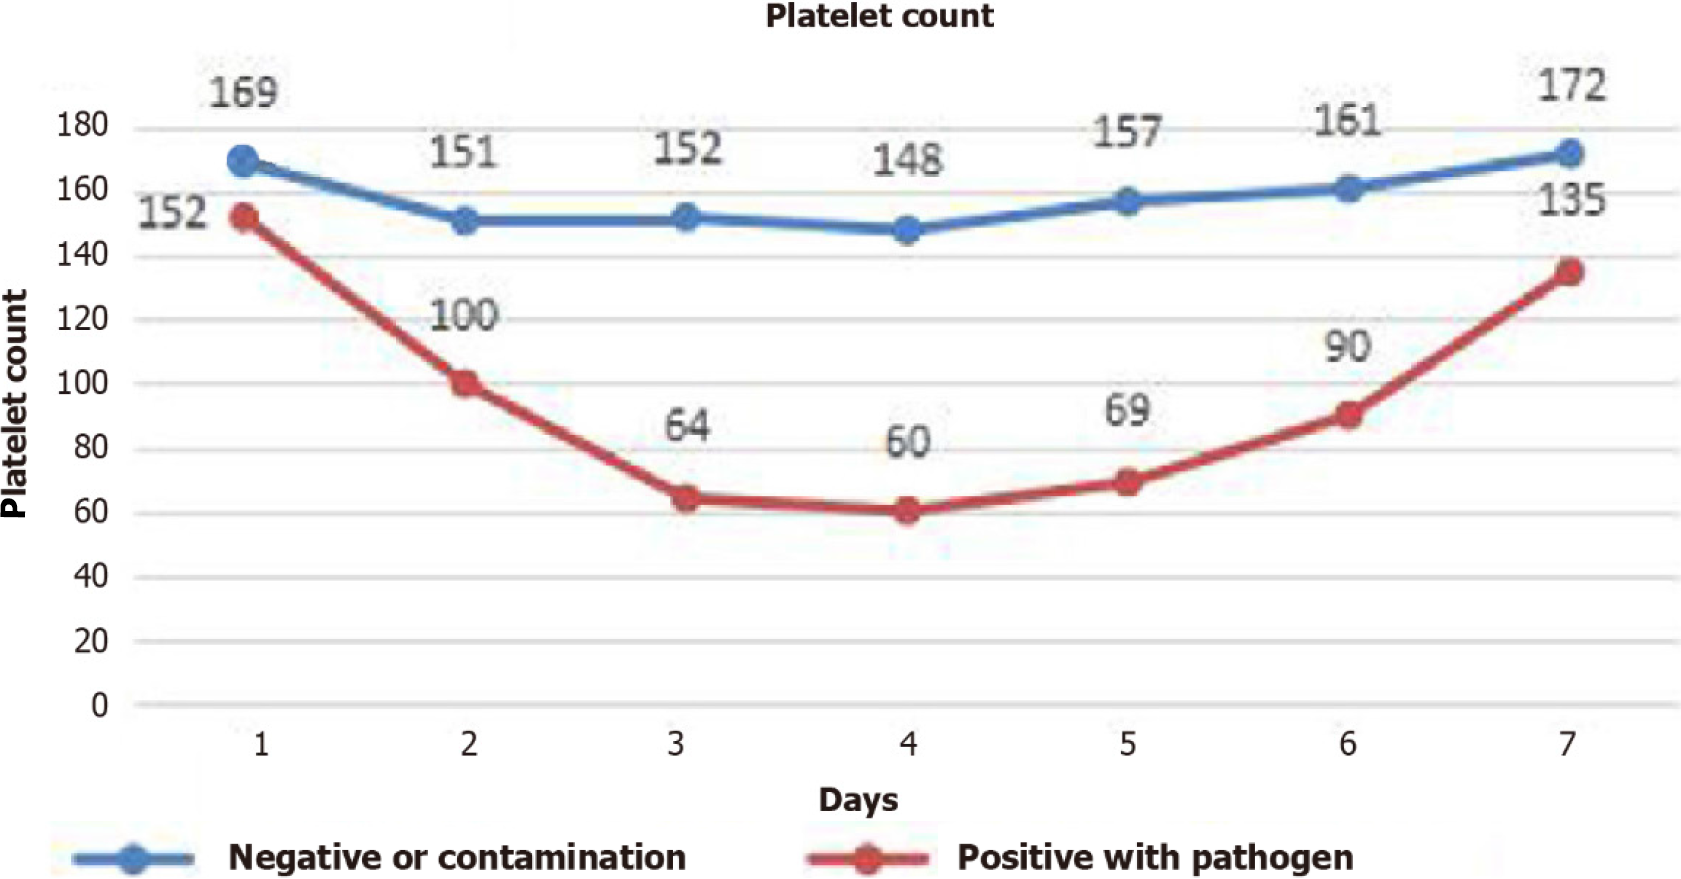
Figure 1 Platelet count over time stratified according to blood culture results.
Data are median (25th, 75th percentile).
Figure 2 Box plot showing the percentage decline of platelet counts and lowest platelet count.
A: Eighty-five bacterial infection episodes showed a higher percentage decline of platelet count (PPC); B: Lower levels of platelet count than nonbacterial events (P < 0.001) by Mann-Whitney U test; C: The PPC was not significantly different in the group with gram-positive bacteraemia, gram-negative bacteraemia, and fungal infection (P > 0.05). Data are presented with median lines, 25- and 75-percentile boxes, and 10- and 90-percentile error bars. PPC: The percentage decline of platelet counts. The (*) and (o) in the figure are Scatter data.
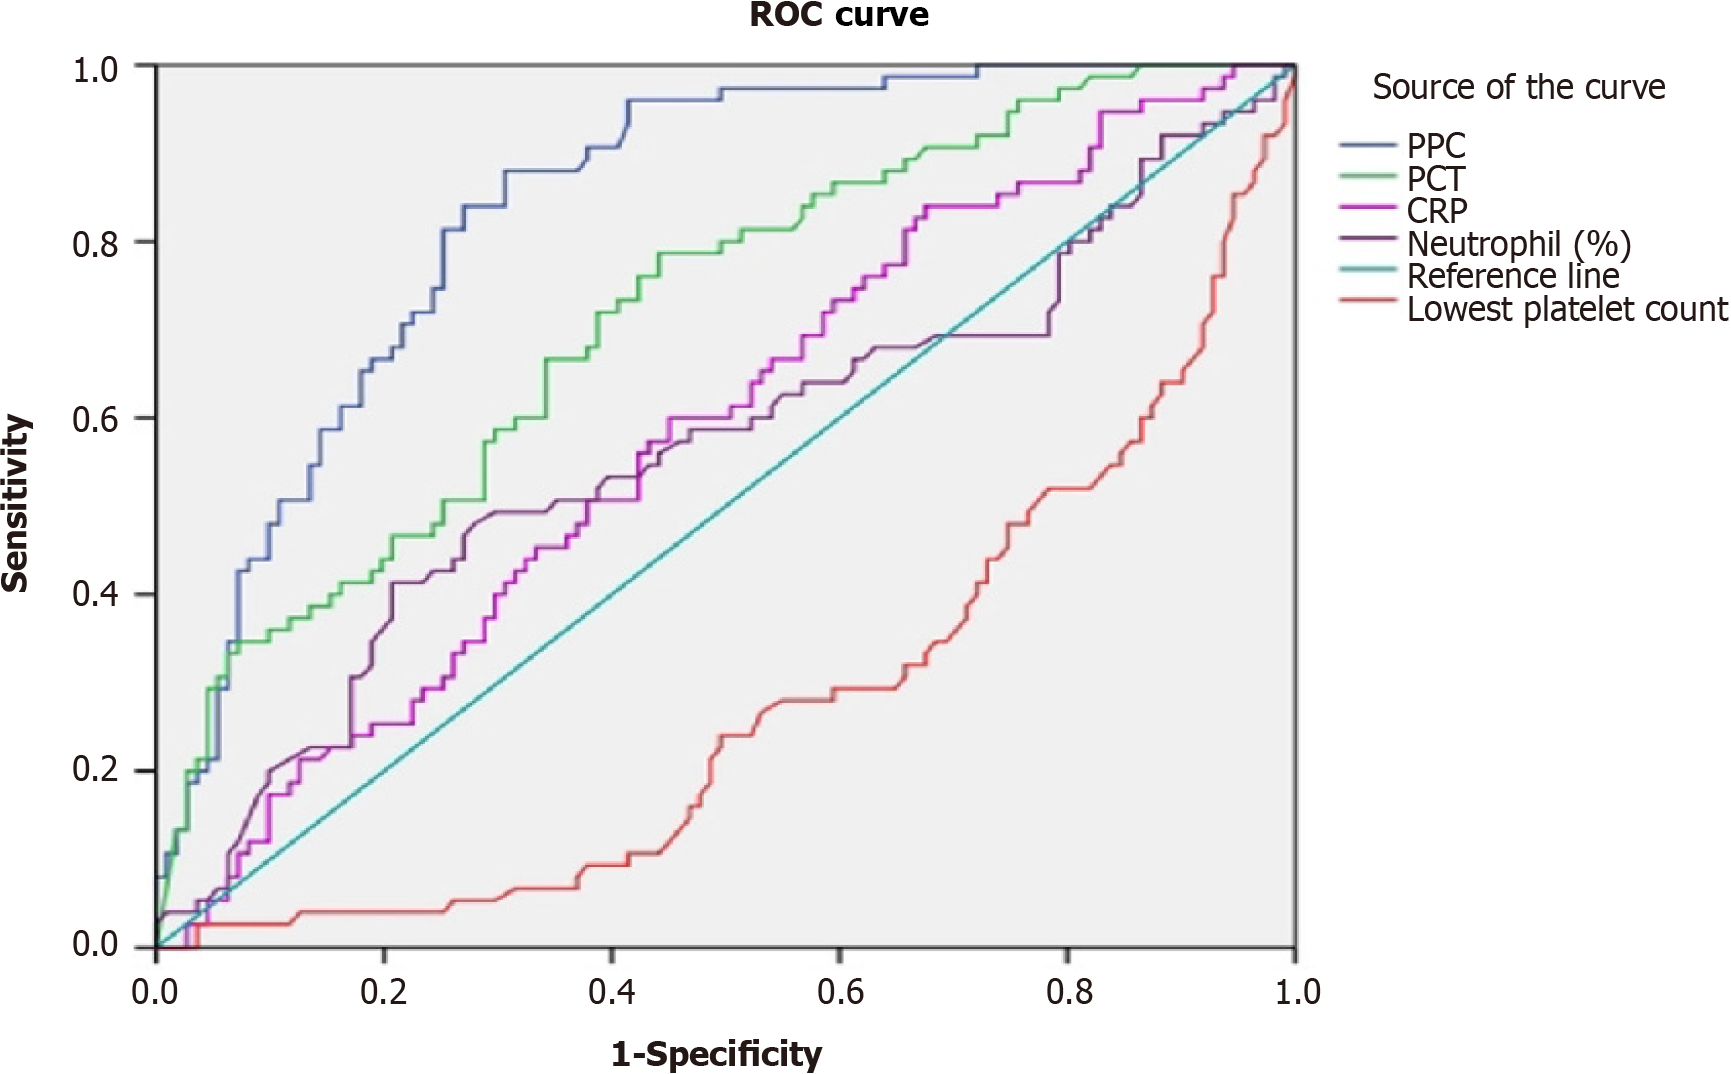
Figure 3 Receiver operating characteristic curves of serum biomarkers for the positive diagnosis of bacterial species in critically ill patients with clinical sepsis and sepsis shock.
ROC: Receiver operating characteristic; PCT: Procalcitonin; CRP: C-reactive protein.
- Citation: Li X, Wang S, Ma J, Bai SG, Fu SZ. Predictive value of thrombocytopenia for bloodstream infection in patients with sepsis and septic shock. World J Crit Care Med 2024; 13(1): 88540
- URL: https://www.wjgnet.com/2220-3141/full/v13/i1/88540.htm
- DOI: https://dx.doi.org/10.5492/wjccm.v13.i1.88540


