Copyright
©The Author(s) 2021.
World J Crit Care Med. Sep 9, 2021; 10(5): 204-219
Published online Sep 9, 2021. doi: 10.5492/wjccm.v10.i5.204
Published online Sep 9, 2021. doi: 10.5492/wjccm.v10.i5.204
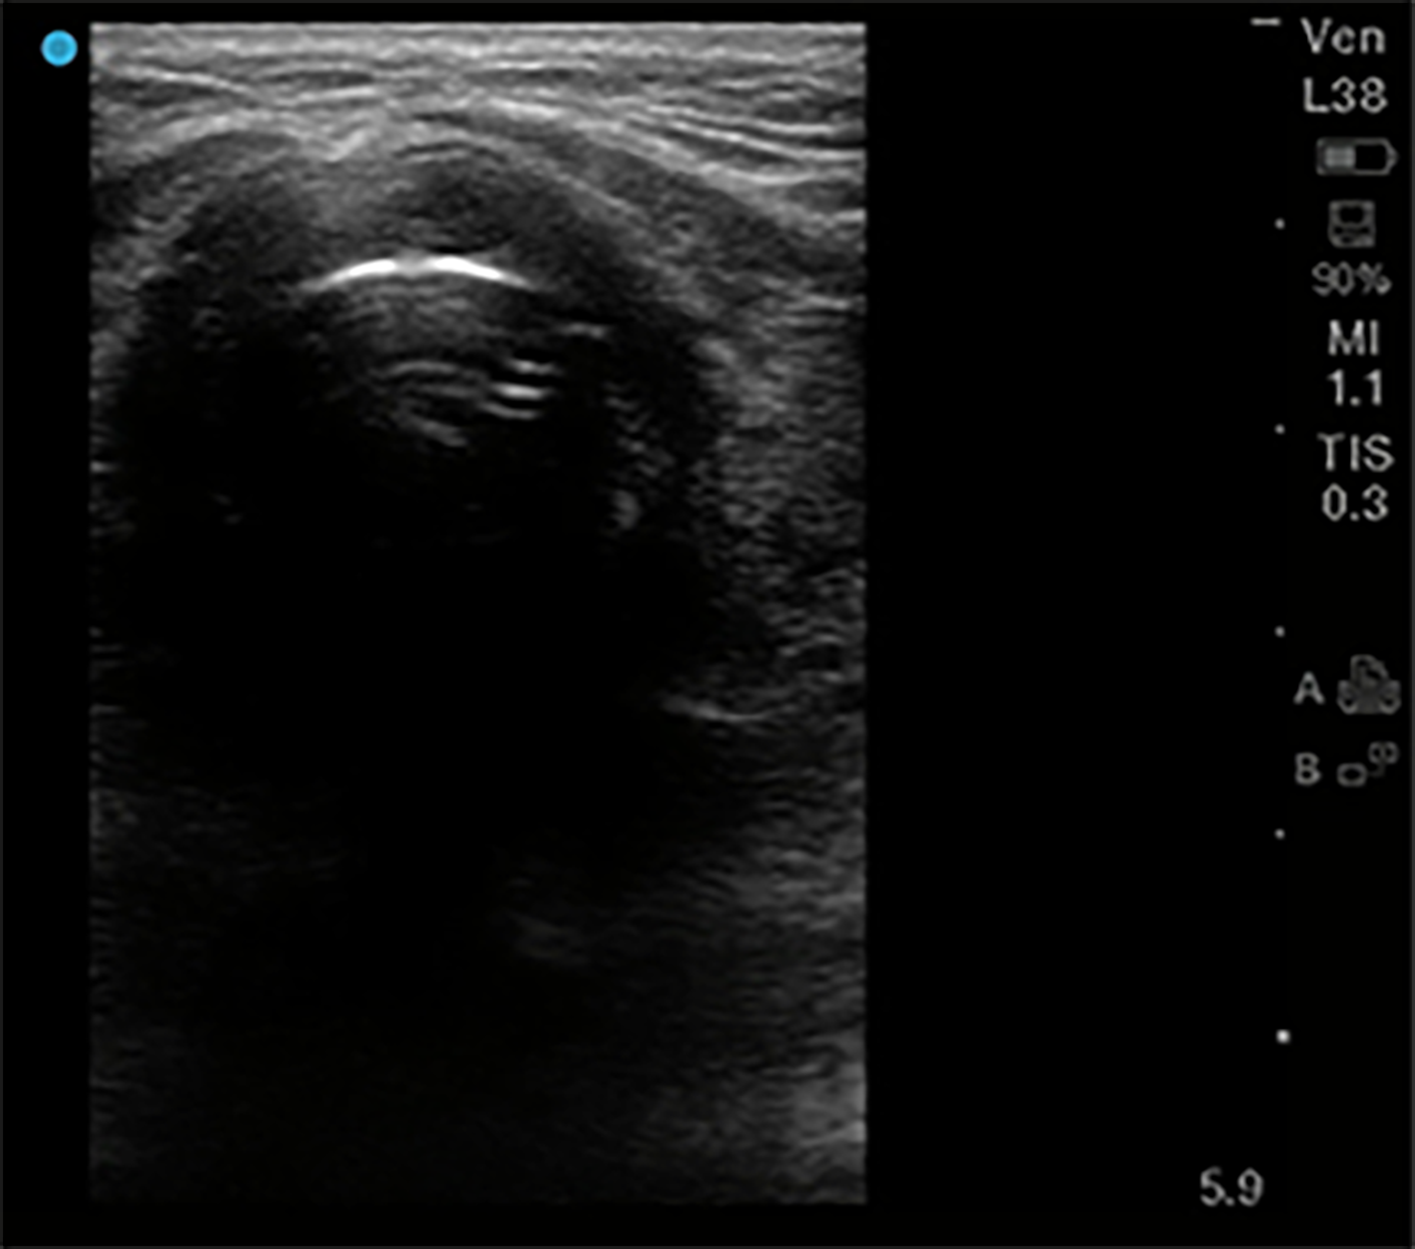
Figure 1 Endotracheal intubation.
High frequency 5-10 MHz linear probe with probe marker facing toward patients’ right side, placed at base of neck midline just superior to suprasternal notch. “Bullet sign” of proper endotracheal intubation seen here, with hyperechoic air-mucosal interface and posterior shadowing.
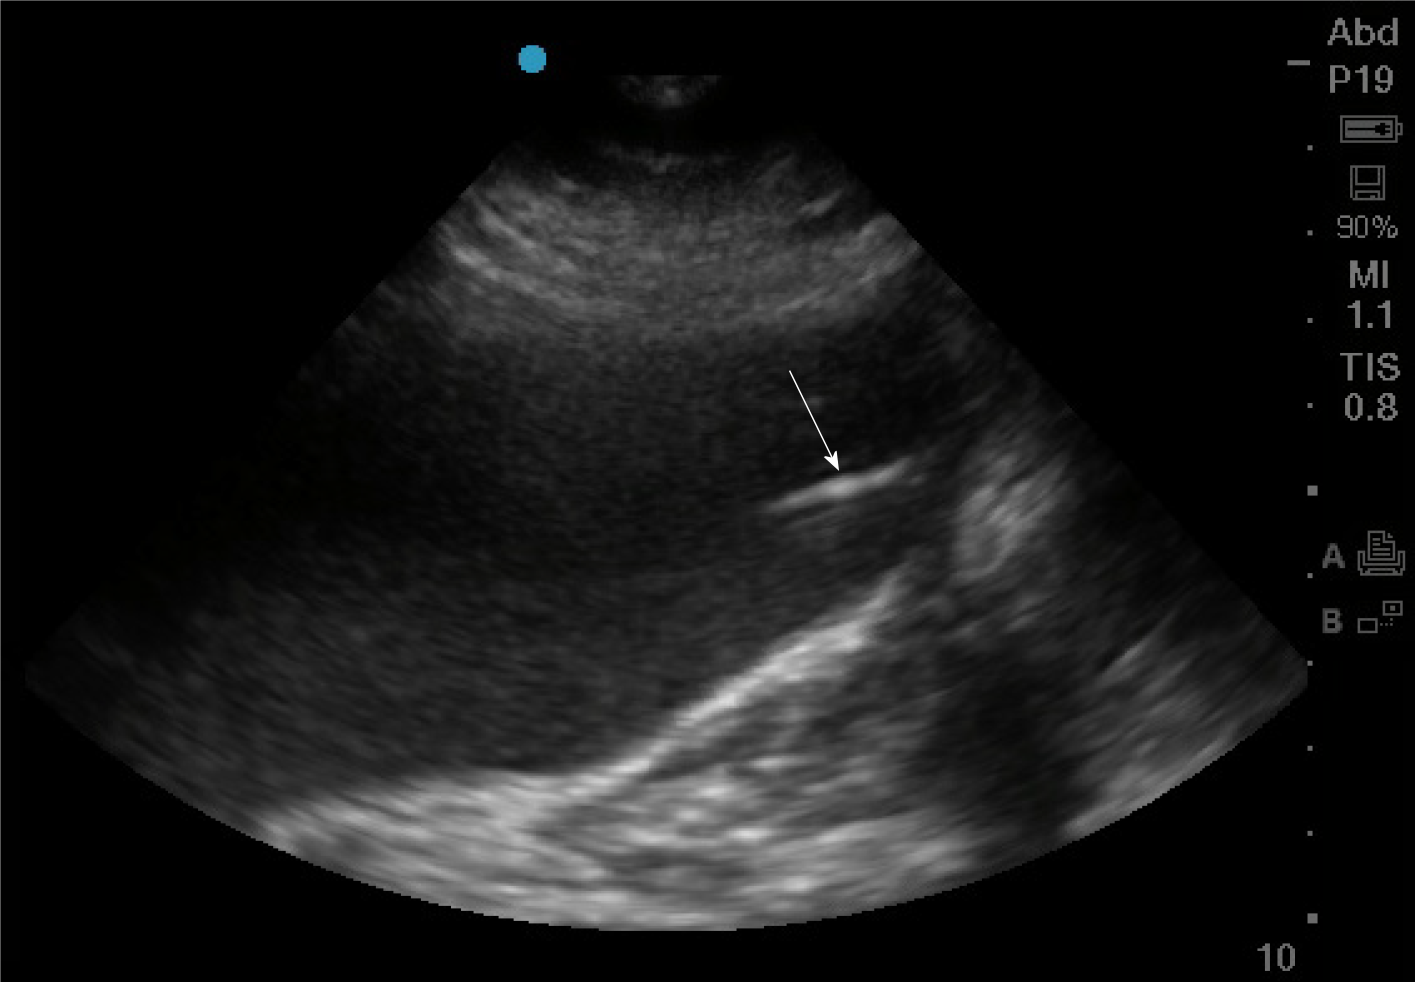
Figure 2 Gastric enteral tube placement.
Phased array probe (1-5 MHz) in “Abdominal” preset with probe marker facing cephalad placed in left mid-clavicular subcostal location. The stomach here is distended with hypoechoic fluid, and inside it can be seen a linear hyperechoic density representing the gastric enteral tube (arrow).
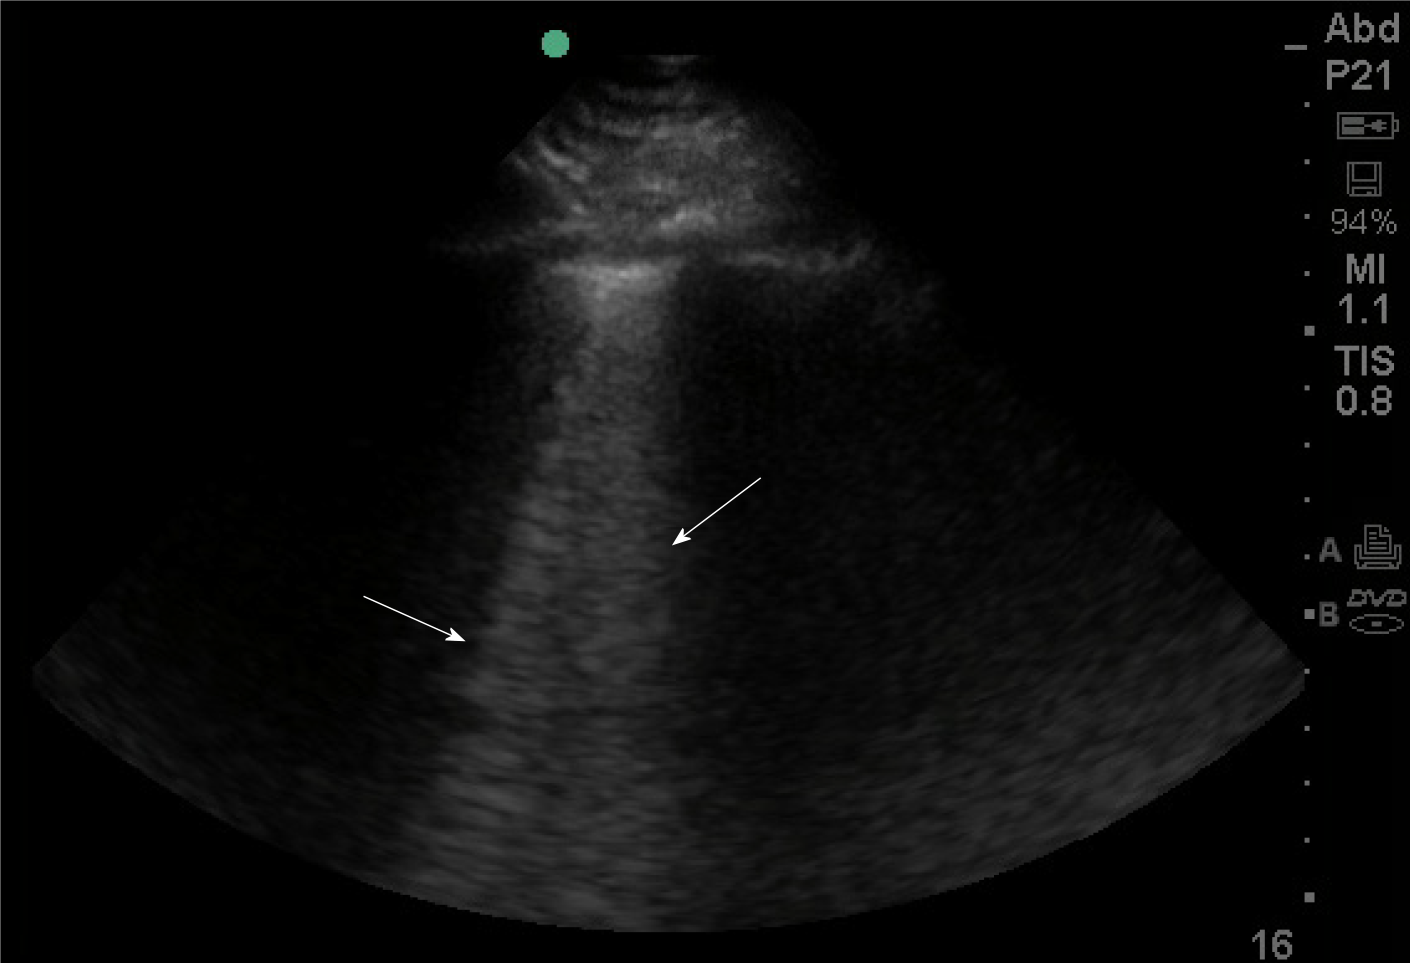
Figure 3 B-lines on lung ultrasound.
Phased array probe (1-5 MHz) with probe marker facing cephalad placed in an intercostal space. B lines (denoted by arrows), are well-defined comet-tail, vertical hyperechoic artifacts arising from the pleural line that obliterate normal A-lines, and descend to the bottom of the screen. Multiple B-lines in an interspace indicates an interstitial syndrome, where there are increased air-fluid interfaces creating this artifact.
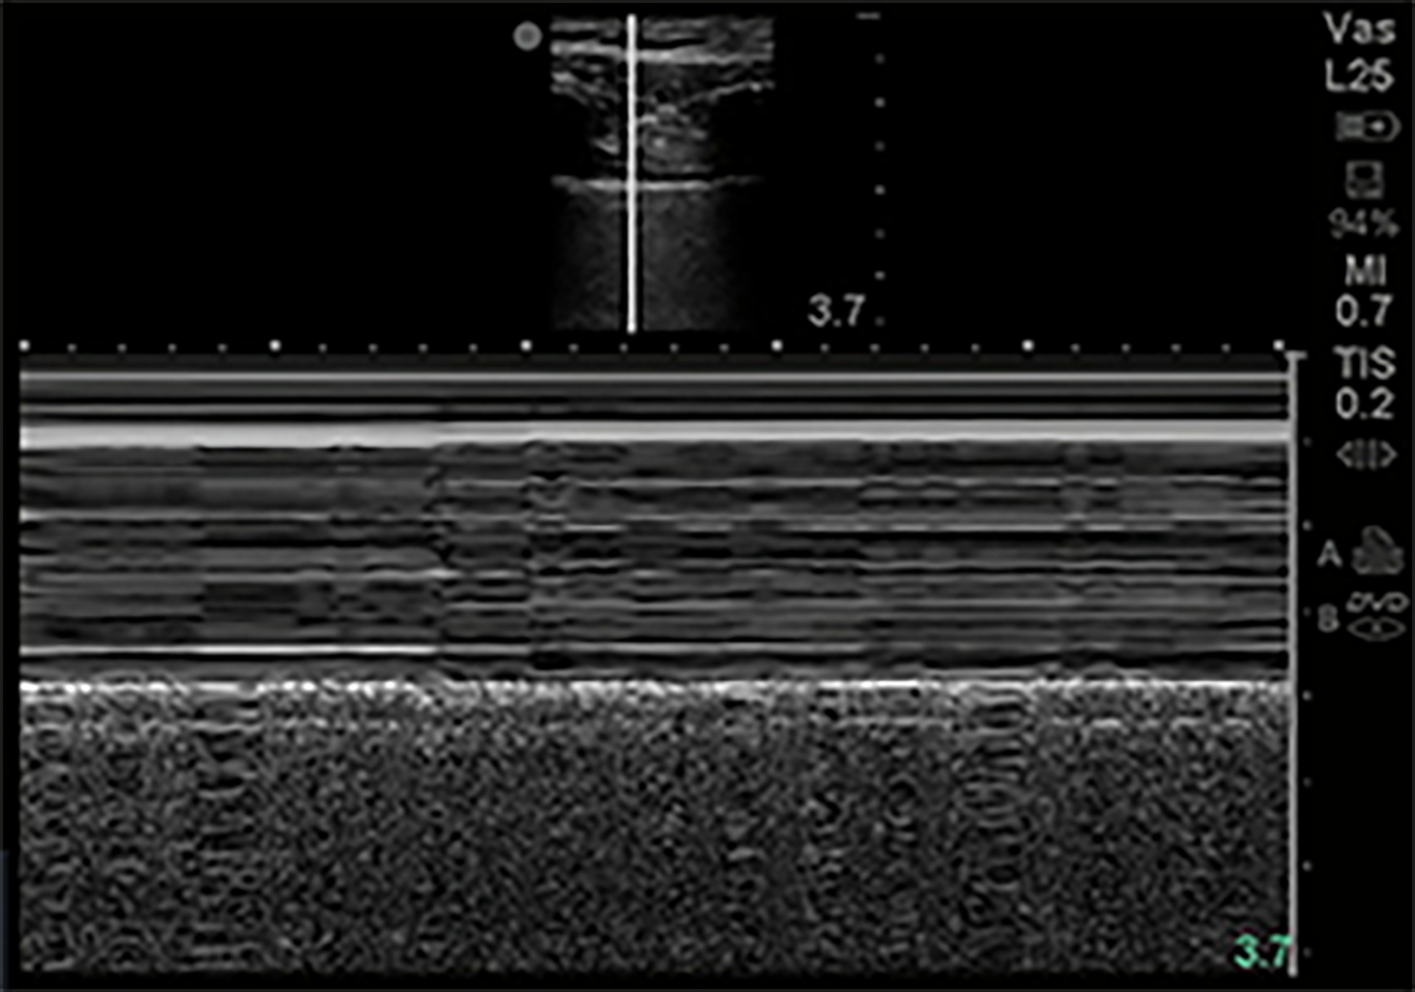
Figure 4 M-Mode normal lung.
M-mode of normal lung demonstrates linear shadows from soft tissue followed by granular deeper shadows commonly described as “Sandy-beach sign”.
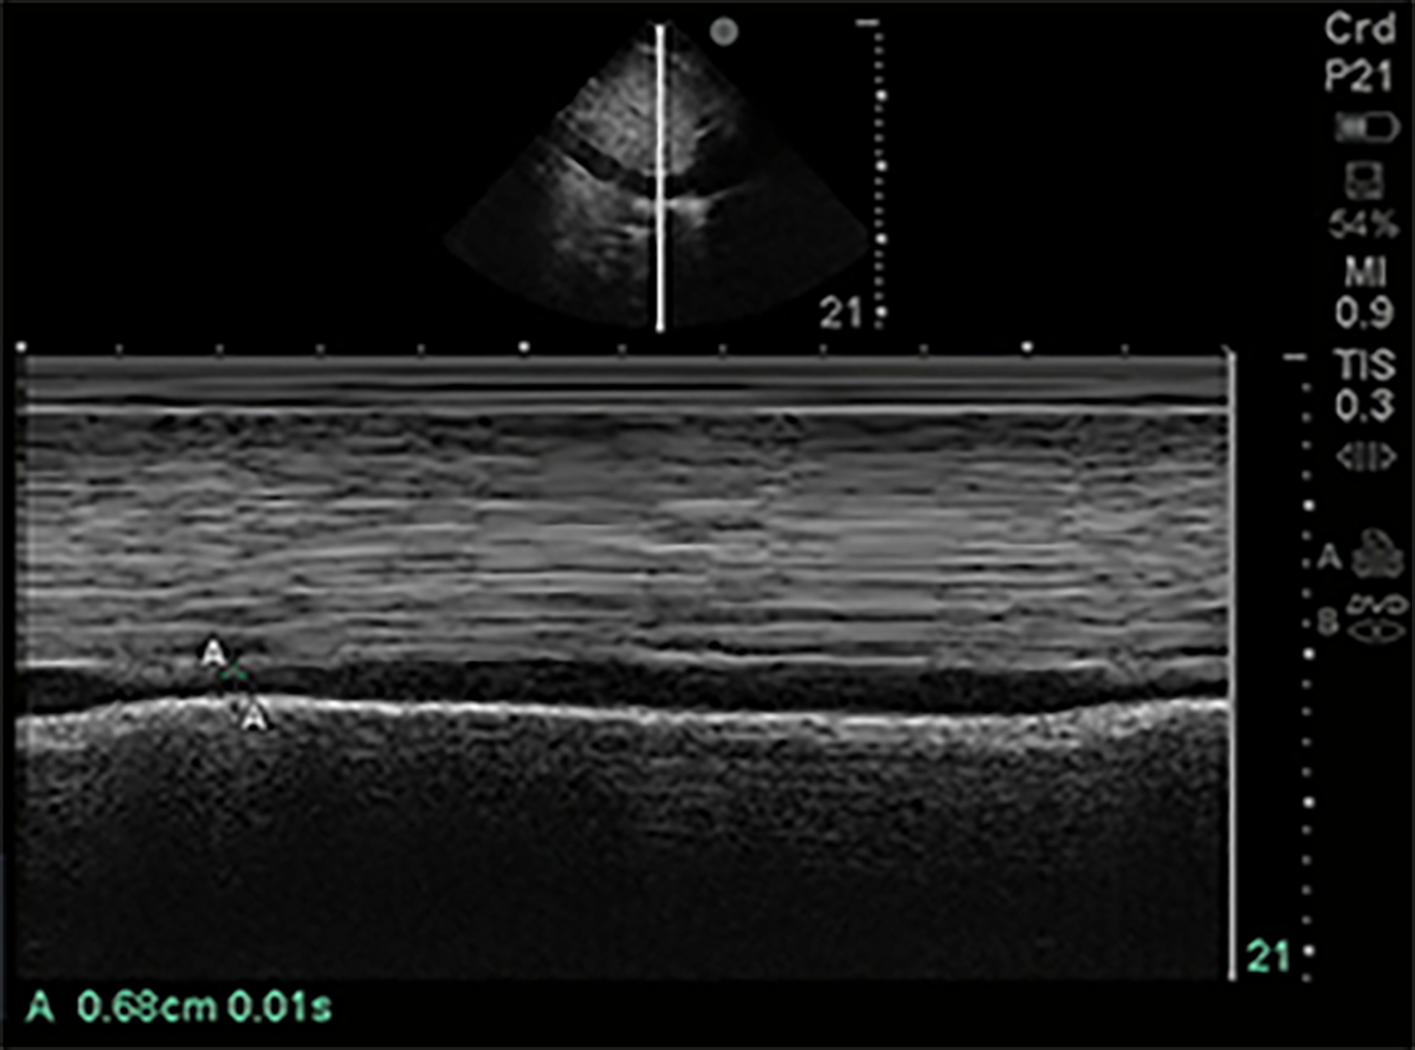
Figure 5 Inferior vena cava size in M-mode.
Of 1-5 MHz phased array probe with probe marker facing cephalad, subcostal location, inferior vena cava (IVC) visualized in sagittal plane. M-mode line centered on IVC just inferior to hepatic vein inflow. IVC measured in this M-mode image at 1.70 cm maximally and 0.68 cm minimally.
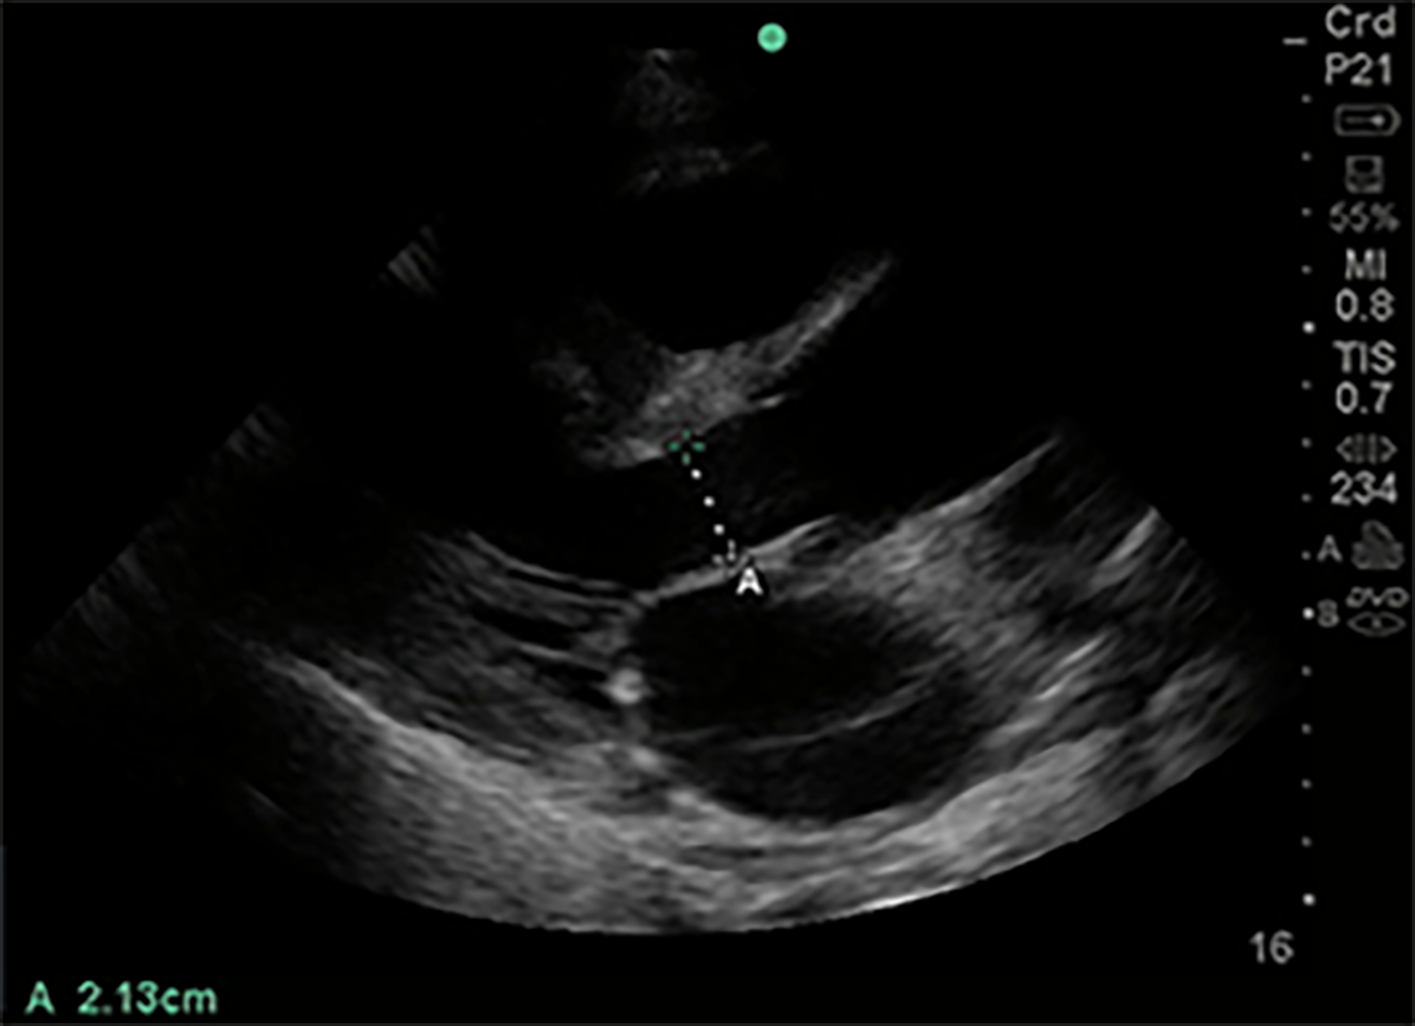
Figure 6 Left ventricular outflow tract diameter parasternal long axis view.
Of 1-5 MHz phased array probe with probe marker facing patient’s right shoulder, parasternal long axis view. Left ventricular outflow tract diameter measured during mid-systole, inner edge to inner edge, from septal endocardium to anterior mitral leaflet, in order to calculate cross-sectional area (πr2).
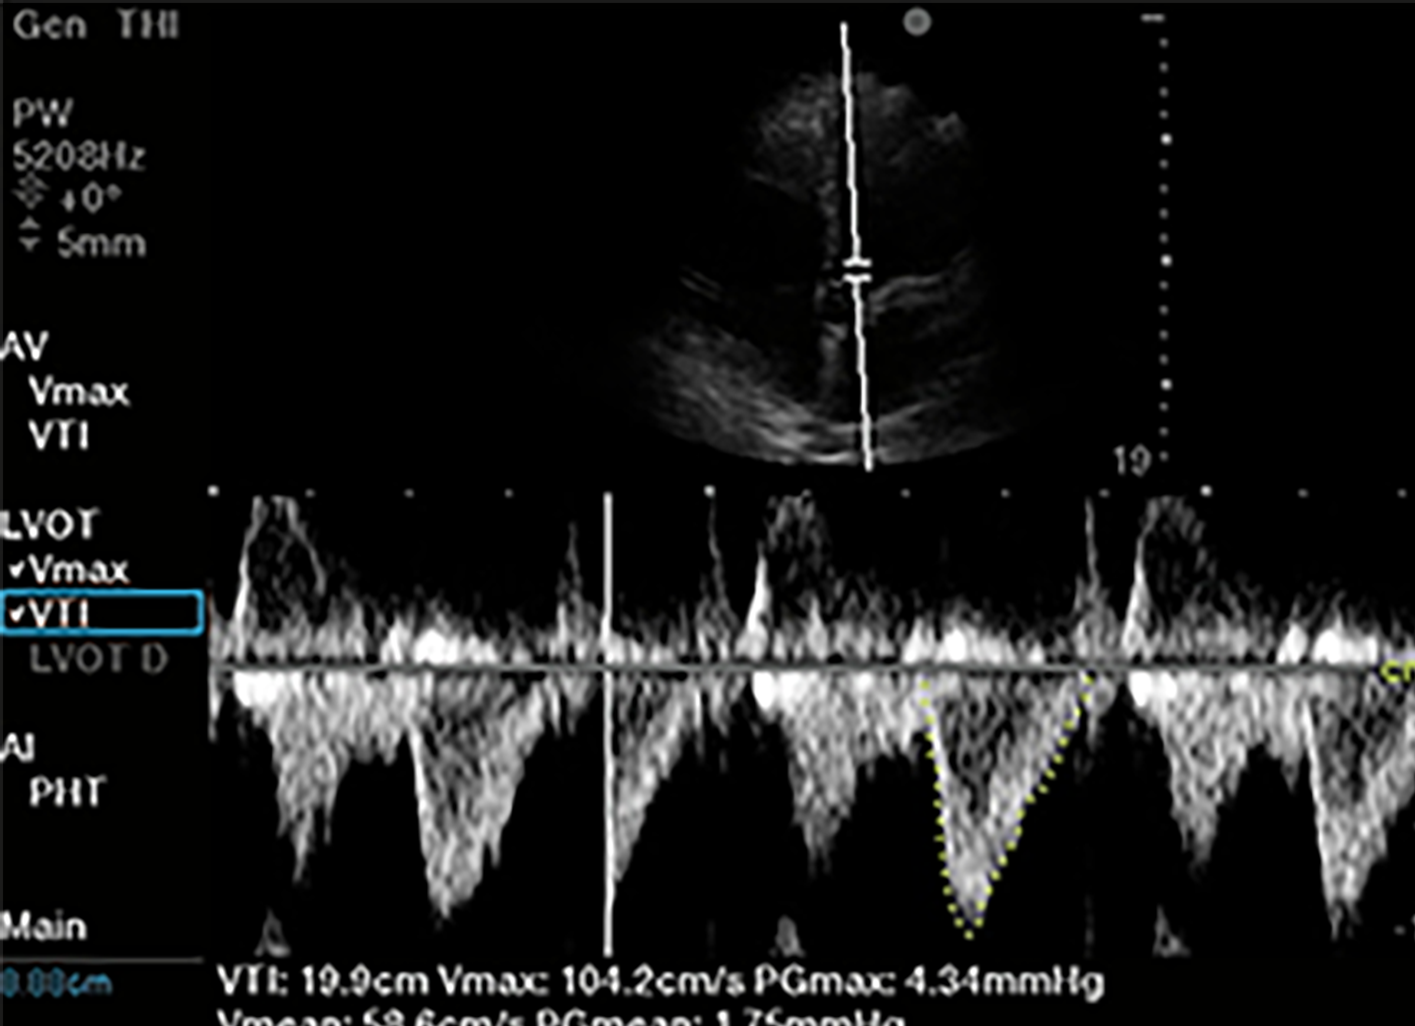
Figure 7 Left ventricular outflow tract velocity time integral.
Of 1-5 MHz phased array probe, apical 5 chamber view. Pulsed wave doppler selected, with sample volume placed 5 mm proximal to aortic valve in center of the left ventricular outflow tract. Notice narrow signal with rapid upstroke in velocities, with end-systolic click terminating flow signal. In this case traced velocity time integral was 19.9 cm.
Figure 8 Formula to calculate stroke volume and cardiac output using pulsed wave doppler.
LVOT: Left ventricular outflow tract; VTI: Velocity time integral.
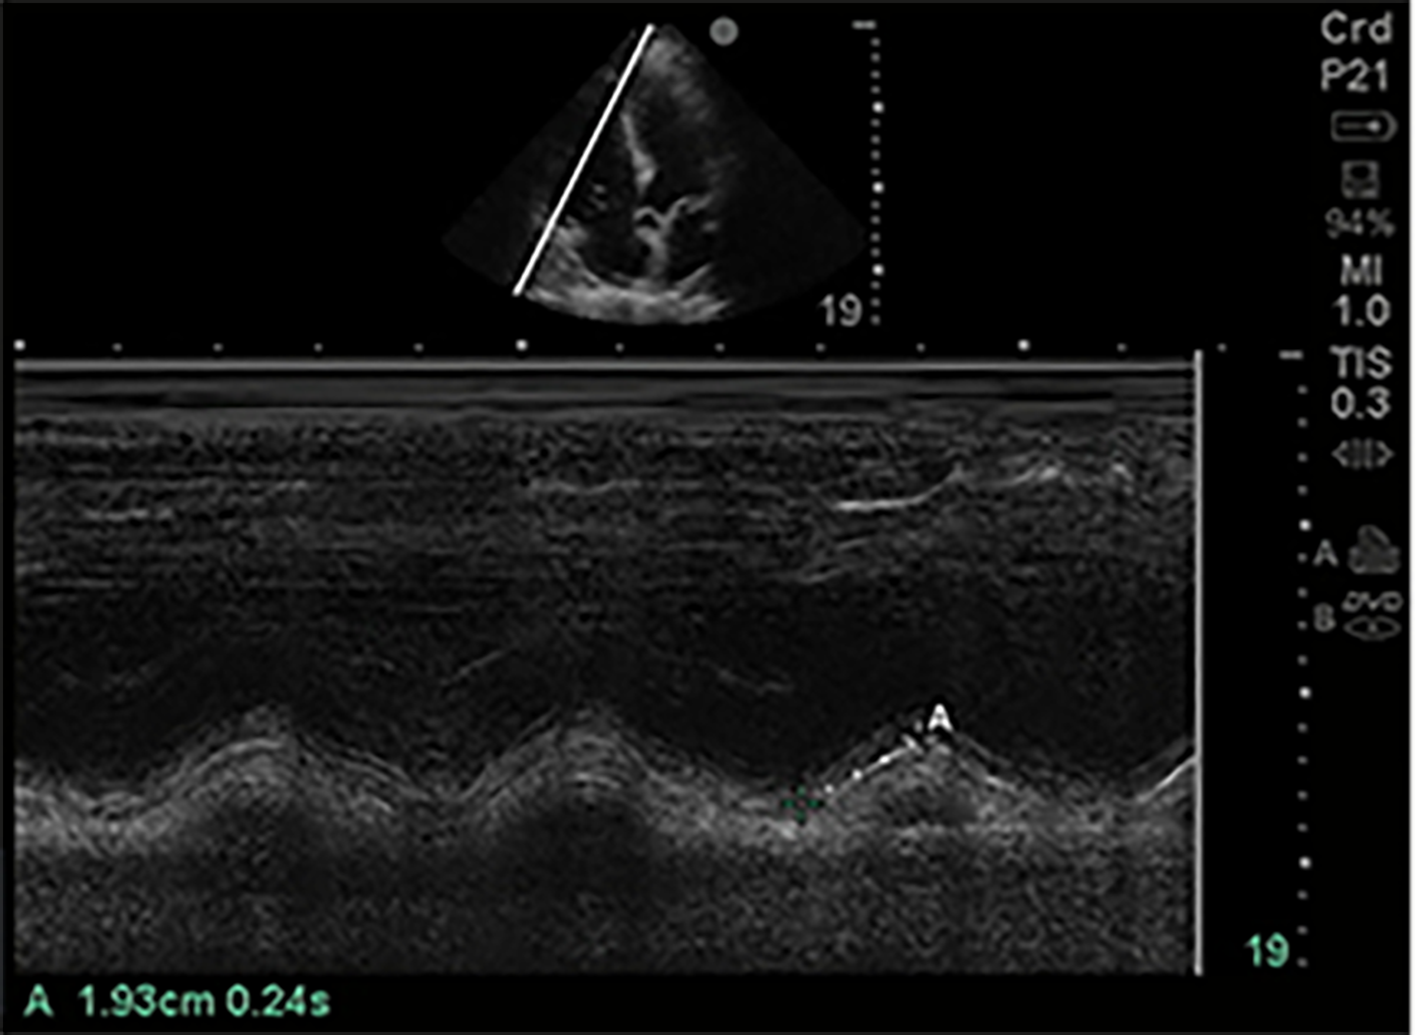
Figure 9 Tricuspid annular planar systolic excursion (tricuspid annular plane systolic excursion).
Phased array probe (1-5 MHz) in “Cardiac” preset, placed in apical 4 chamber view. M-mode line is placed across the lateral tricuspid annulus to assess longitudinal contraction of the right ventricle (RV) free wall, a regional surrogate for RV function. The tricuspid annular planar systolic excursion of this patient was 1.93 cm which is low normal.
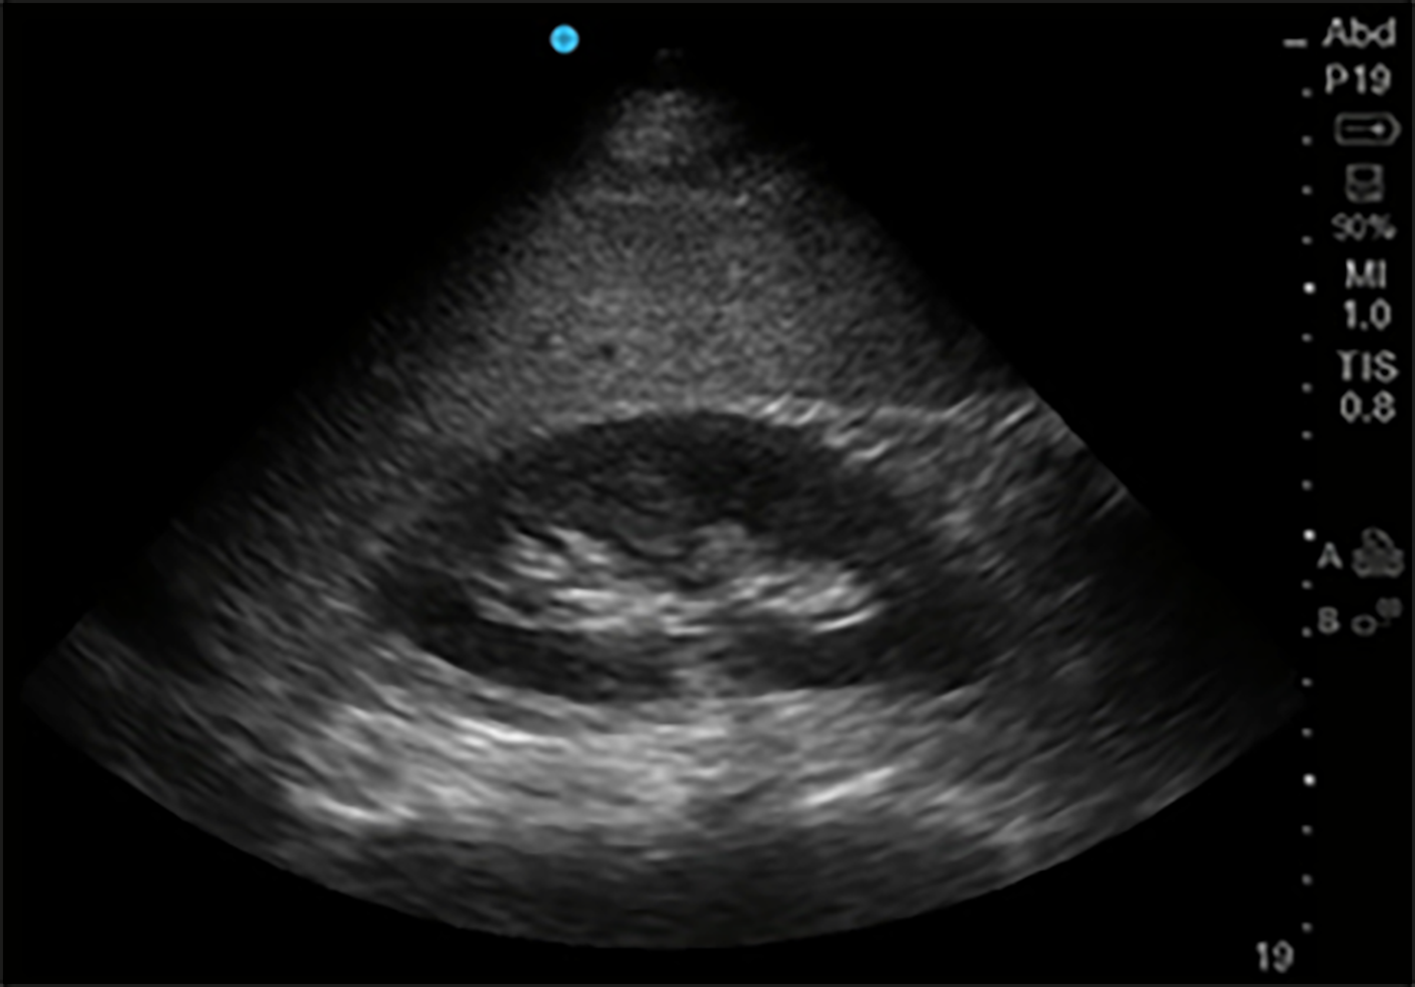
Figure 10 Kidney in its Longitudinal axis.
Phased array probe (1-5 MHz) in “Abdominal” preset placed with probe marker facing cephalad in right mid-axillary location. In this normal ultrasound, the liver serves as an acoustic window, under which can be seen the thin hyperechoic kidney capsule, the hypoechoic parenchymal cortex, and the central hyperechoic renal sinus.
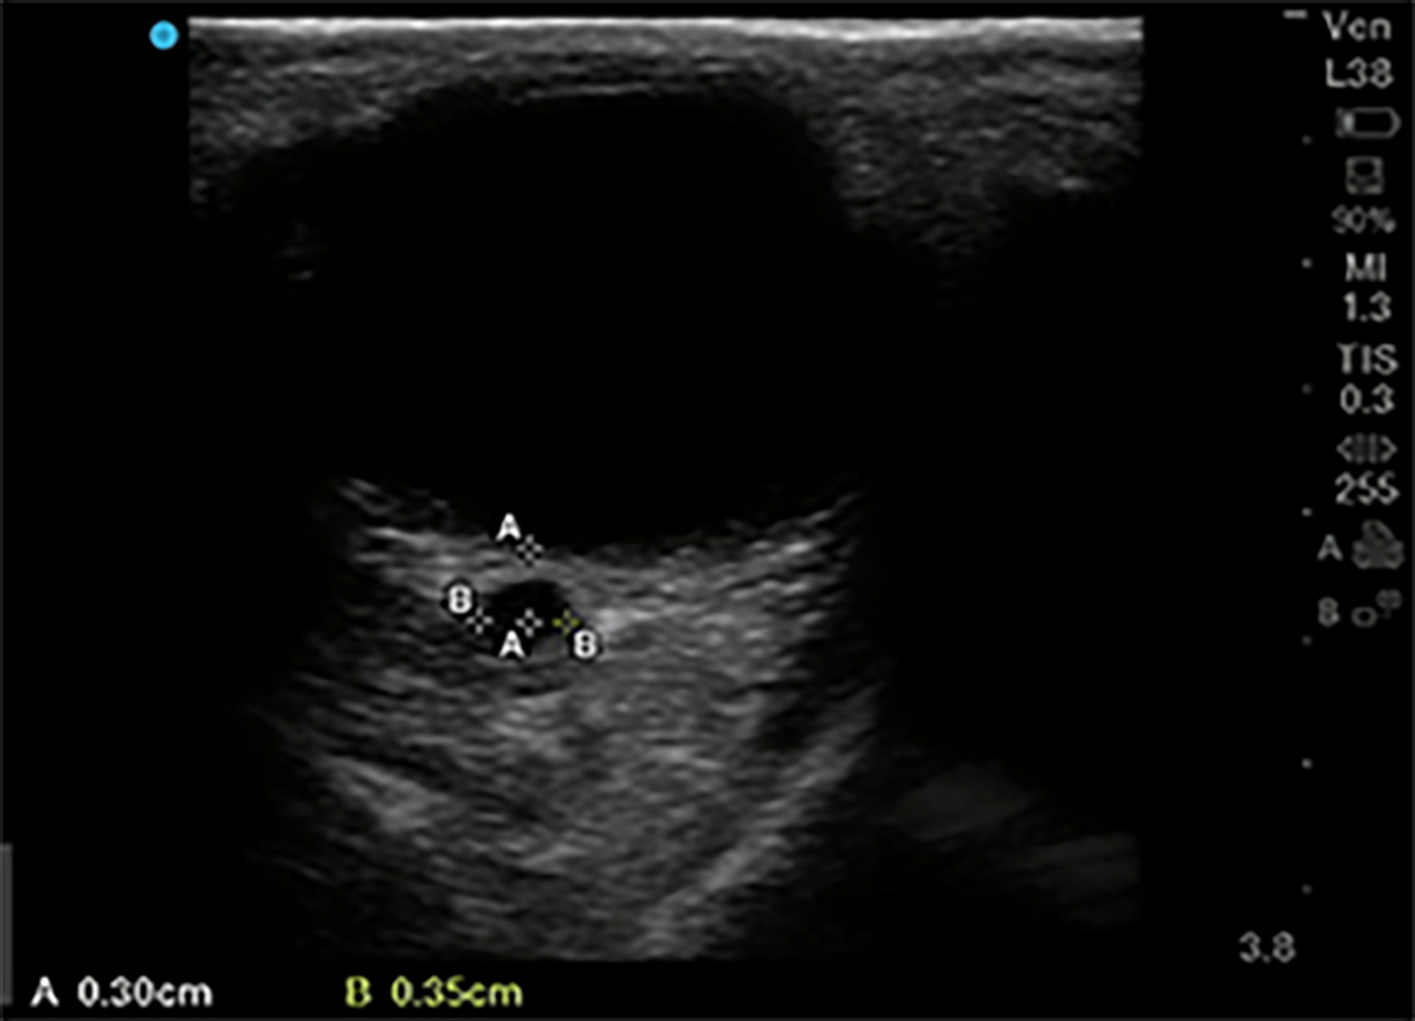
Figure 11 Optic nerve sheath diameter.
High frequency 5-10 MHz linear probe in “Ophthalmic” or “Venous” preset with probe gently placed on upper eyelid in horizontal plane. Diameter of optic nerve is measured in transverse dimension, 3 mm posterior to where optic nerve enters the globe. In this patient optic nerve sheath diameter is measured at 3.5 mm.
- Citation: Deshwal H, Pradhan D, Mukherjee V. Point-of-care ultrasound in a pandemic: Practical guidance in COVID-19 units. World J Crit Care Med 2021; 10(5): 204-219
- URL: https://www.wjgnet.com/2220-3141/full/v10/i5/204.htm
- DOI: https://dx.doi.org/10.5492/wjccm.v10.i5.204


