Copyright
©2013 Baishideng Publishing Group Co.
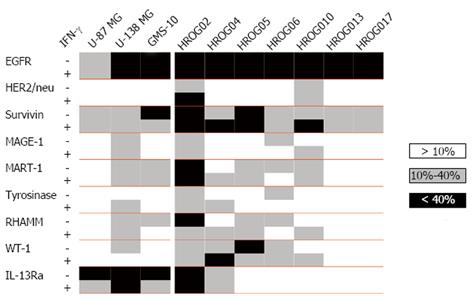
Figure 1 The percentage of cells staining positive for antibodies against tumor associated antigens was assessed by flow cytometry.
The results are depicted in the diagram with a white box representing staining in less than 10% of cells, a grey box representing 10%-40% cells positive and a black box in case of more than 40% positive cells. Values with and without the 48 h interferon gamma pretreatment (200 IU/mL) are given. Measurements were performed in three separate experiments and mean values were used to design the blot. IL: Interleukin; IFN: Interferon.
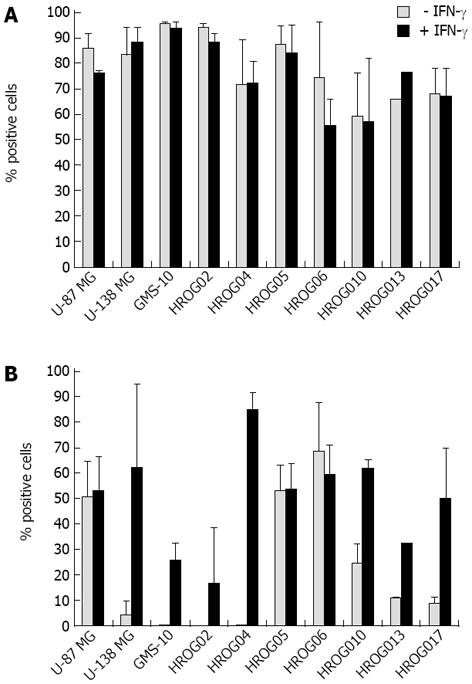
Figure 2 The percentage of cells stained positive for antibodies against (A) HLA-ABC and (B) HLA-DR, -DP as assessed by flow cytometry are depicted in the bar diagram.
The black bars represent results for cells treated with 200 IU/ml interferon gamma (IFN-γ) for 48 h prior to staining. The grey bars represent results for cells handled in the same manner but without IFN-γ. Measurements were performed in three separate experiments; values are given as mean ± SD.
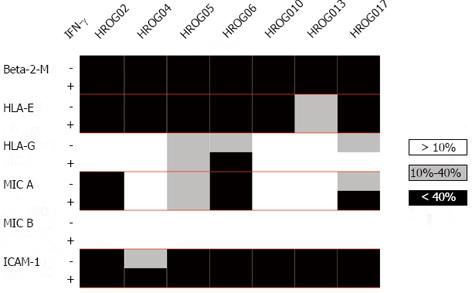
Figure 3 The percentage of cells staining positive for components of the major histocompatibility complex machinery as well as the immune-recognition-enhancing molecule ICAM (CD54) was assessed by flow cytometry.
The results are depicted in the diagram with a white box representing staining in less than 10% of cells, a grey box representing 10%-40% cells positive and a black box in case of more than 40% positive cells. Values with and without the 48 h interferon gamma pretreatment (200 IU/mL) are given. IFN: Interferon.
- Citation: Mullins CS, Walter A, Schmitt M, Classen CF, Linnebacher M. Tumor antigen and MHC expression in glioma cells for immunotherapeutic interventions. World J Immunol 2013; 3(3): 62-67
- URL: https://www.wjgnet.com/2219-2824/full/v3/i3/62.htm
- DOI: https://dx.doi.org/10.5411/wji.v3.i3.62


