Copyright
©The Author(s) 2023.
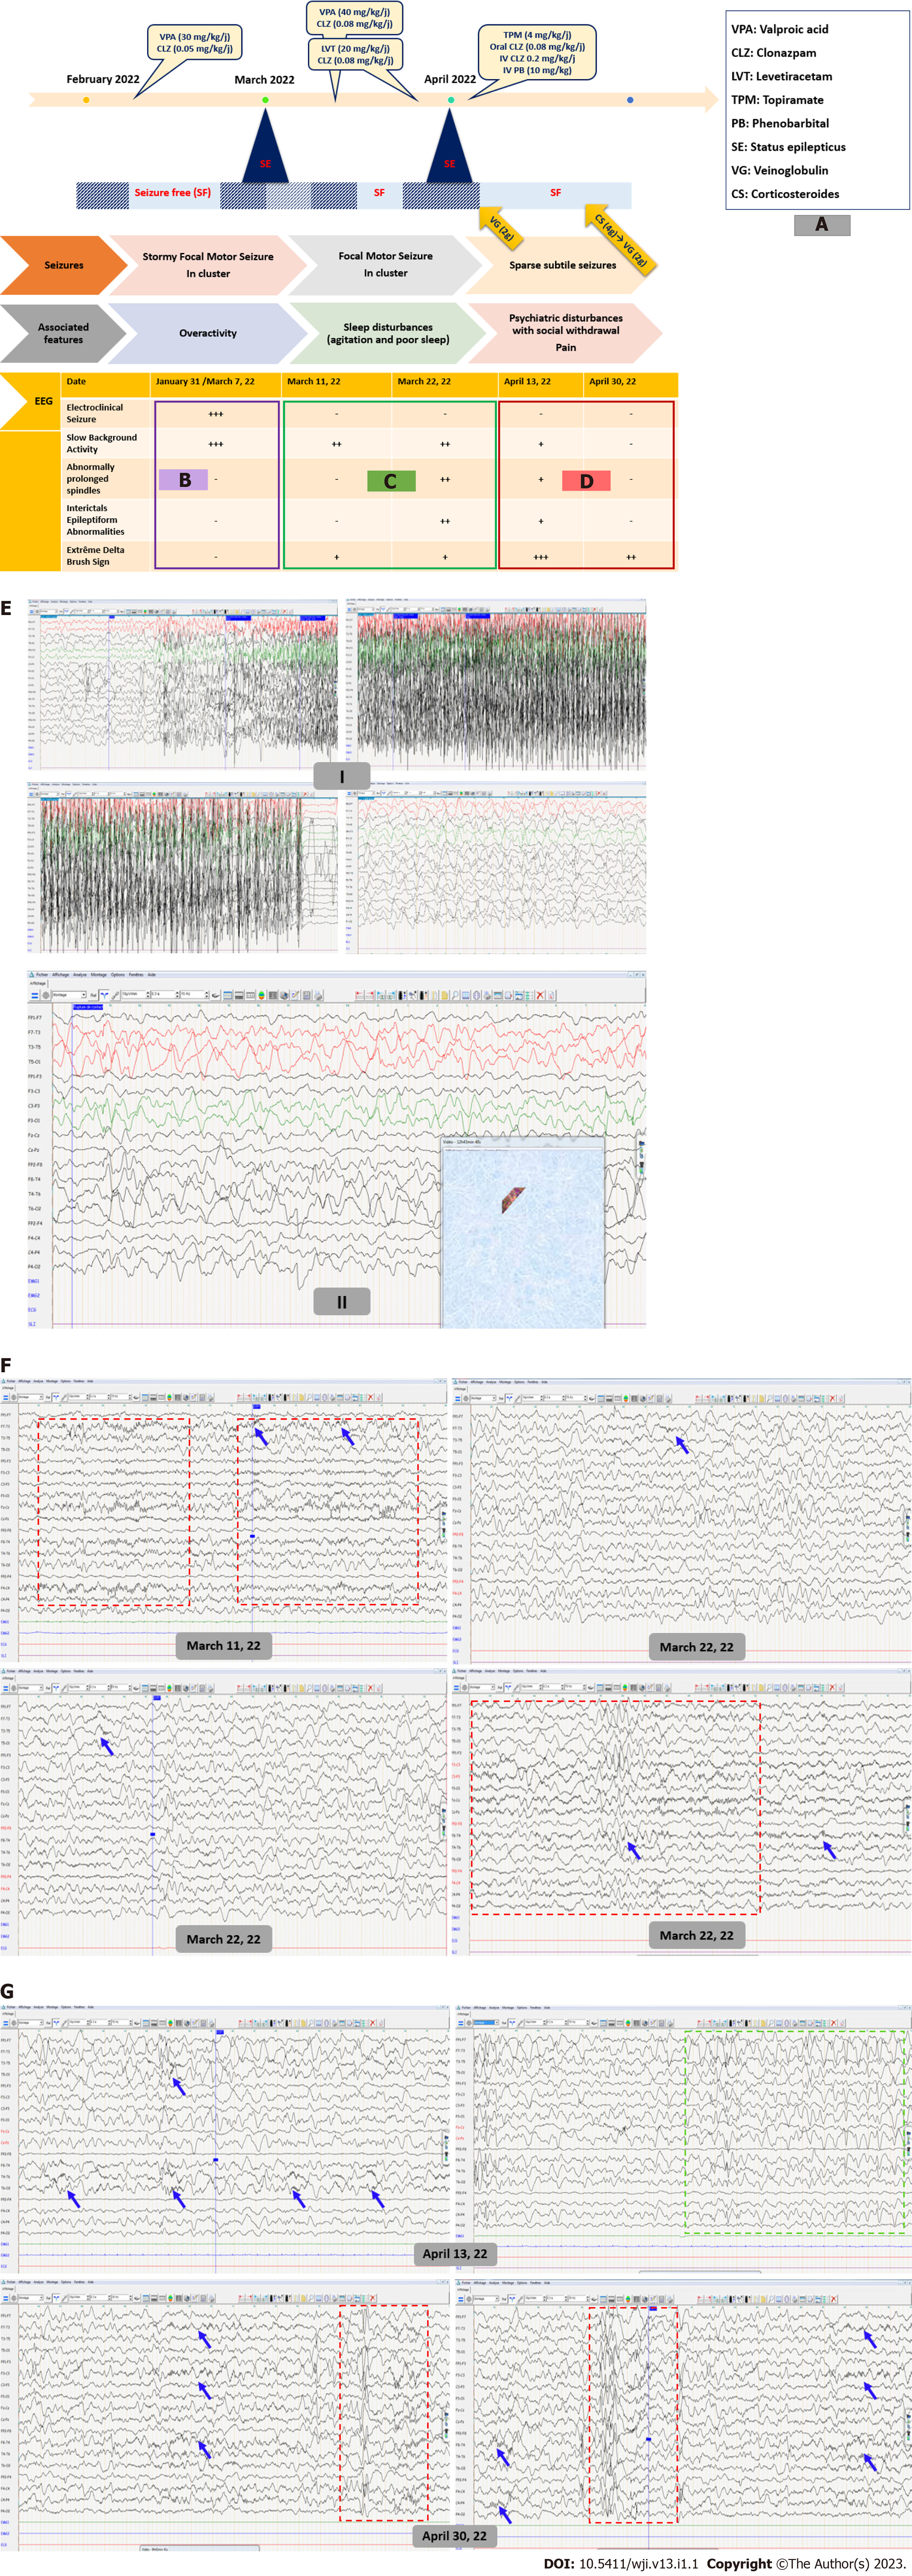
Figure 1 Electroencephalography during and between epileptic seizures.
A: The three-stage clinical disease course; B: electroencephalographic (EEG) disturbances during the first disease course; C: EEG disturbances during the second disease course; D: EEG disturbances during the third disease course; E: (I) Ictal EEG shows tonic-clonic focal motor seizure with synchronous rapid recruiting activity of left frontal origin which gradually increases in amplitude and frequency and diffuses to ipsilateral then contralateral cortex; (II) EEG during non-motor epileptic seizure shows irregular anterior high amplitude slow waves discharges alternating with short periods of low-voltage activity; F: EEG shows global slowing of the background activity with sparse surimposed delta brush activity (blue arrows) and abnormally extended and widespread spindles (red box) during sleep; G: EEG shows high load of interictal epileptiform abnormalities (green box) and extreme delta brush sign (blue arrows) and better sleep organization with K complex followed by well-structured spindles (red box).
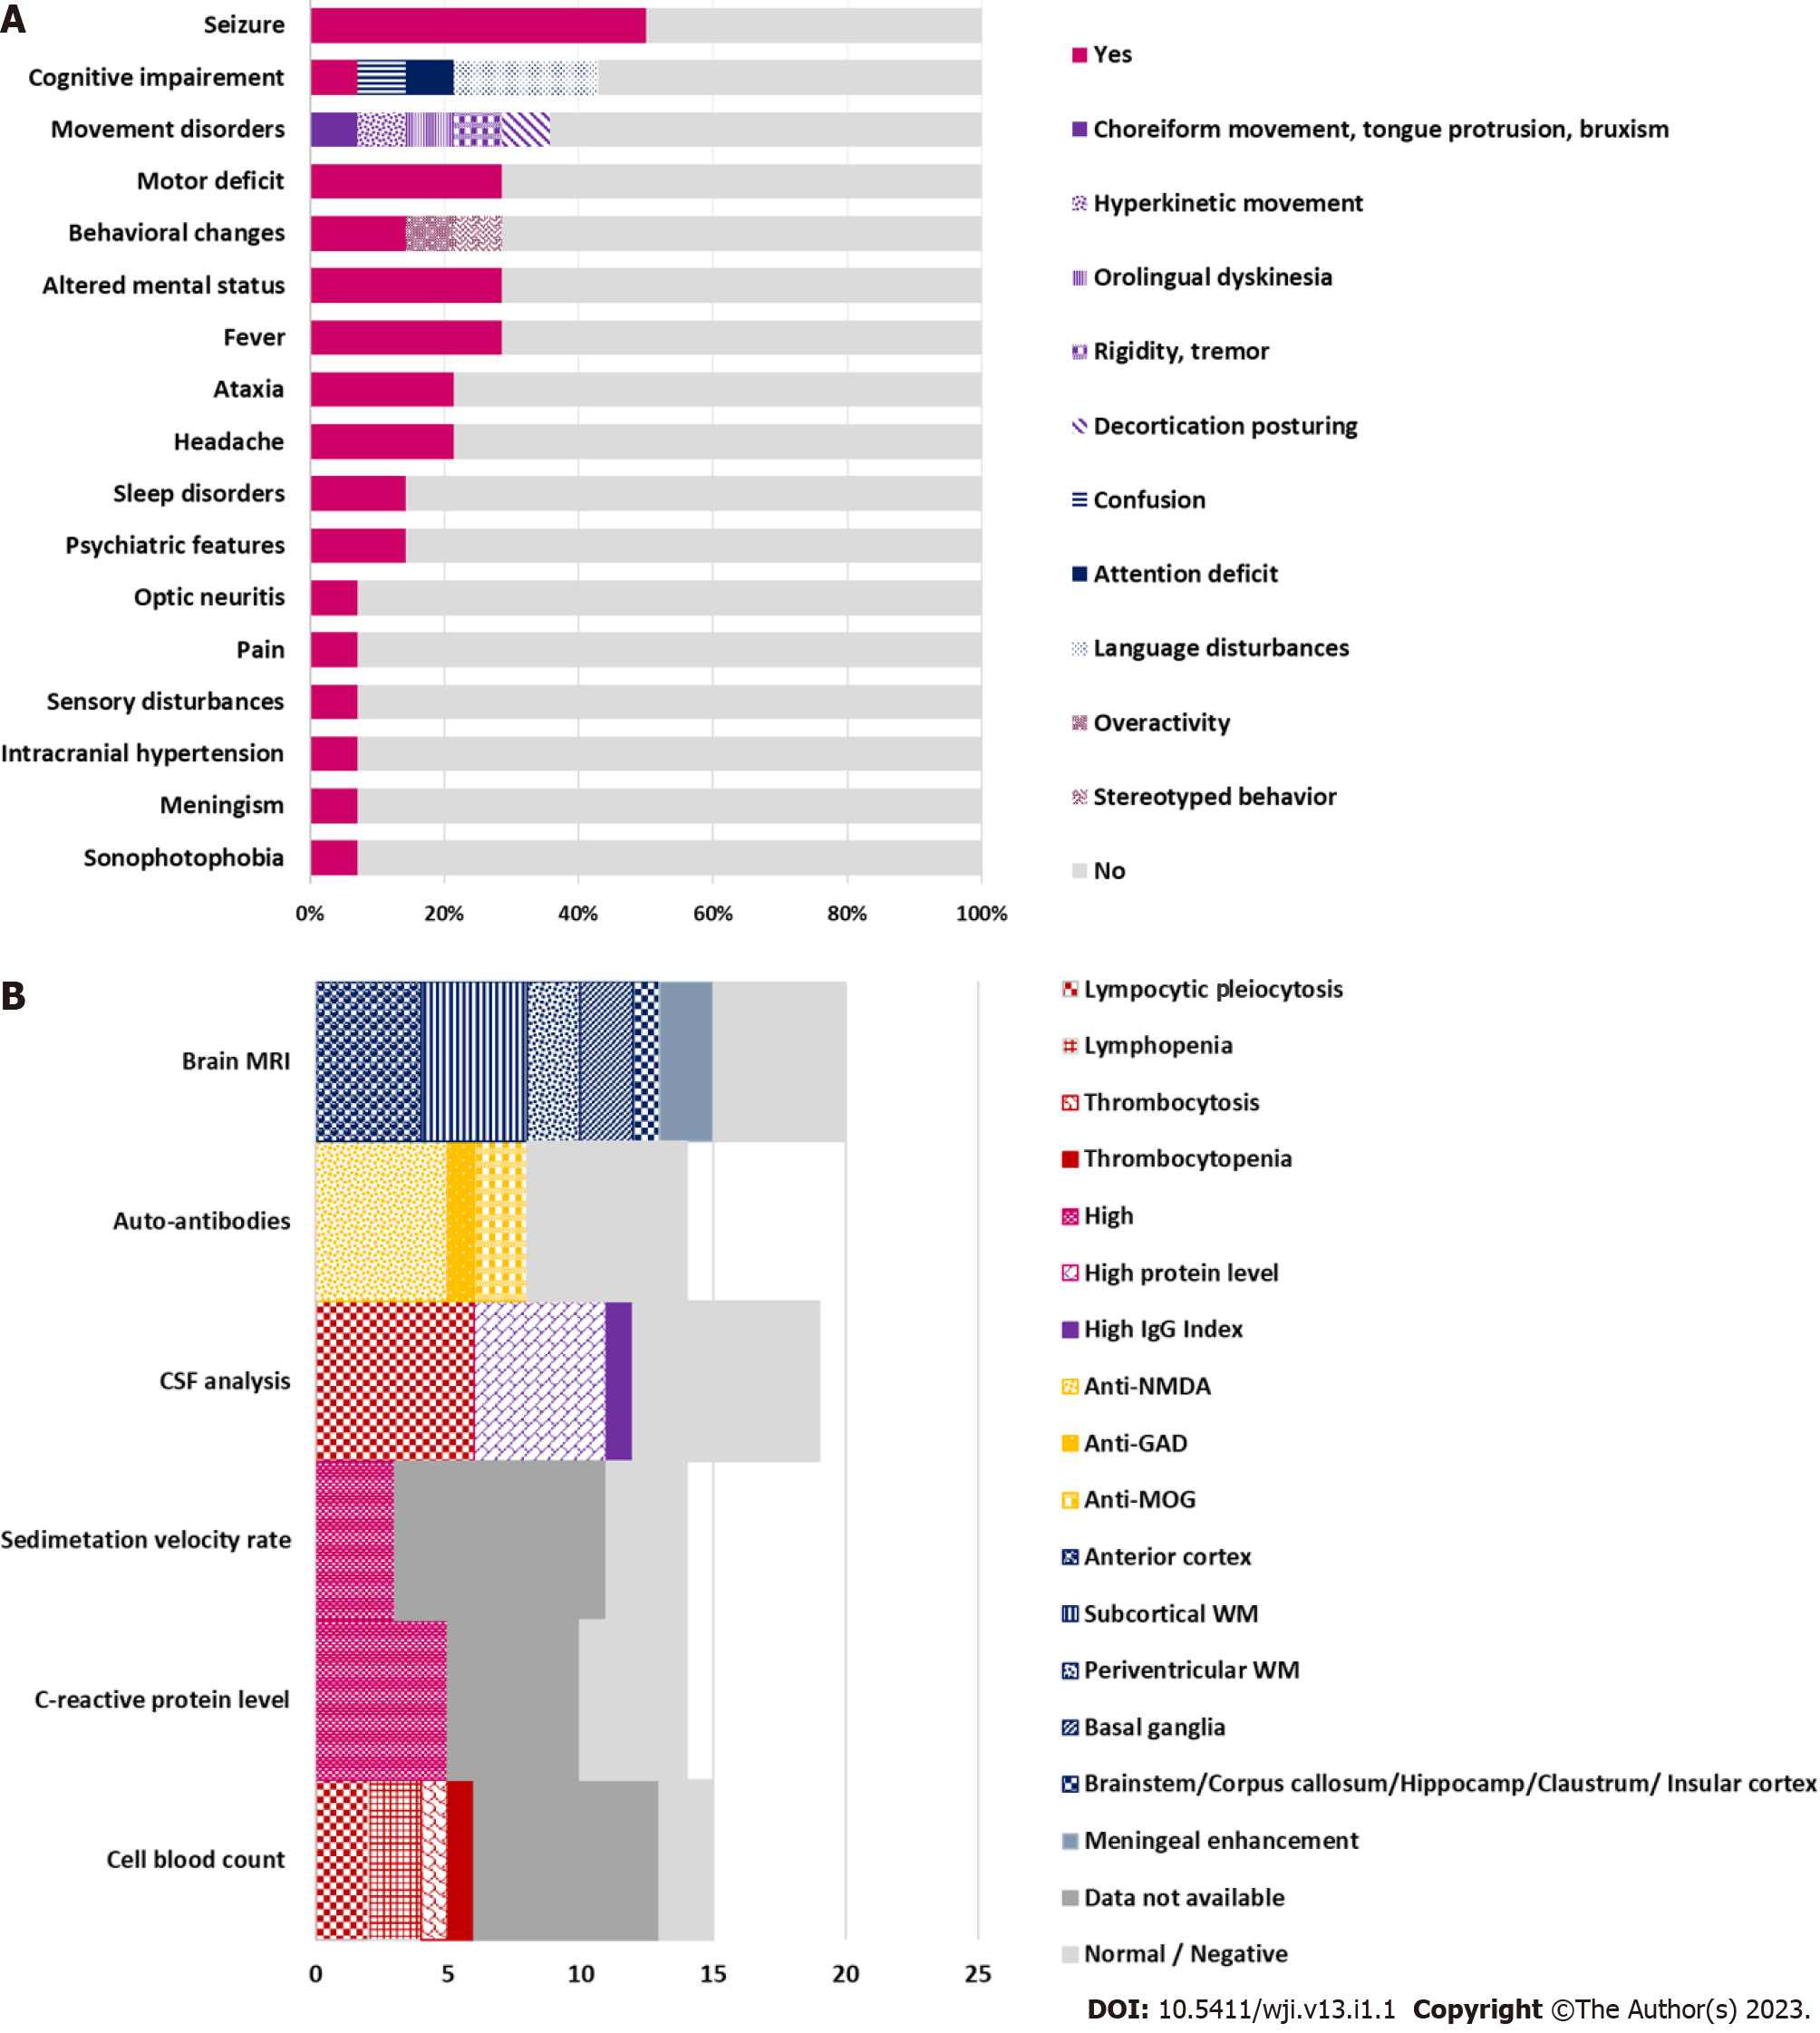
Figure 2 Neurological features and para-clinical biomarkers.
A: The percentages of neurological features associated with coronavirus disease 2019 (COVID-19)-related AIE according to previous reports; B: The percentages of support para-clinical biomarkers for post-COVID-19 autoimmune encephalitis diagnosis according to literature data[15-20].
- Citation: Zouari Mallouli S, Jallouli O, Bouchaala W, Ben Nsir S, Kamoun Feki F, Charfi Triki C. Challenges to associate early onset epilepsy with COVID-19 autoimmune encephalitis: A case report. World J Immunol 2023; 13(1): 1-10
- URL: https://www.wjgnet.com/2219-2824/full/v13/i1/1.htm
- DOI: https://dx.doi.org/10.5411/wji.v13.i1.1


