Copyright
©The Author(s) 2022.
World J Clin Pediatr. Mar 9, 2022; 11(2): 196-205
Published online Mar 9, 2022. doi: 10.5409/wjcp.v11.i2.196
Published online Mar 9, 2022. doi: 10.5409/wjcp.v11.i2.196
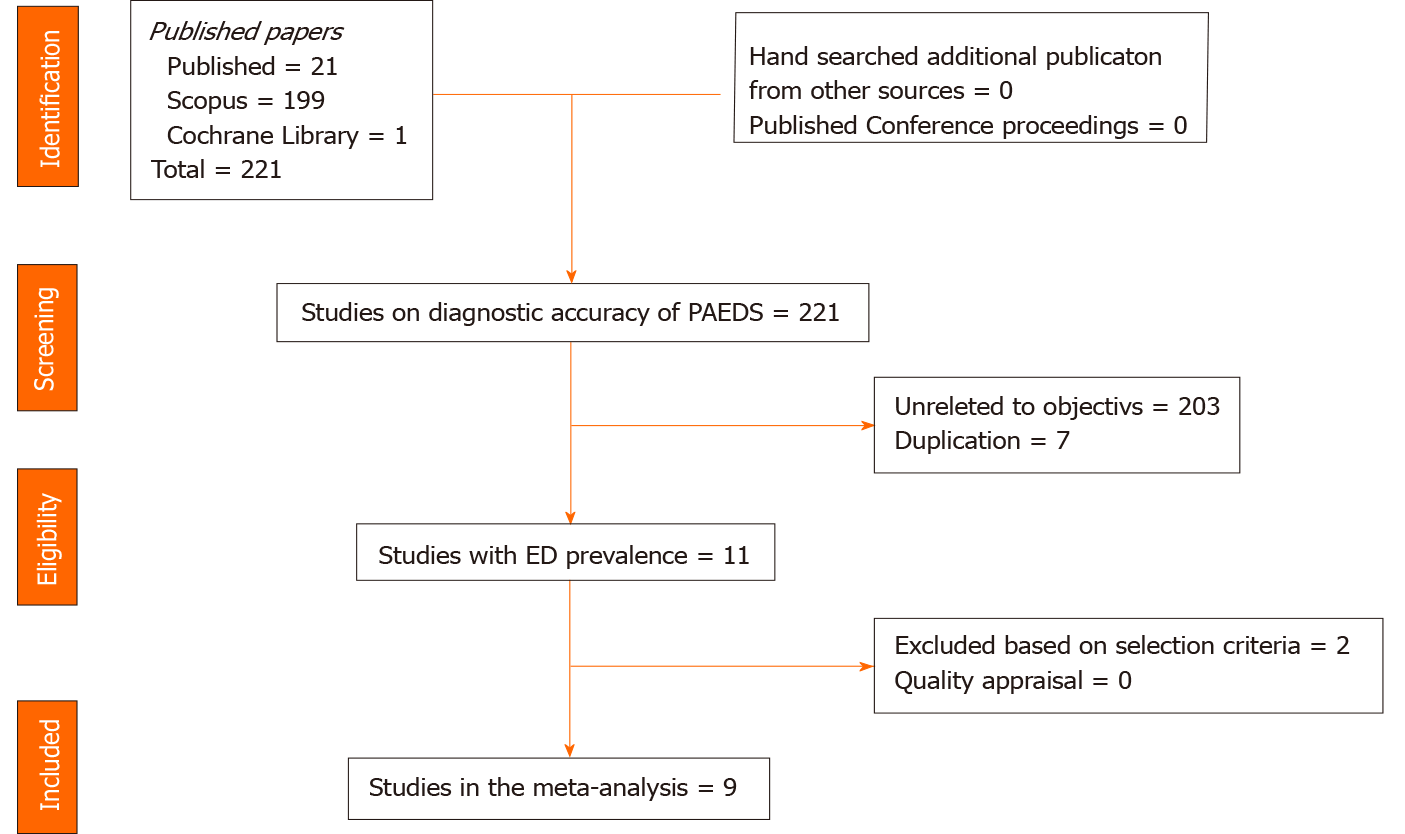
Figure 1 PRISMA flow chart of studies included in the diagnostic meta-analysis for Pediatric Anesthesia Emergence Delirium Scale.
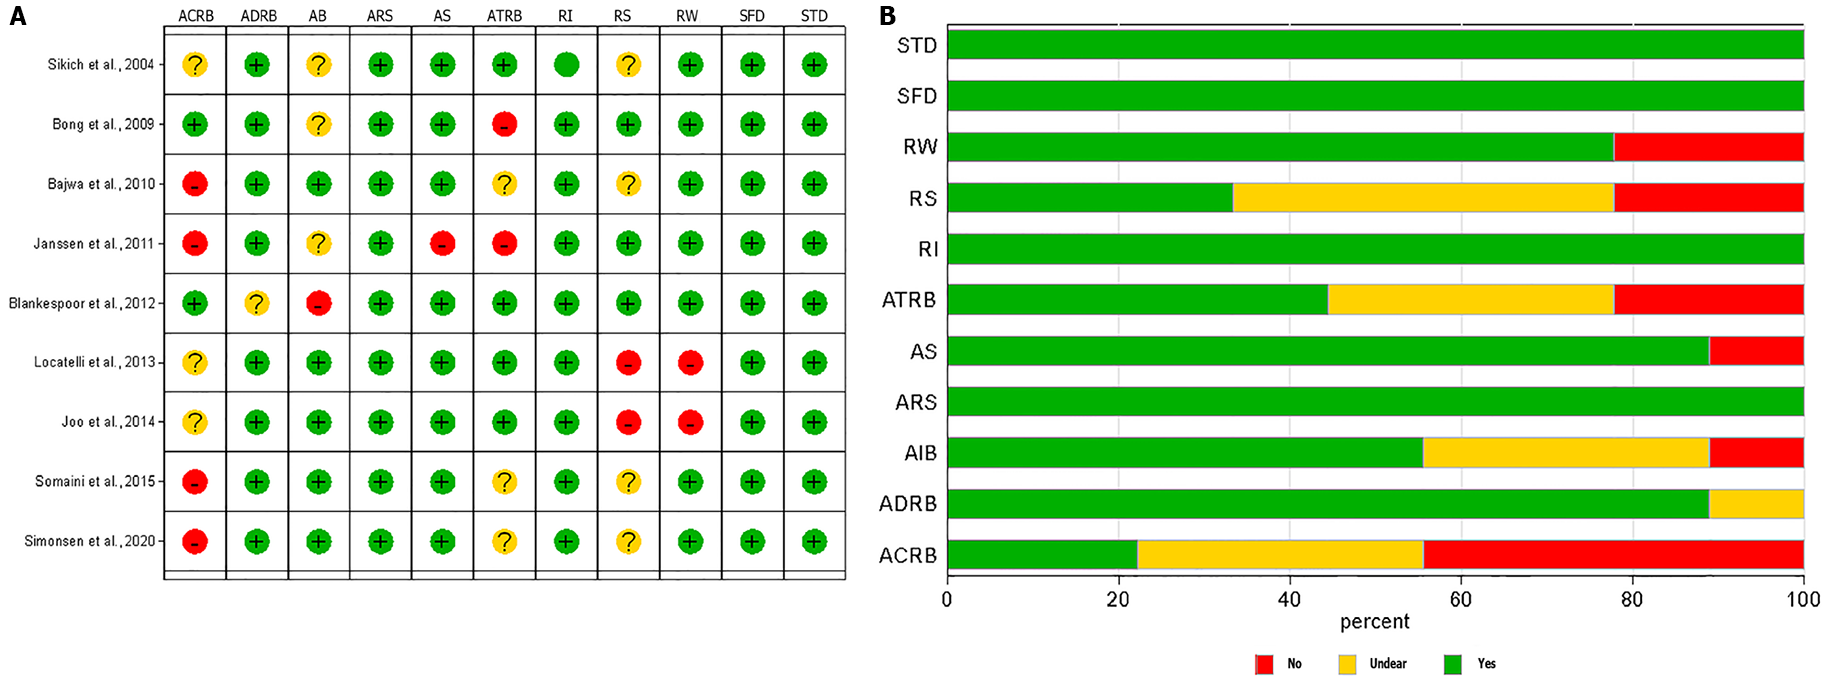
Figure 2 Quality appraisal using the revised diagnostic accuracy studies (quality assessment of diagnostic accuracy studies-2) for individual studies (A) and average quality across studies (B).
QUADAS-2: Quality assessment of diagnostic accuracy studies-2; PS: Patient selection - Describe methods of patient selection; IT: Index text -Describe the index test and how it was conducted and interpreted; RS: Reference standard - Describe the reference standard and how it was conducted and interpreted; FAT: Flow and timing; ACRS: Describe the applicability concerns about reference standard and how it was conducted and interpreted; ACPS: Describe the applicability concerns about patient selection and how it was conducted and interpreted; ACIT: Describe the applicability concerns about Index test and how it was conducted and interpreted; Low: Low bias; High: High bias UC: Unclear (if insufficient data were reported to permit our judgment).
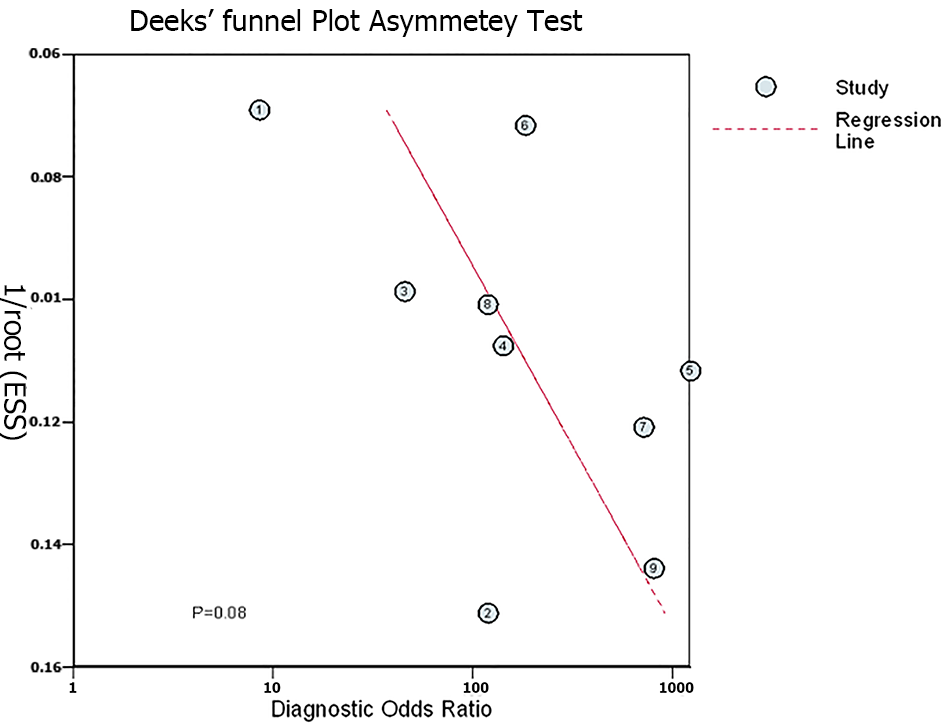
Figure 3 Deek’s plot for publication bias among studies included in the diagnostic meta-analysis for Pediatric Anesthesia Emergence Delirium Scale.
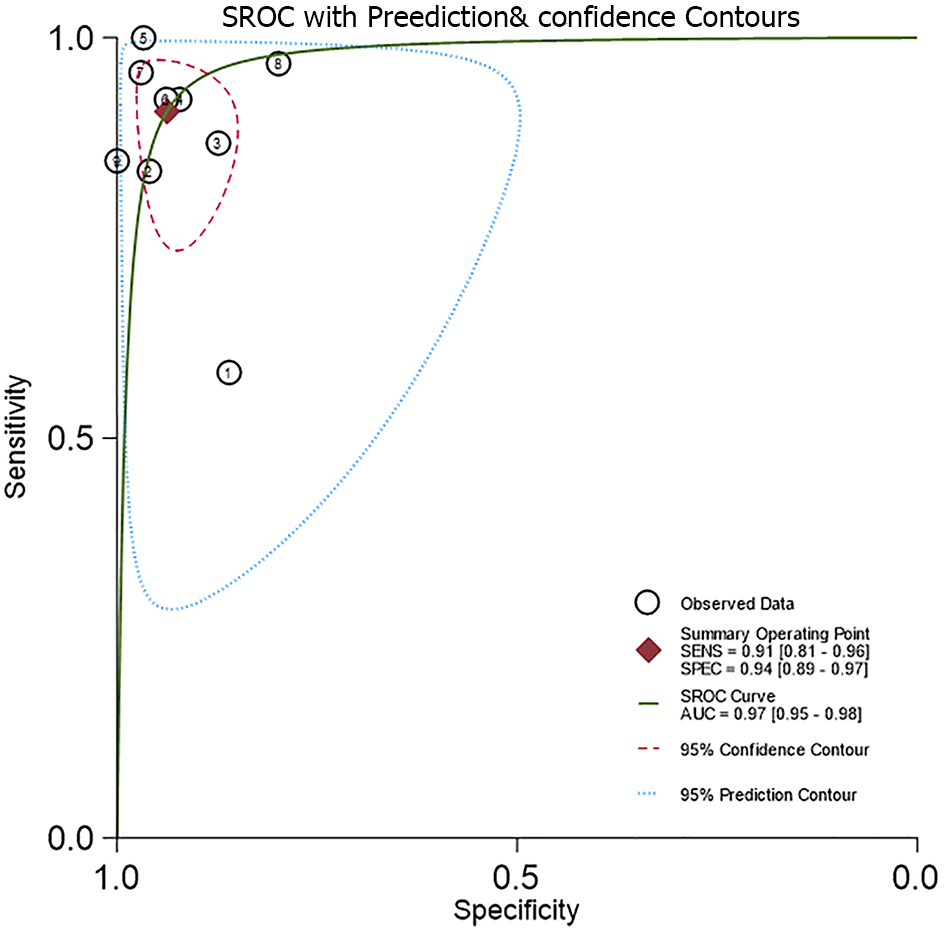
Figure 4 Diagnostic accuracy of the Pediatric Anesthesia Emergence Delirium Scale based on the summary receiver operating characteristic curve.
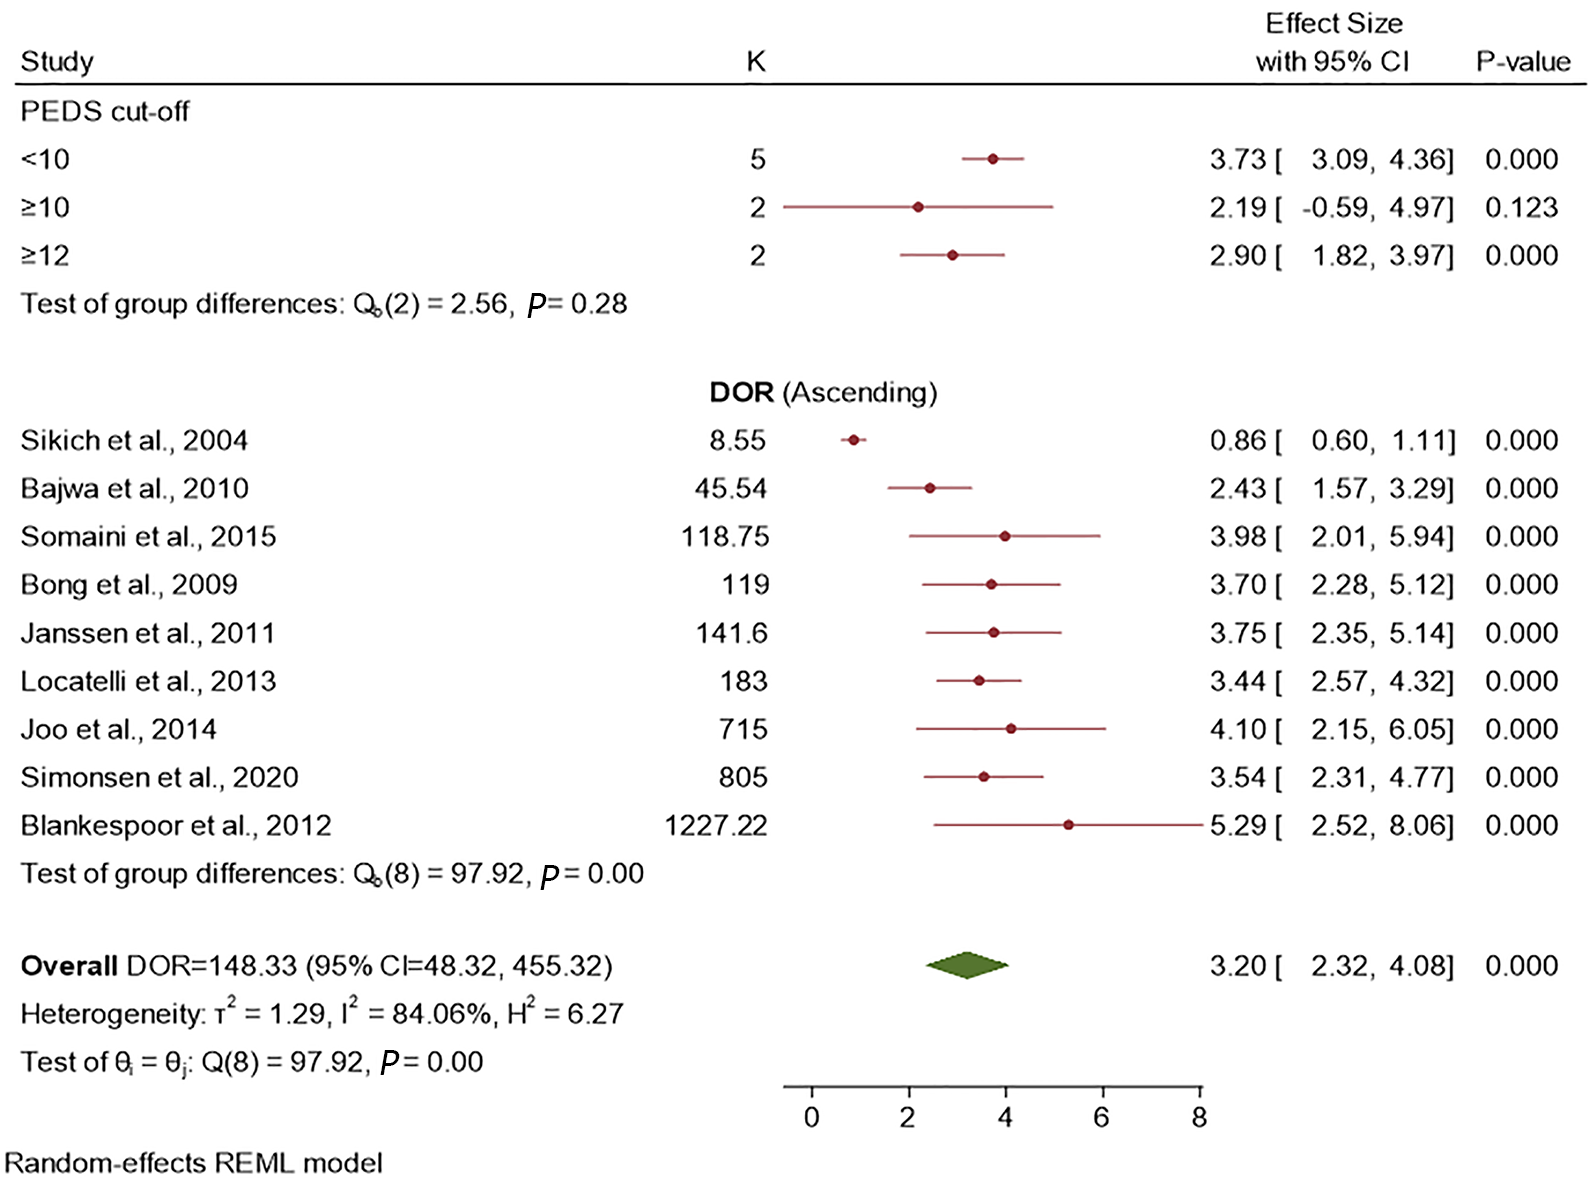
Figure 5 Forest plot for the diagnostic odds ratio presenting the subgroup analysis by cut-off scores and individual studies included in the diagnostic meta-analysis for Pediatric Anesthesia Emergence Delirium Scale.
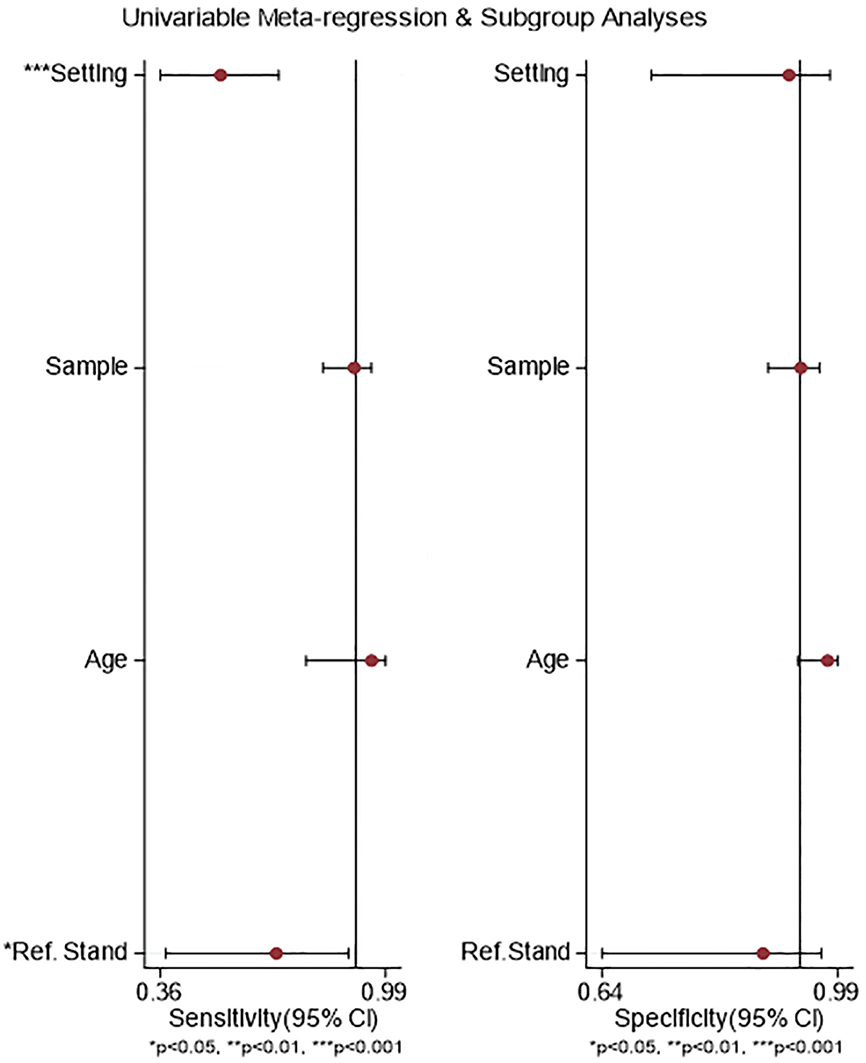
Figure 6 Meta-regression and subgroup analysis on sensitivity and specificity of Pediatric Anesthesia Emergence Delirium Scale.
- Citation: Russell PSS, Mammen PM, Shankar SR, Viswanathan SA, Rebekah G, Russell S, Earnest R, Chikkala SM. Pediatric Anesthesia Emergence Delirium Scale: A diagnostic meta-analysis. World J Clin Pediatr 2022; 11(2): 196-205
- URL: https://www.wjgnet.com/2219-2808/full/v11/i2/196.htm
- DOI: https://dx.doi.org/10.5409/wjcp.v11.i2.196


