Copyright
©2014 Baishideng Publishing Group Inc.
World J Ophthalmol. Aug 12, 2014; 4(3): 47-51
Published online Aug 12, 2014. doi: 10.5318/wjo.v4.i3.47
Published online Aug 12, 2014. doi: 10.5318/wjo.v4.i3.47
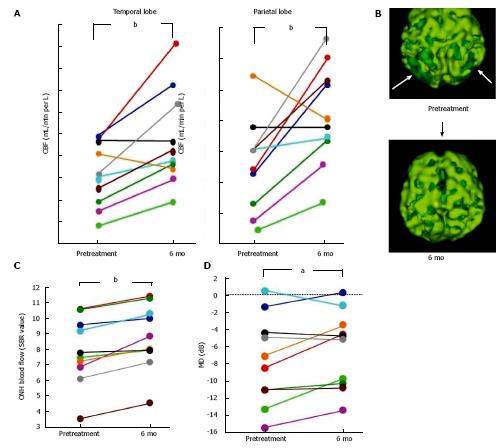
Figure 2 Changes in the cerebral blood flow of the temporal and parietal lobes (A), blood flow in the optic nerve head (C), and mean deviation (D) for each normal tension glaucoma patient after 6 mo of donepezil treatment, a representative change of SPECT images after 6 mo treatment (B).
Arrows indicate obviously decreased CBF. ONH blood flow was evaluated by laser speckle flowgraphy, and the MD was obtained by the Humphrey visual field test (program 30-2). aP < 0.05, bP < 0.01 vs pretreatment, paired t-test. ONH: Optic nerve head; MD: Mean deviation; CBF: Cerebral blood flow.
- Citation: Sugiyama T. Glaucoma and Alzheimer's disease: Their clinical similarity and future therapeutic strategies for glaucoma. World J Ophthalmol 2014; 4(3): 47-51
- URL: https://www.wjgnet.com/2218-6239/full/v4/i3/47.htm
- DOI: https://dx.doi.org/10.5318/wjo.v4.i3.47


