Copyright
©2013 Baishideng Publishing Group Co.
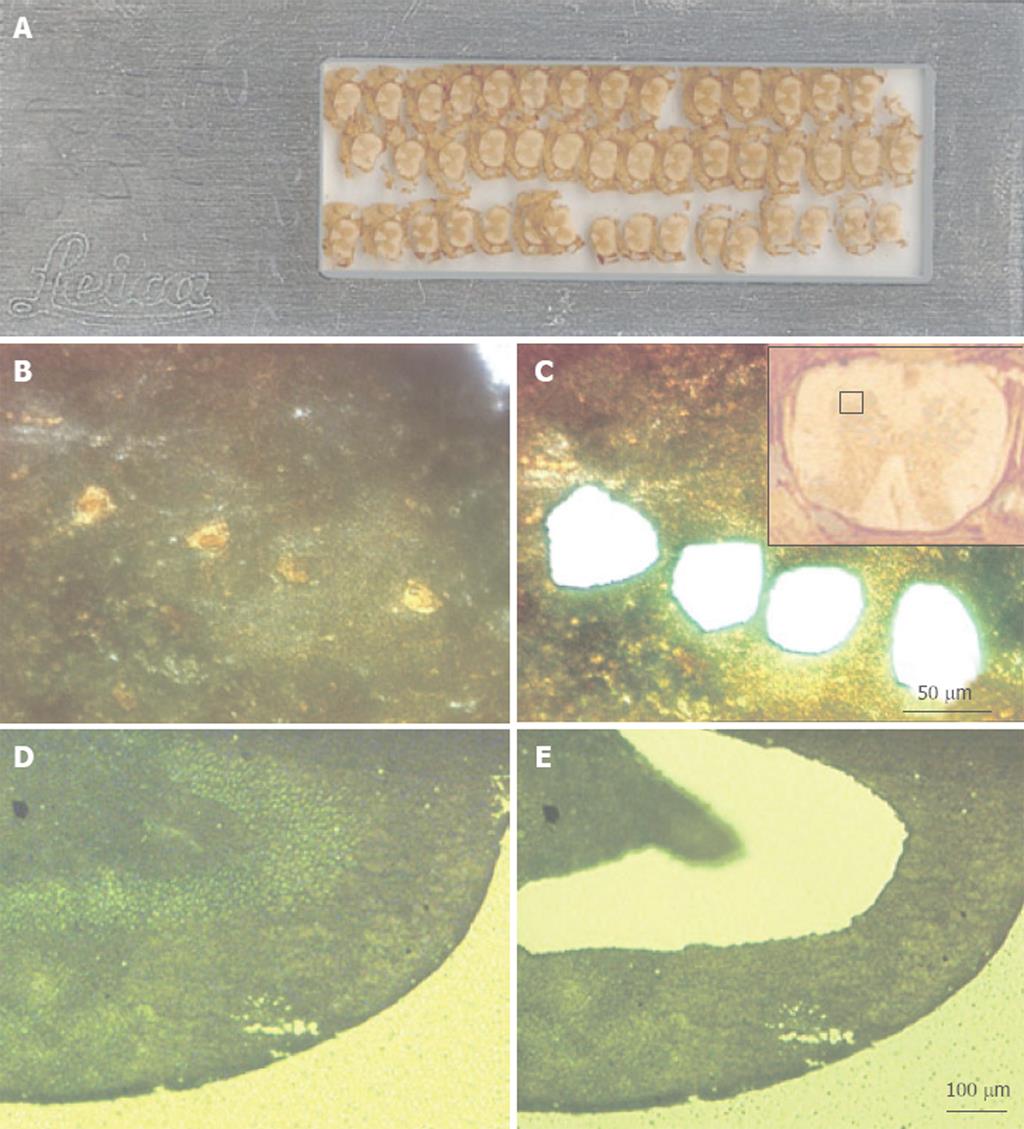
Figure 1 Examples of tissues following microdissection using a Leica DMLA laser-assisted microdissection system.
A: A scanned image of a foil slide with multiple coronal sections of mouse spinal cord mounted. These sections are 16 μm thick; B: A high-power (× 40 objective, × 400 final magnification) image of the ventral gray region of mouse spinal cord that was immuno-stained for the NeuN neuronal marker. The yellow-brown profiles are motor neurons; C: The same view as in panel B, but after laser microdissection and collection of four motor neurons; C: A low-power (× 5 objective, × 50 final magnification) image of the spinal cord section (shown upside down), with the red square marking the region shown in panels B and C; D: A low-power view (× 10 objective, × 100 final magnification) of methyl green-stained rat dentate gyrus. The section is 10 μm thick; E: An image of the same section shown in panel D, but after microdissection and collection of the neurons in the granule cell layer.
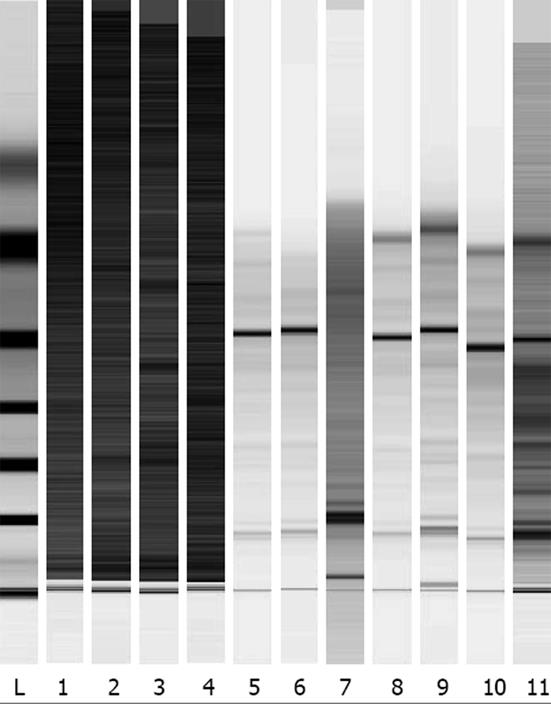
Figure 2 Ensuring quality of the microdissected neural RNA samples.
For the 28S and 18S rRNA species/bands, a Bioanalyzer Model 2001 was used to examine the quality of the RNA sample derived from the neurons collectively harvested from the hippocampus (Figure 1D and E). Lane L: The RNA ladder; lanes 1-4: Non-sample controls; lanes 5-11: Electrophoretic profiles of RNA from multiple tubes of cells collected via laser-assisted microdissection; lane 7: The sample to be degraded and was excluded from further evaluation.
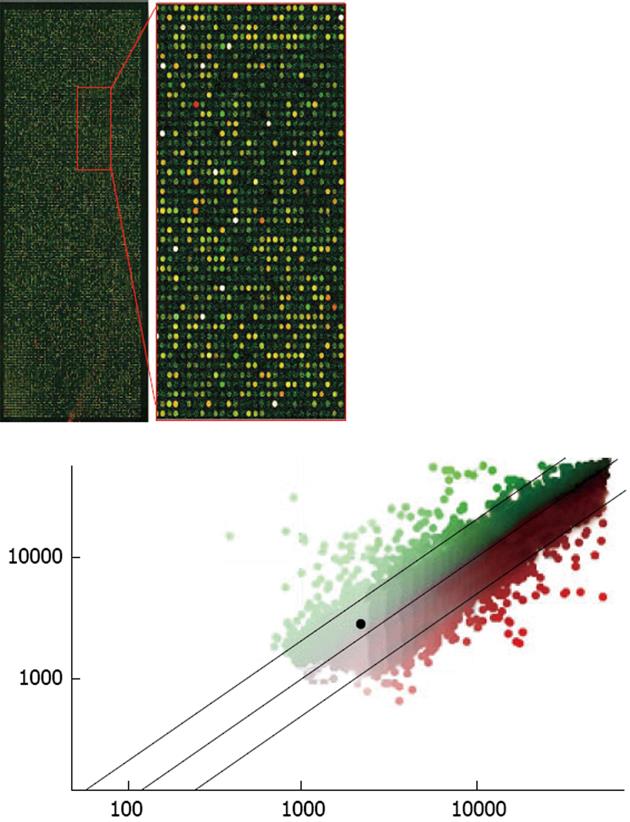
Figure 3 Example of an Agilent Rat Oligo microarray hybridized with probes from microdissected neurons.
The upper, right-hand panel is an enlarged view of a portion of the microarray. The two probes used were made from RNA amplified through one stage of the T7 method, the Cy3-labeled probe was synthesized from total RNA extracted from several thousand CA1 pyramidal neurons and the Cy5-labeled probe was synthesized from several thousand dentate gyrus granule cells, after laser-assisted microdissection. The two probes are shown overlaid; the predominance of yellow spots indicates that most of the genes in the two samples were at or near equivalent levels. Only a few spots are saturated (white). Shown in the lower panel, the genes of interest can be identified on the scatterplot (CA1 neurons vs dentate granular neurons). An example of one gene of interest is the highlighted black spot, which represents caspase-3, a key apoptotic mediator.
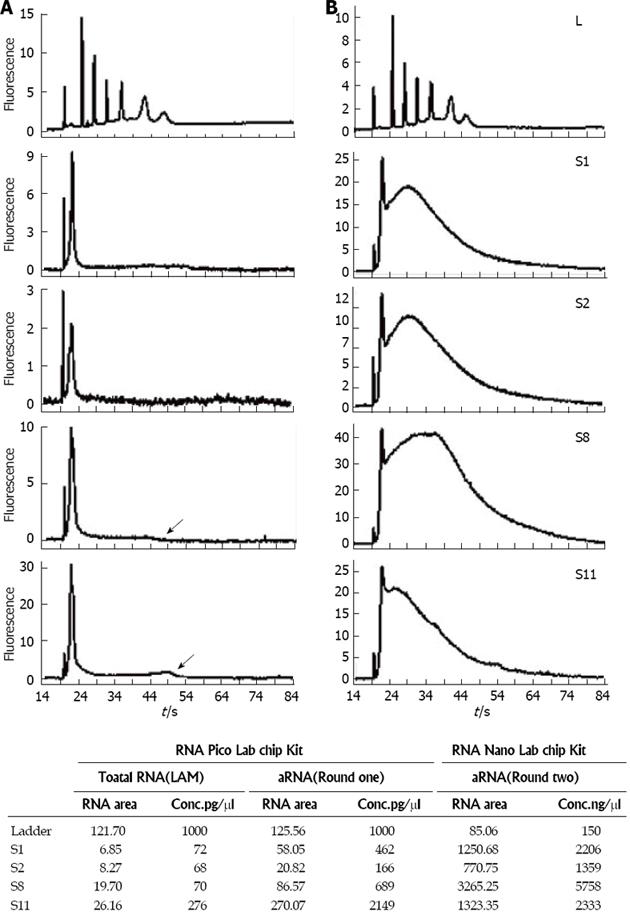
Figure 4 Bioanalyzer profiles of aRNA products from microdissected mouse spinal cord motor neurons using the Arcturus PicoAmp kit.
A and B: These are the standard views obtained from the Bioanalyzer of the Pico Chip and Nano Chip data, providing electrophoretic profiles in time (s). The ladder is shown in the uppermost profiles. Note that the quantity of ladder used in the Pico Chip (A, upper panel) was 1000 pg, but the quantity of ladder used in the Nano Chip (B, upper panel) was 150 ng (150000 pg). Thus, the scales for the Pico Chip (A) and Nano Chip (B) profiles are approximately 150-fold different. The samples shown (S1, S2, S8, and S11) are aRNA products obtained after the first round of PicoAmp amplification (A) and the second round of amplification (B). The black arrowheads in the Pico Chip data for S8 and S11 show visible points of maximal migration for RNA in these two samples; C: RNA concentrations before and after one- and two-rounds of amplifications in 4 representative samples of S1, 2, 8, and 11.
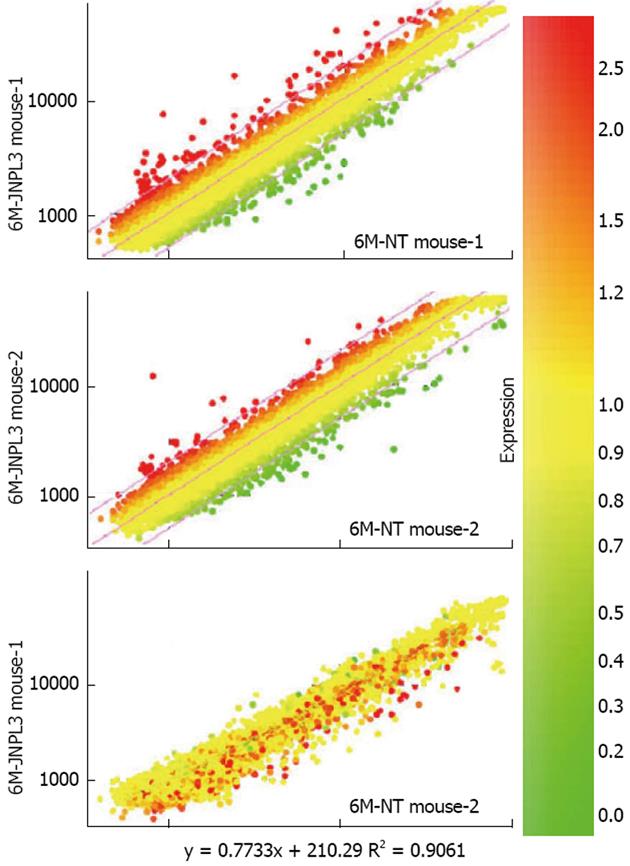
Figure 5 Examples of microarray data obtained from microdissected neurons.
Two microarray experiments using spinal cord motor neurons from four mice were performed. Scatterplots of processed data generated using the program GeneSpring are shown. In each microarray experiment, a Cy3-labeled probe made from approximately 1000 motor neurons from a P301L transgenic mouse was co-hybridized with a Cy5-labeled probe made from approximately 1000 motor neurons from a non-transgenic littermate. The results are shown in the top two scatterplots. The colors of the plotted data are derived from the scale shown at right, indicating the expression fold change. To further examine the quality of the data, a derivative plot was made (bottom). The data from two non-transgenic littermates from the two microarray experiments were plotted against each other. The correlation coefficient of these two biological replicates was r = 0.9 (bottom panel).
- Citation: He Z, Cui L, He B, Ferguson SA, Paule MG. A common genetic mechanism underlying susceptibility to posttraumatic stress disorder. World J Neurol 2013; 3(3): 14-24
- URL: https://www.wjgnet.com/2218-6212/full/v3/i3/14.htm
- DOI: https://dx.doi.org/10.5316/wjn.v3.i3.14


