Copyright
©The Author(s) 2019.
World J Clin Oncol. Apr 24, 2019; 10(4): 166-182
Published online Apr 24, 2019. doi: 10.5306/wjco.v10.i4.166
Published online Apr 24, 2019. doi: 10.5306/wjco.v10.i4.166
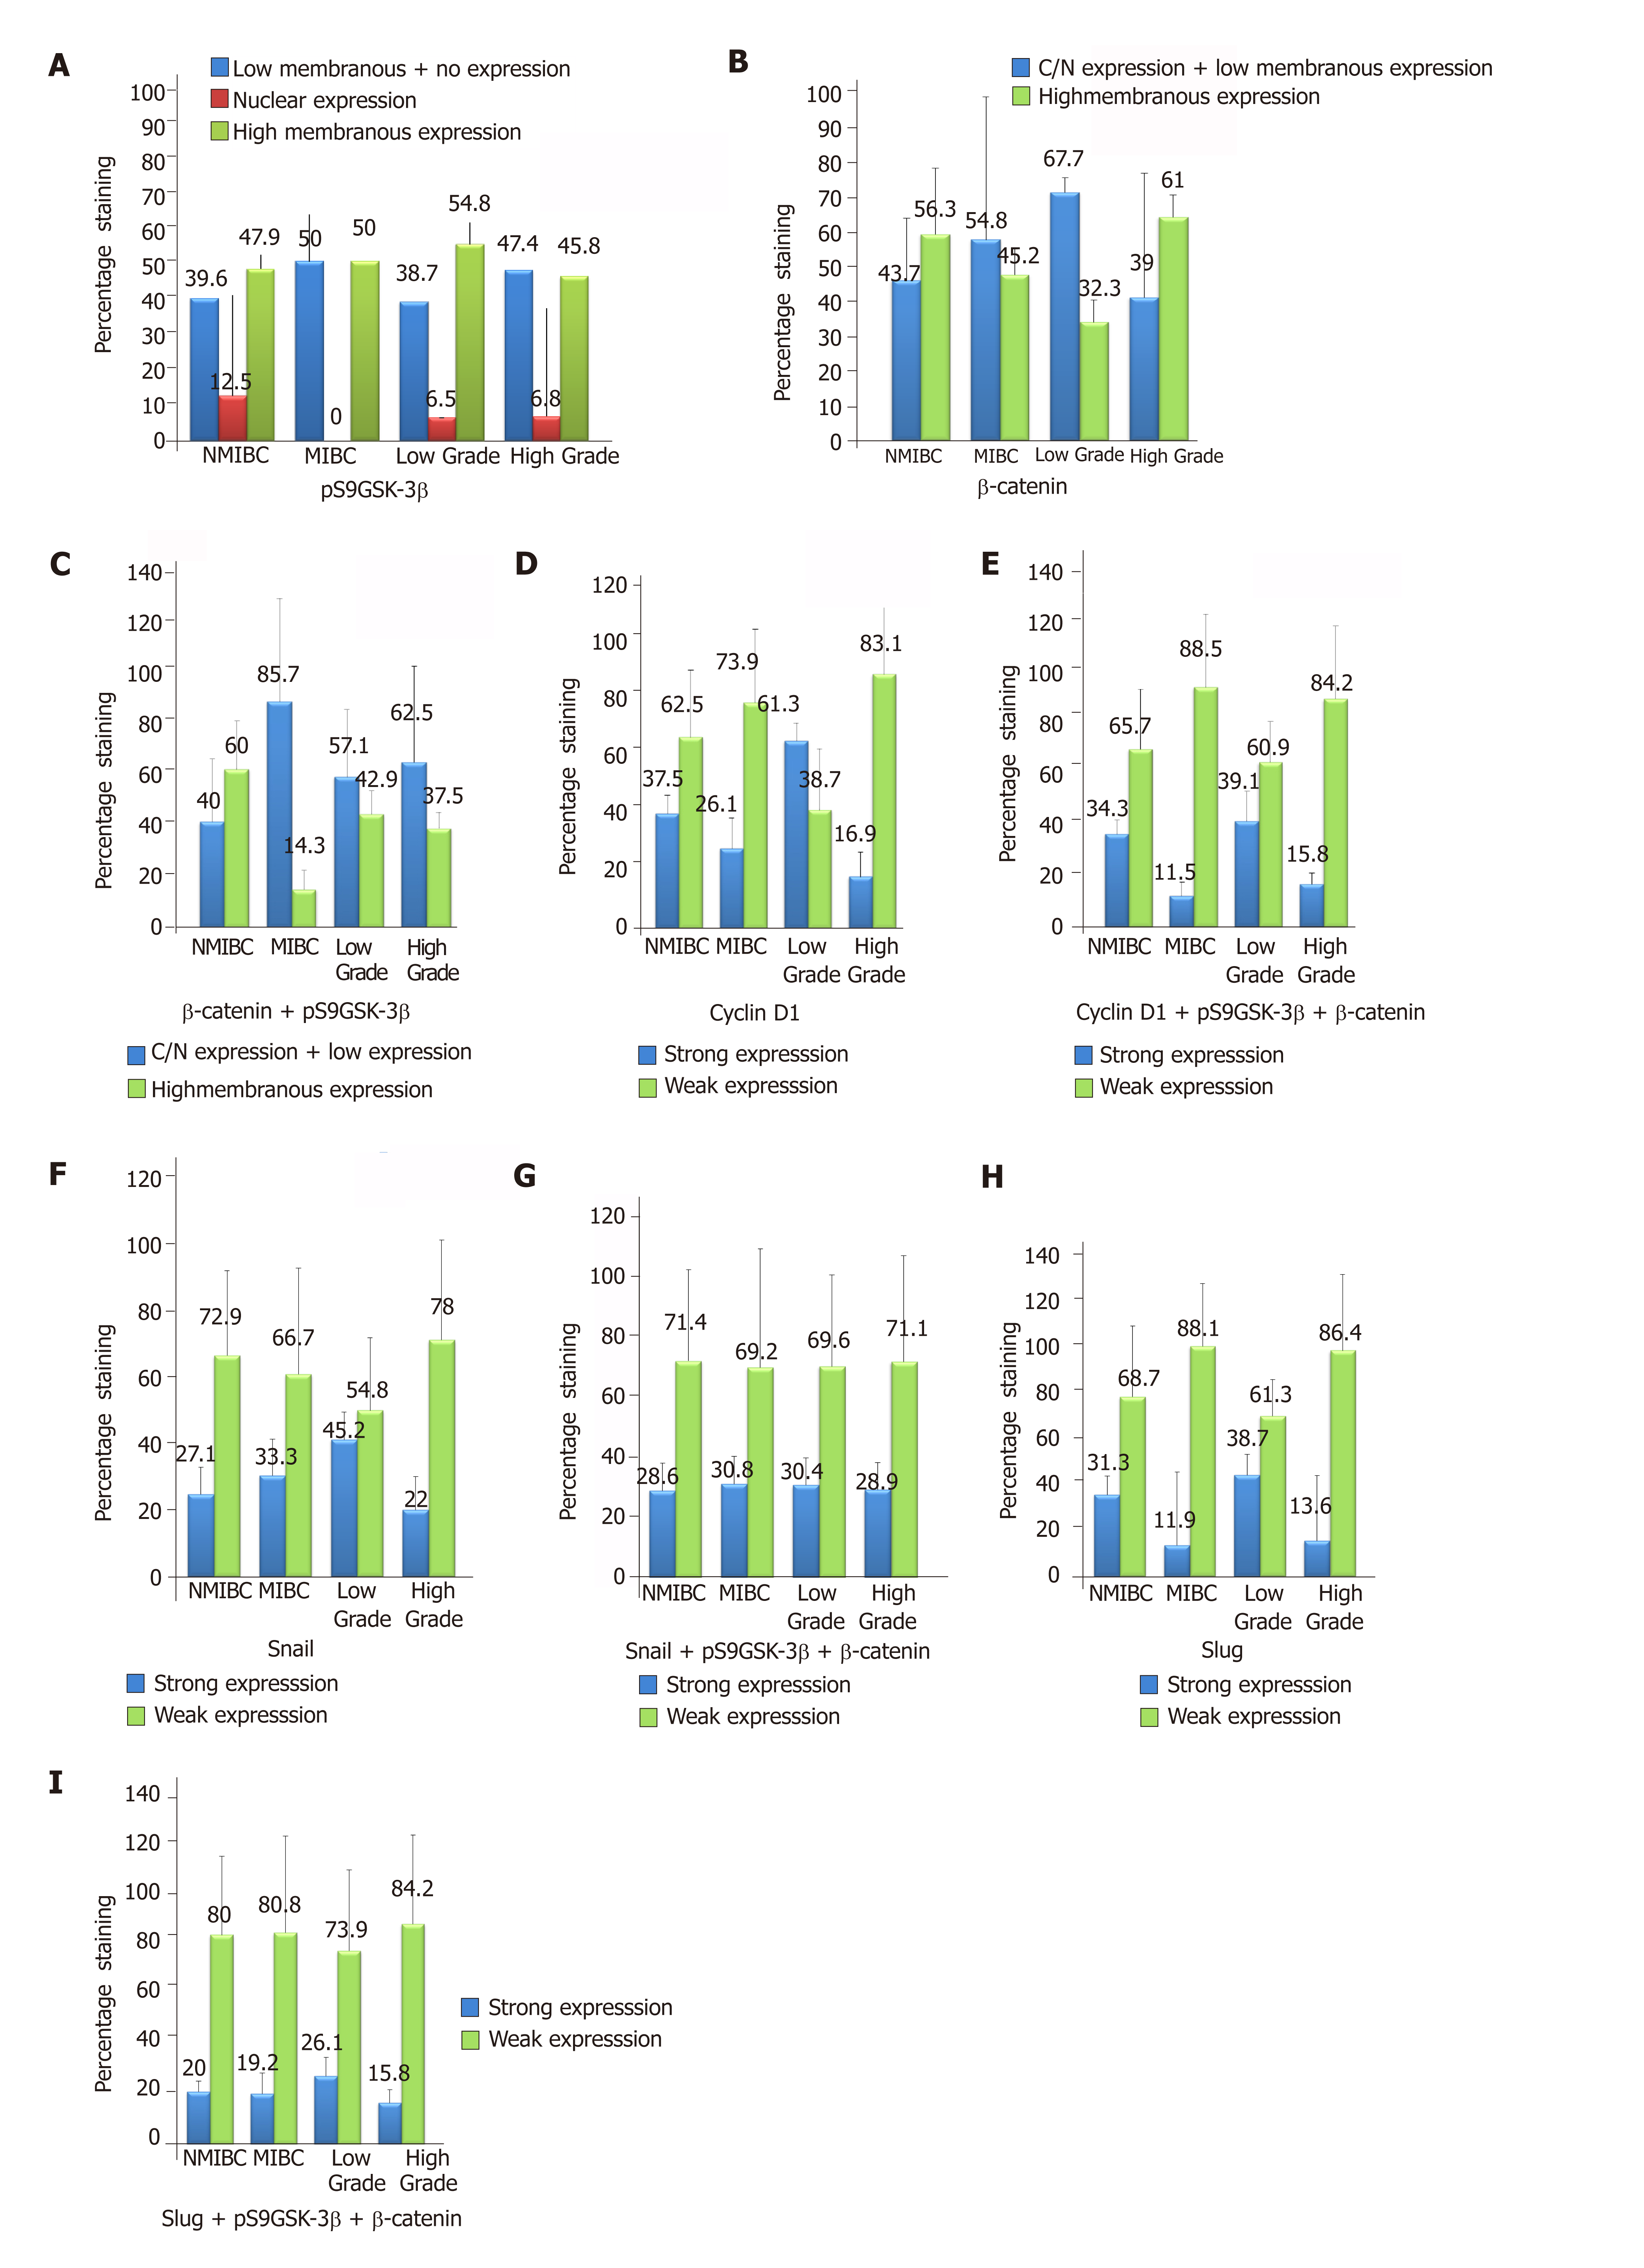
Figure 2 Graphical representation of percent immunohistochemical expression of marker proteins in 90 tissues of low stage (non-muscle invasive bladder cancer)/high stage (muscle invasive bladder cancer) and low grade/high grade tumors.
A: pS9GSK-3β [Normal expression: strong membranous expression in urothelium; Aberrant expression: low membranous, strong nuclear and cytoplasmic, no expression in urothelium]; B: β-Catenin [Normal expression: strong membranous expression in urothelium; Aberrant expression: low membranous, strong nuclear and cytoplasmic, no expression in urothelium]; C: β-Catenin + pS9GSK-3β; D: Cyclin D1 [Normal expression: strong nuclear expression in mesenchymal area; Aberrant expression: strong nuclear expression in mesenchymal area]; E: Cyclin D1 + pS9GSK-3β + β-Catenin; F: Snail [Normal expression: strong nuclear expression in mesenchymal area; Aberrant expression: strong nuclear expression in mesenchymal area]; G: Snail + pS9GSK-3β + β-Catenin; H: Slug [Normal expression: strong nuclear expression in mesenchymal area; Aberrant expression: strong nuclear expression in mesenchymal area]; I: Slug + pS9GSK-3β + β-Catenin. Numbers mentioned at the top of bars represent percentage staining of target proteins. IHC expression: Immunohistochemical expression; MIBC: Muscle invasive bladder cancer; NMIBC: Non-muscle invasive bladder cancer.
- Citation: Maurya N, Singh R, Goel A, Singhai A, Singh UP, Agrawal V, Garg M. Clinicohistopathological implications of phosphoserine 9 glycogen synthase kinase-3β/ β-catenin in urinary bladder cancer patients. World J Clin Oncol 2019; 10(4): 166-182
- URL: https://www.wjgnet.com/2218-4333/full/v10/i4/166.htm
- DOI: https://dx.doi.org/10.5306/wjco.v10.i4.166


