Copyright
©The Author(s) 2017.
World J Clin Oncol. Aug 10, 2017; 8(4): 371-377
Published online Aug 10, 2017. doi: 10.5306/wjco.v8.i4.371
Published online Aug 10, 2017. doi: 10.5306/wjco.v8.i4.371
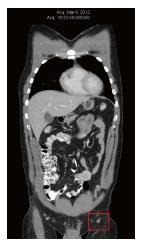
Figure 1 Computed tomography scan from March 2012 prior to natural therapies and prior to dichloroacetate therapy.
Largest node measured 8 mm in diameter.
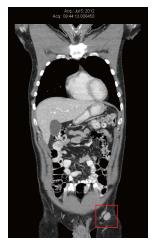
Figure 2 Computed tomography scan from July 2012 after 3 mo of natural therapy alone, just prior to the start of dichloroacetate therapy.
Largest node measured 22 mm × 20 mm.
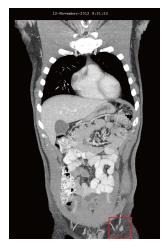
Figure 3 Computed tomography scan from November 2012 after 4 mo of dichloroacetate therapy.
Largest node measured 10 mm.
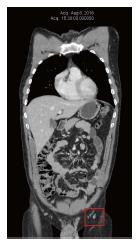
Figure 4 Computed tomography scan after 4 years of dichloroacetate therapy without any concurrent conventional cancer therapies.
Scan demonstrates absence of cancer re-growth. All nodes measure less than 10 mm.
- Citation: Khan A, Andrews D, Shainhouse J, Blackburn AC. Long-term stabilization of metastatic melanoma with sodium dichloroacetate. World J Clin Oncol 2017; 8(4): 371-377
- URL: https://www.wjgnet.com/2218-4333/full/v8/i4/371.htm
- DOI: https://dx.doi.org/10.5306/wjco.v8.i4.371


