Copyright
©The Author(s) 2017.
World J Clin Oncol. Jun 10, 2017; 8(3): 273-284
Published online Jun 10, 2017. doi: 10.5306/wjco.v8.i3.273
Published online Jun 10, 2017. doi: 10.5306/wjco.v8.i3.273
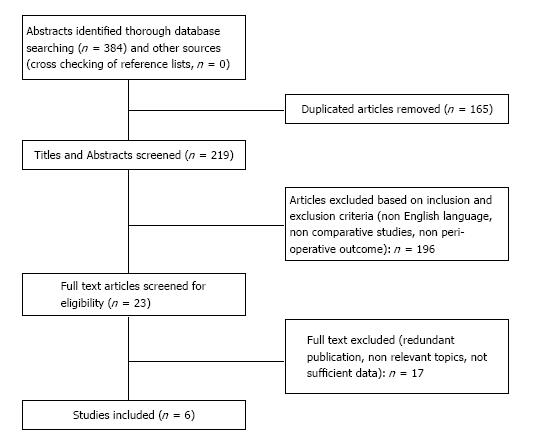
Figure 1 Flow chart of study selection.
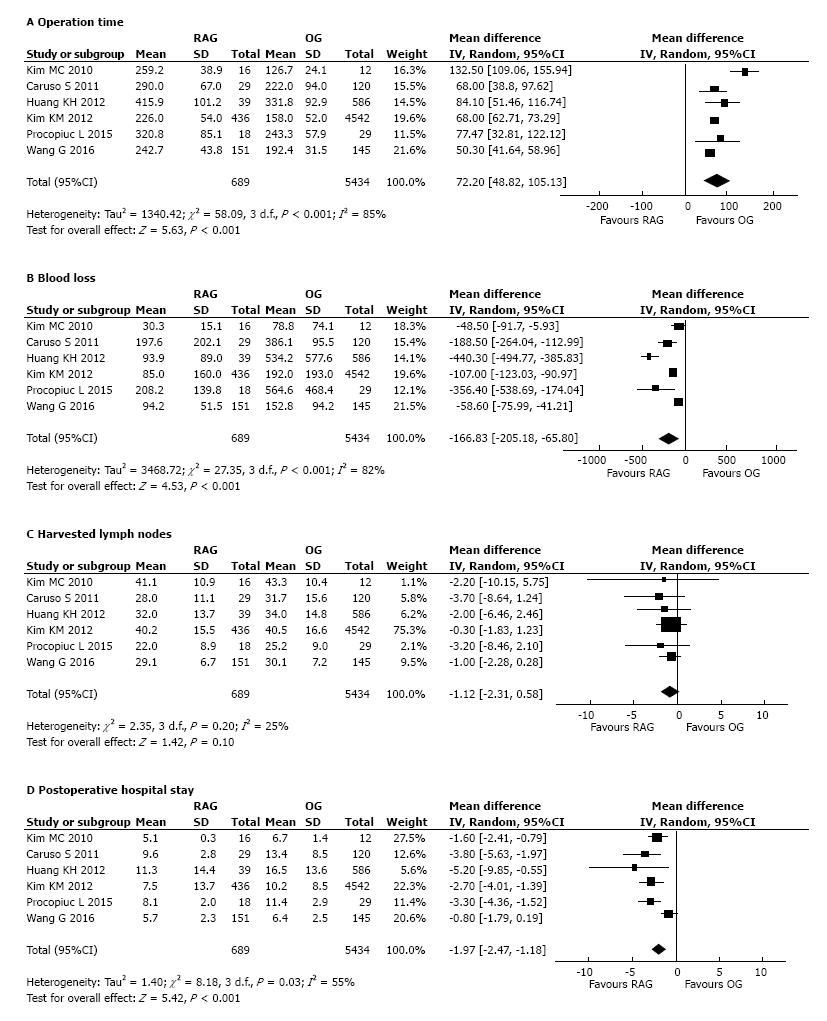
Figure 2 Forest plot showing the meta-analysis of pooled data on robot-assisted gastrectomy vs open gastrectomy.
A: Operation time; B: Estimated blood loss; C: Harvested lymph nodes; D: Postoperative hospital stay. RAG: Robot-assisted gastrectomy; OG: Open gastrectomy.
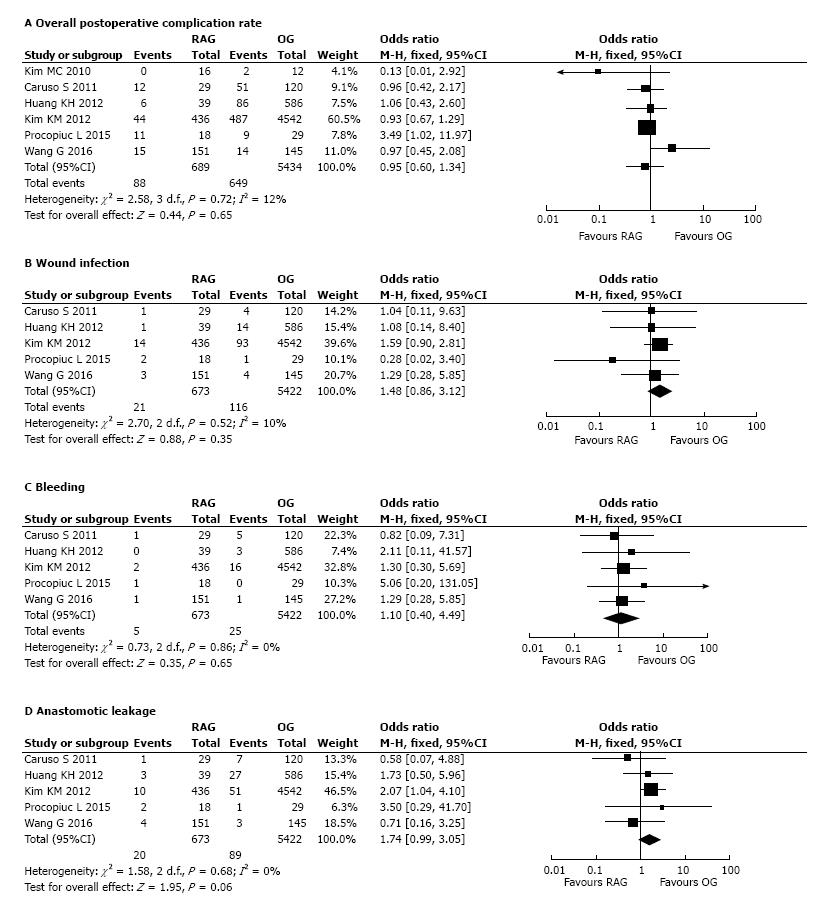
Figure 3 Forest plot showing the meta-analysis of postoperative complication between robot-assisted gastrectomy and open gastrectomy.
A: Overall postoperative complications; B: Wound infection; C: Bleeding; D: Anastomotic leakage. RAG: Robot-assisted gastrectomy; OG: Open gastrectomy.
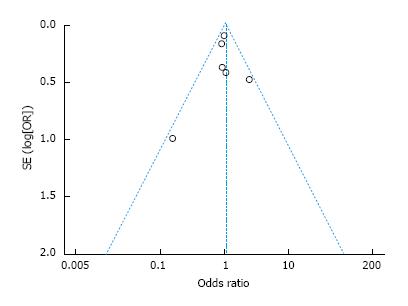
Figure 4 Funnel plot for results from each study comparing overall morbidity between robot-assisted gastrectomy and open gastrectomy.
OR: Odds ratio; SE: Standard error.
- Citation: Caruso S, Patriti A, Roviello F, De Franco L, Franceschini F, Ceccarelli G, Coratti A. Robot-assisted laparoscopic vs open gastrectomy for gastric cancer: Systematic review and meta-analysis. World J Clin Oncol 2017; 8(3): 273-284
- URL: https://www.wjgnet.com/2218-4333/full/v8/i3/273.htm
- DOI: https://dx.doi.org/10.5306/wjco.v8.i3.273


