Copyright
©The Author(s) 2025.
World J Clin Oncol. May 24, 2025; 16(5): 102611
Published online May 24, 2025. doi: 10.5306/wjco.v16.i5.102611
Published online May 24, 2025. doi: 10.5306/wjco.v16.i5.102611
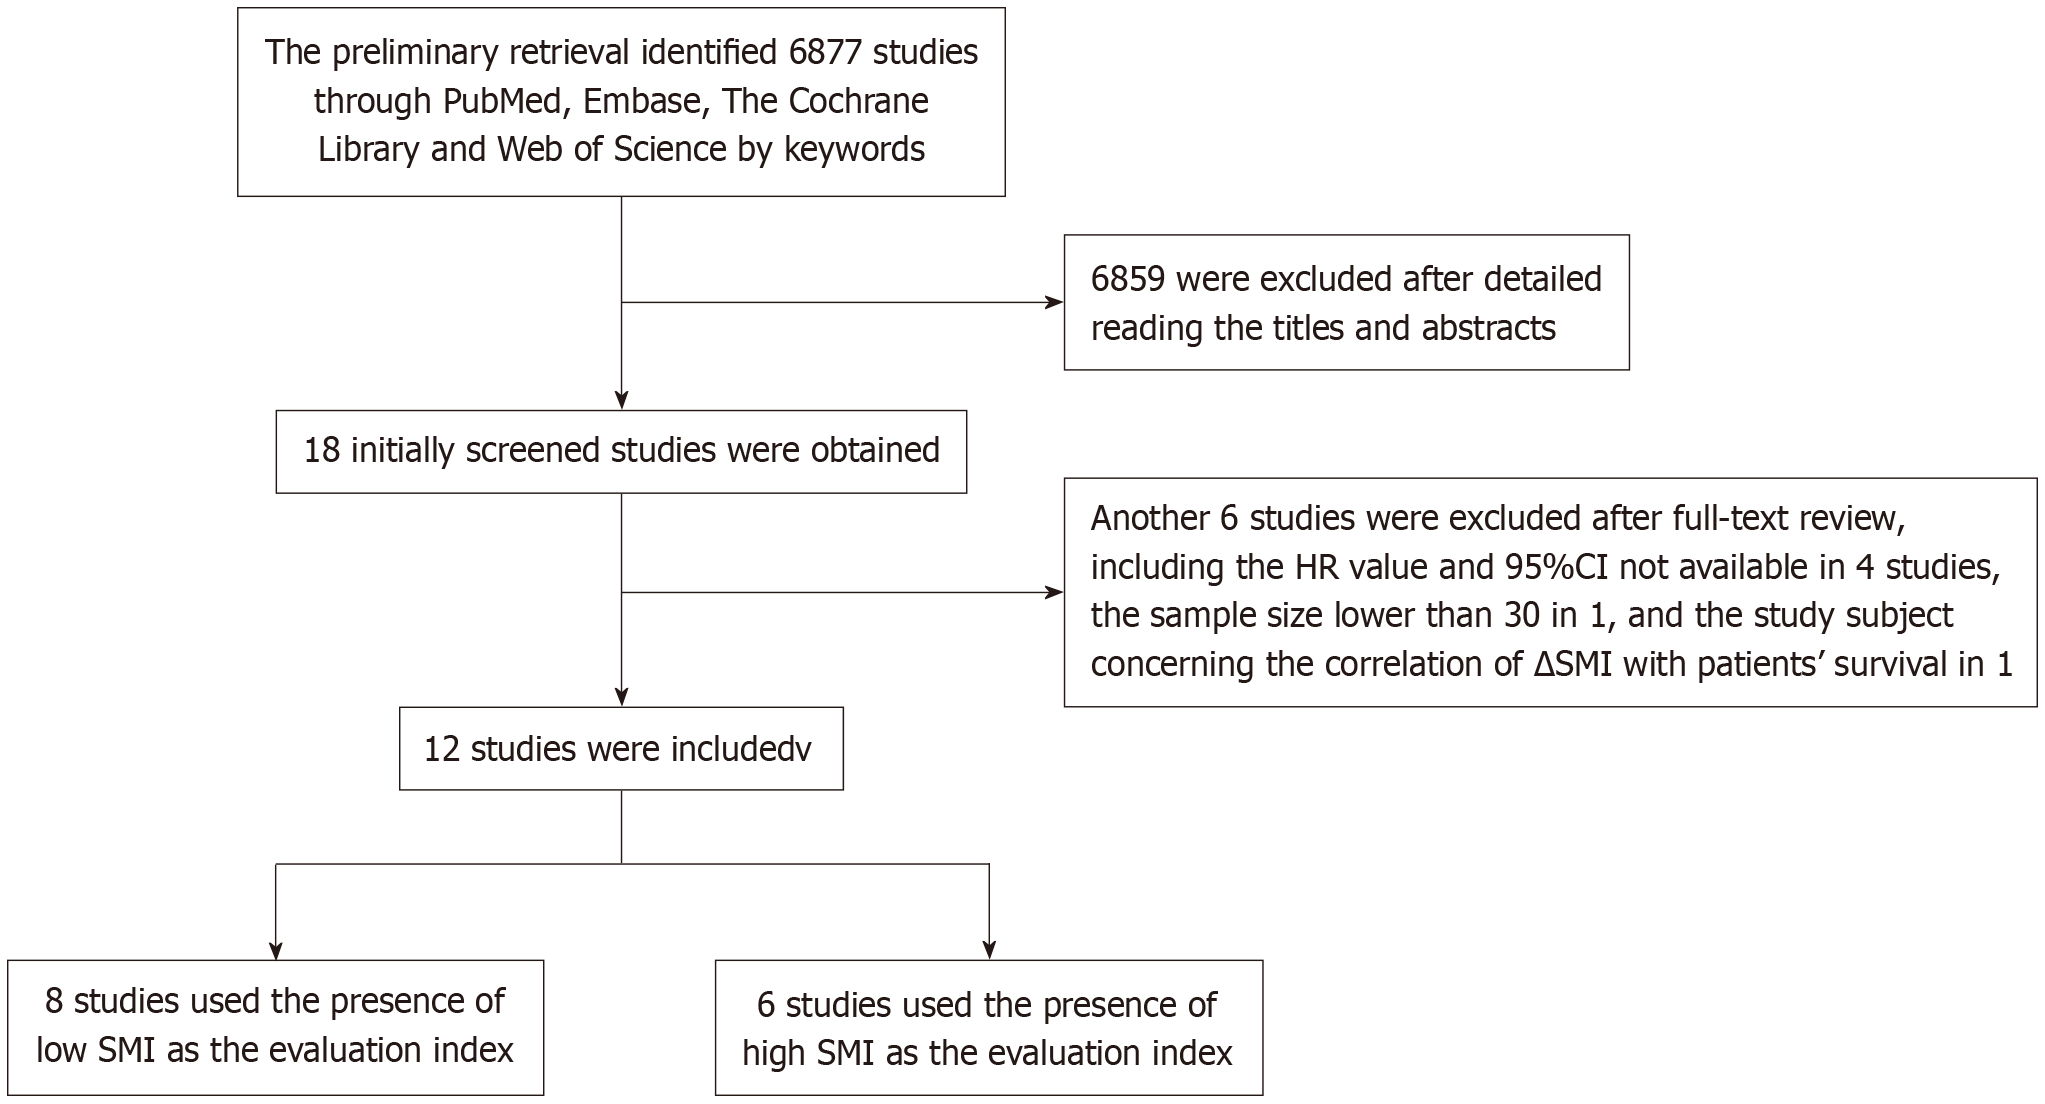
Figure 1 Flow chart of literature screening.
SMI: Skeletal muscle index; HR: Hazard ratio; CI: Confidence interval.
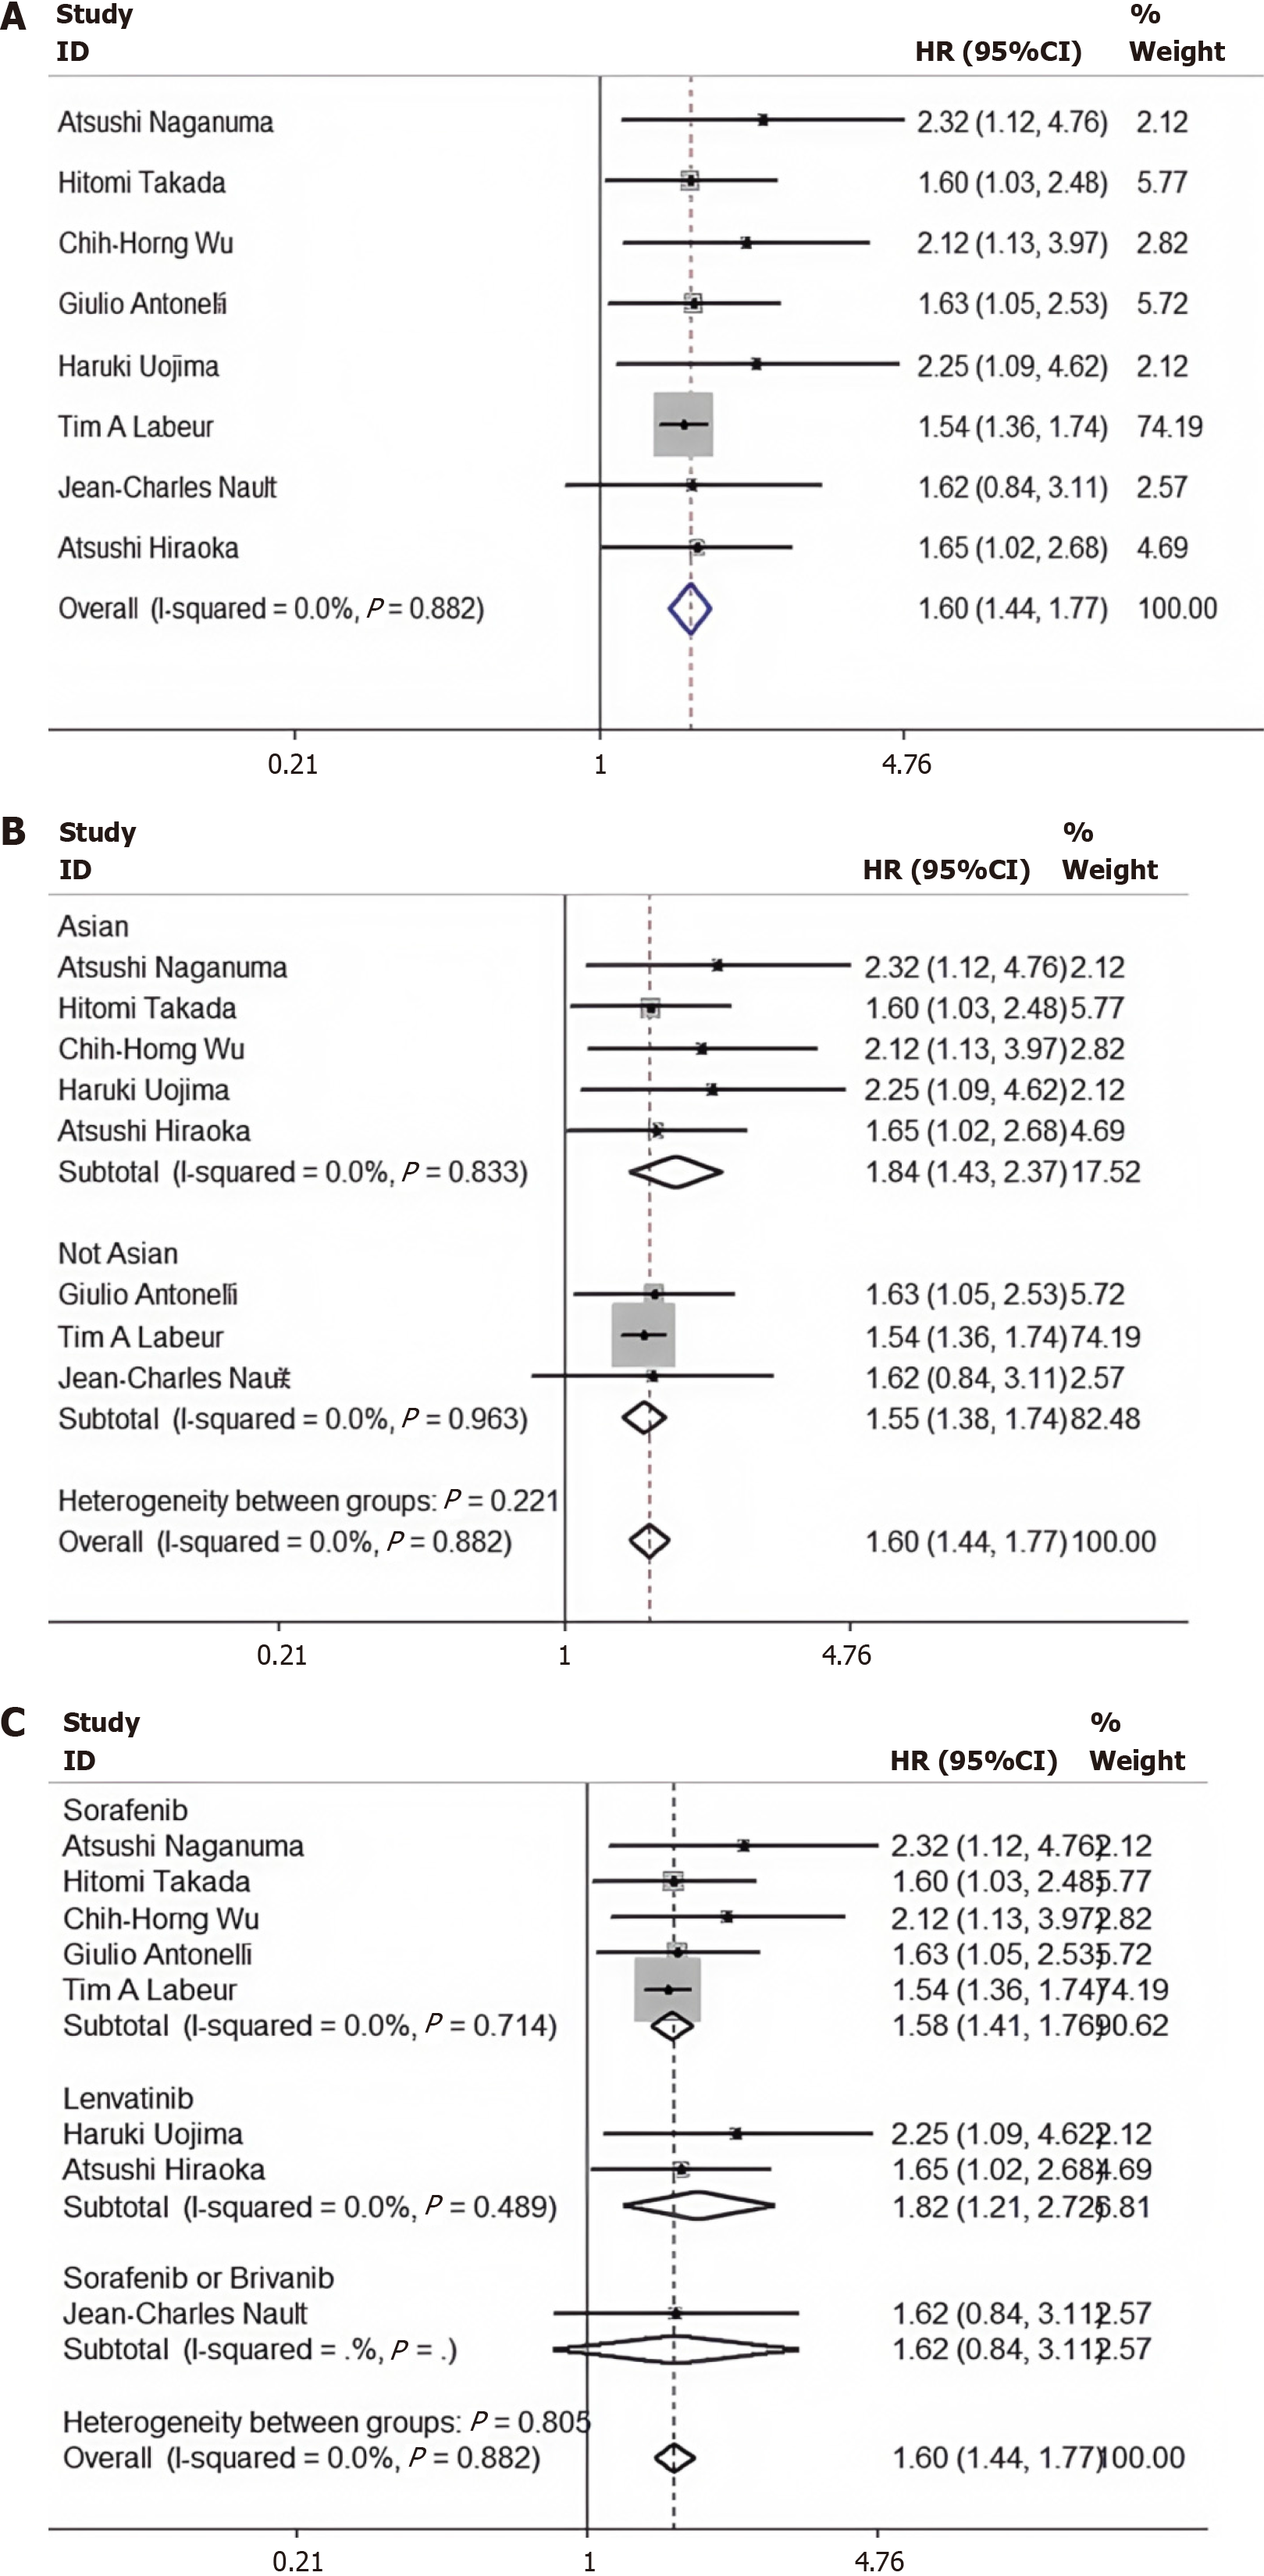
Figure 2 Forest plots comparing overall survival of patients with liver cancer treated with targeted drugs between the two groups, low skeletal muscle index group vs non-low skeletal muscle index group.
A: Forest plot of overall survival of two groups of patients with liver cancer; B: Subgroup analysis of ethnicity in two groups of patient with liver cancer; C: Subgroup analysis of targeted drug in two groups of patients with liver cancer. HR: Hazard ratio; CI: Confidence interval.
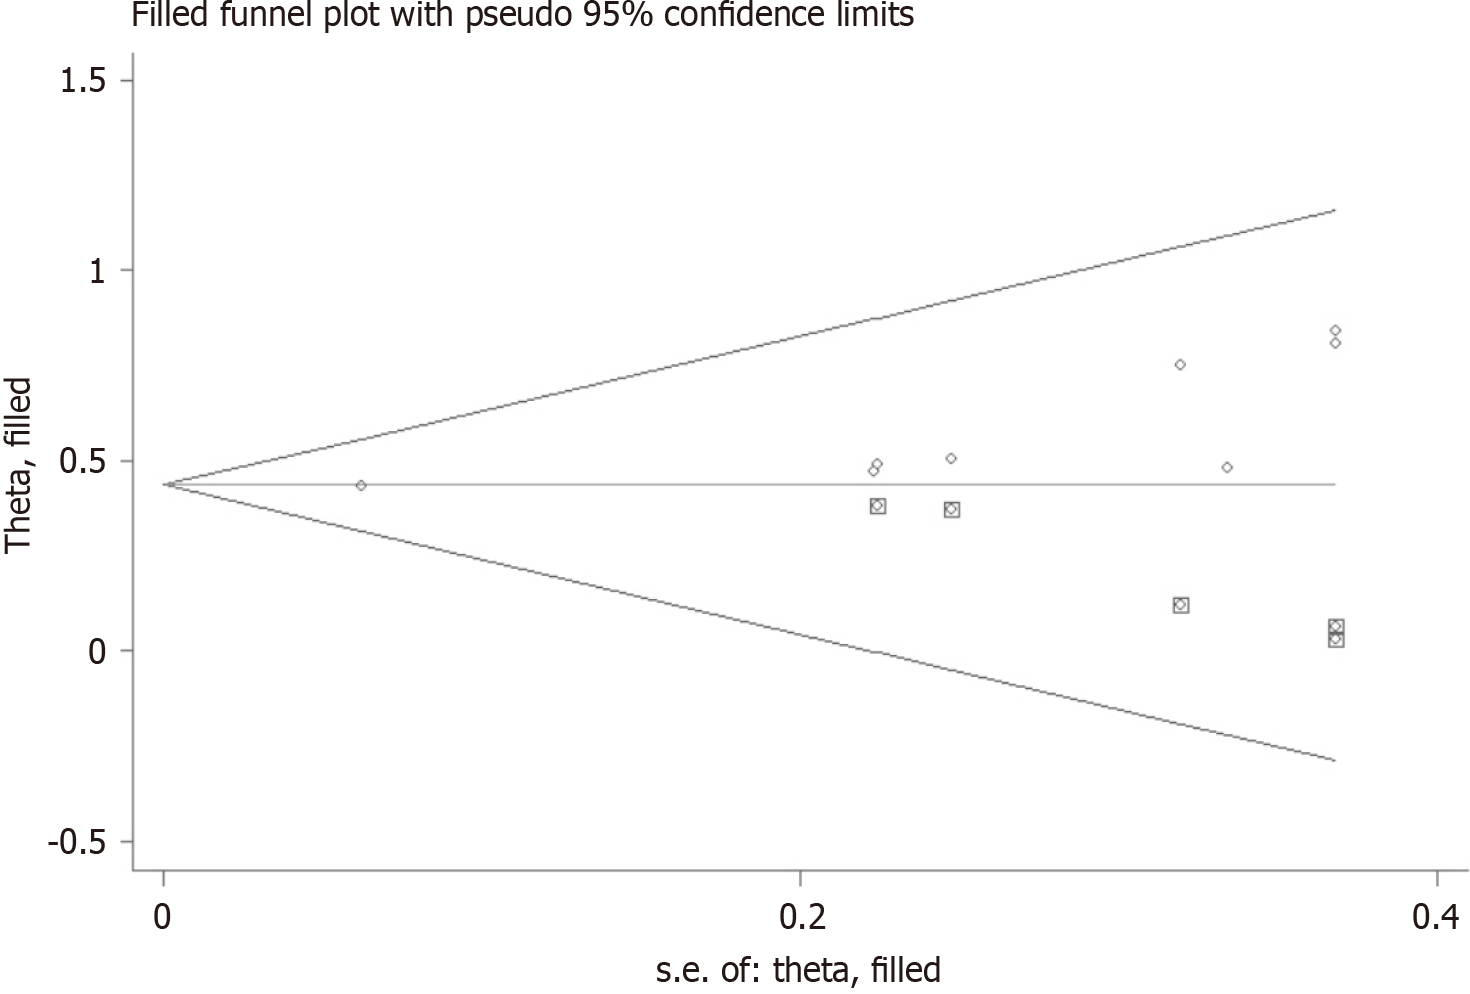
Figure 3 Funnel plot after applying a trim-and-fill method.
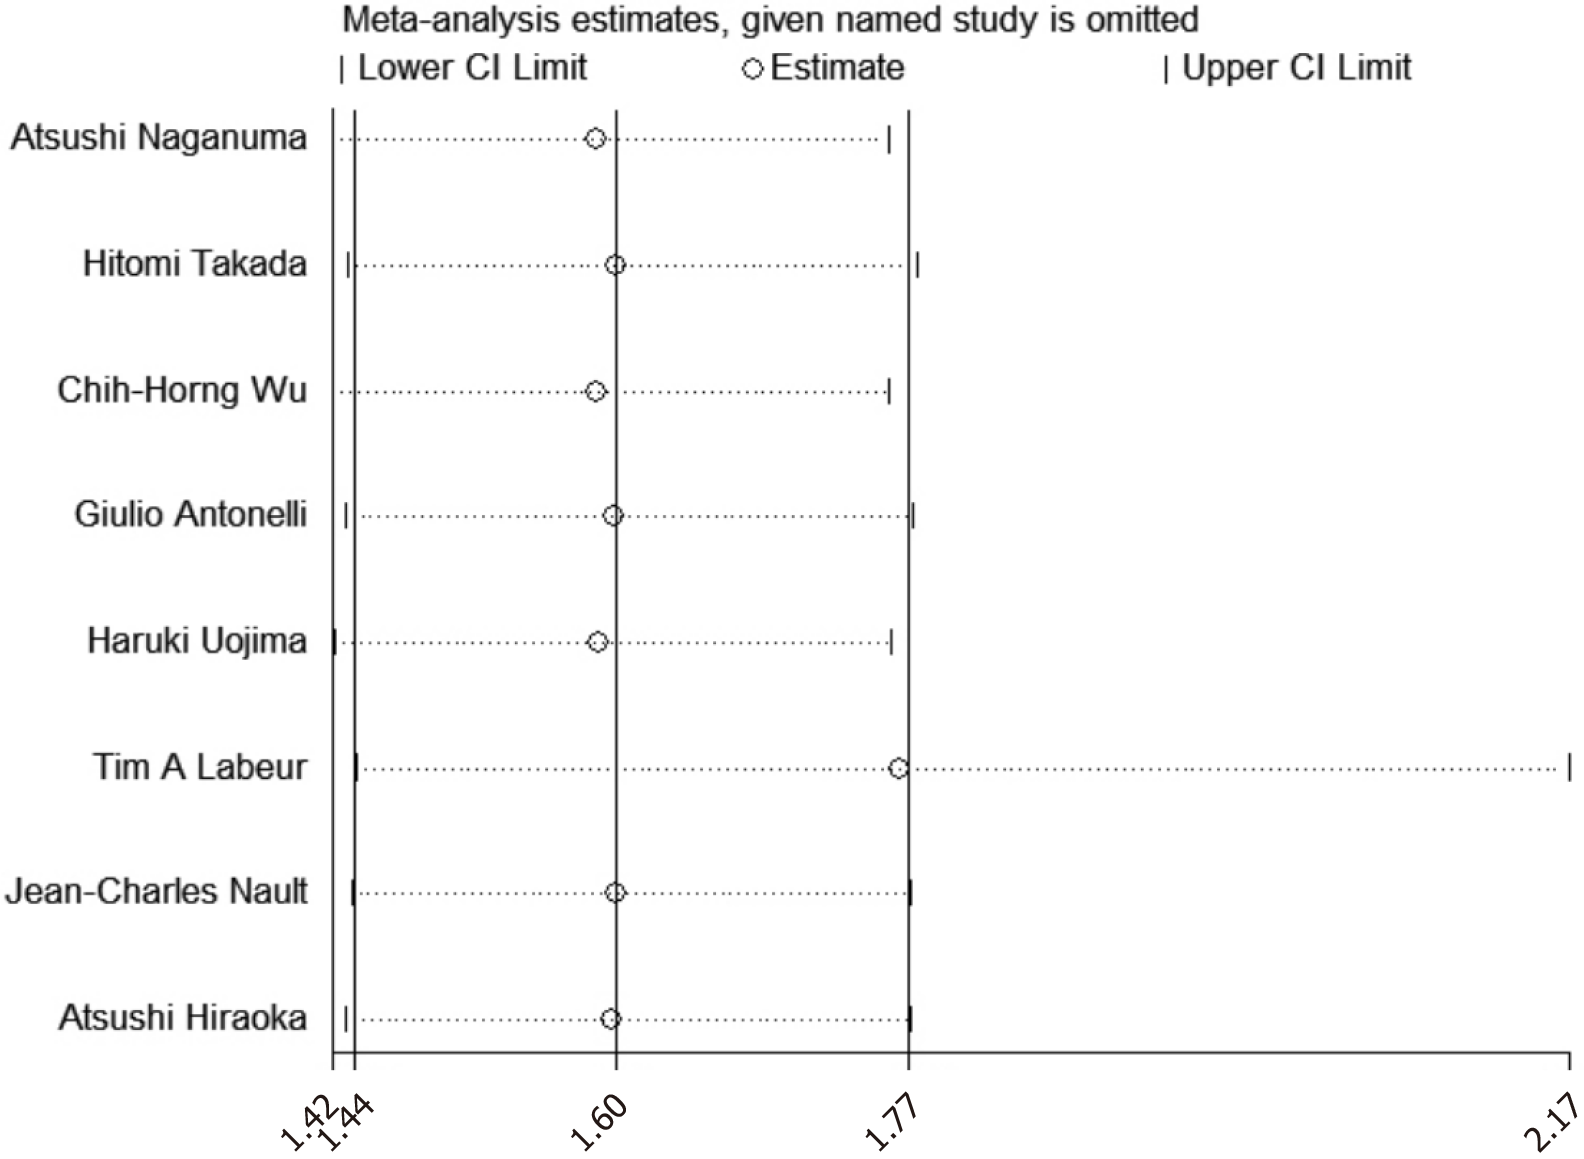
Figure 4 Sensitivity analysis of overall survival of two groups of patients with liver cancer.
CI: Confidence interval.
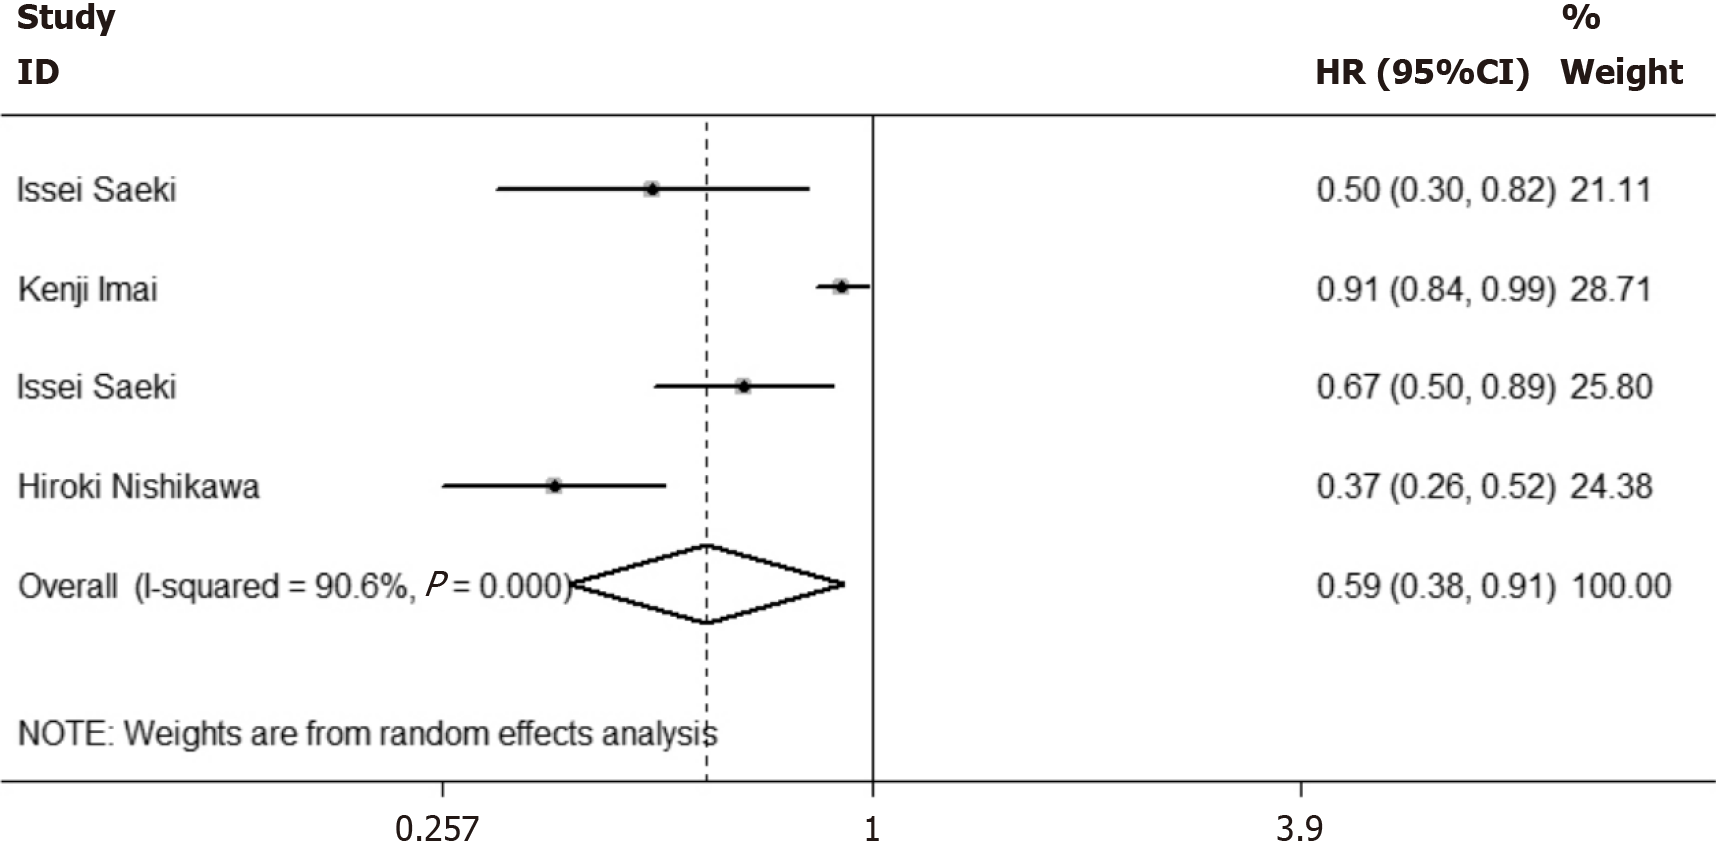
Figure 5 Forest plot comparing overall survival of patients with liver cancer treated with targeted drugs between the two groups, non-low skeletal muscle index group vs low skeletal muscle index group.
HR: Hazard ratio; CI: Confidence interval.
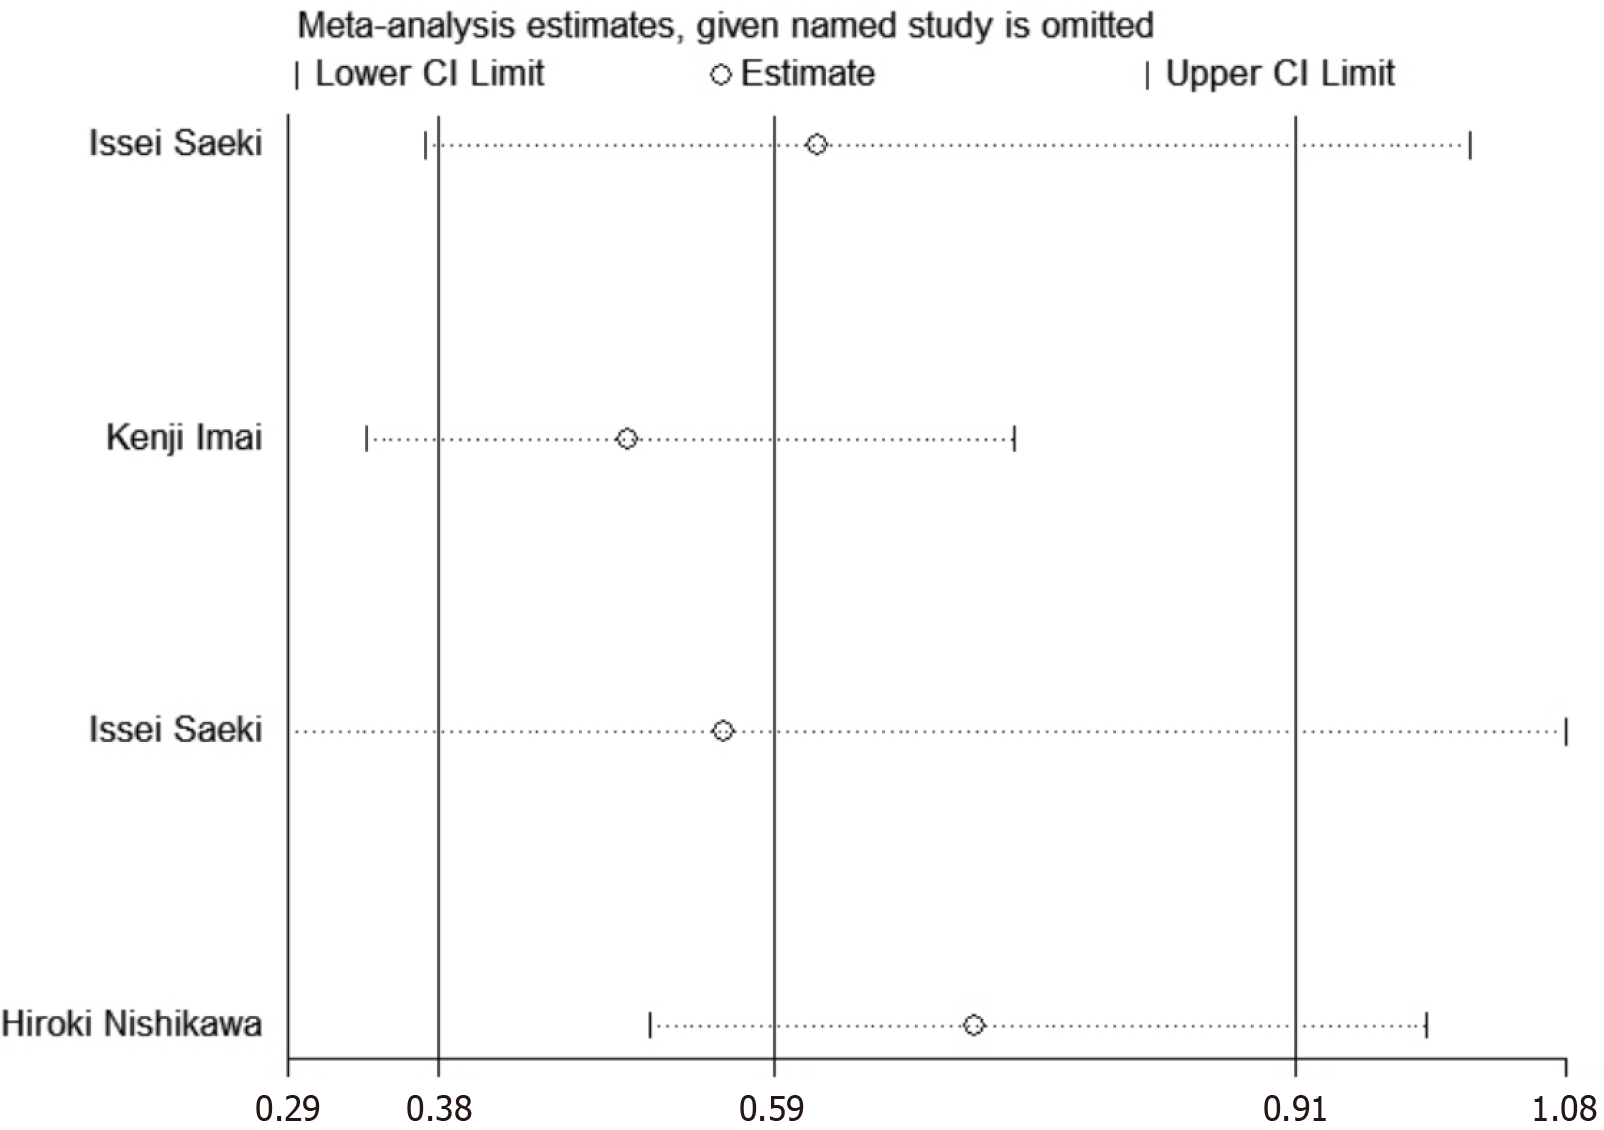
Figure 6 Sensitivity analysis of overall survival of two groups of patients with liver cancer.
CI: Confidence interval.
- Citation: Wan LH, Mao BJ, Wang B. Relationship between skeletal muscle mass and prognosis in patients with liver cancer receiving targeted therapy: A meta-analysis. World J Clin Oncol 2025; 16(5): 102611
- URL: https://www.wjgnet.com/2218-4333/full/v16/i5/102611.htm
- DOI: https://dx.doi.org/10.5306/wjco.v16.i5.102611


