Copyright
©The Author(s) 2024.
World J Clin Oncol. May 24, 2024; 15(5): 614-634
Published online May 24, 2024. doi: 10.5306/wjco.v15.i5.614
Published online May 24, 2024. doi: 10.5306/wjco.v15.i5.614
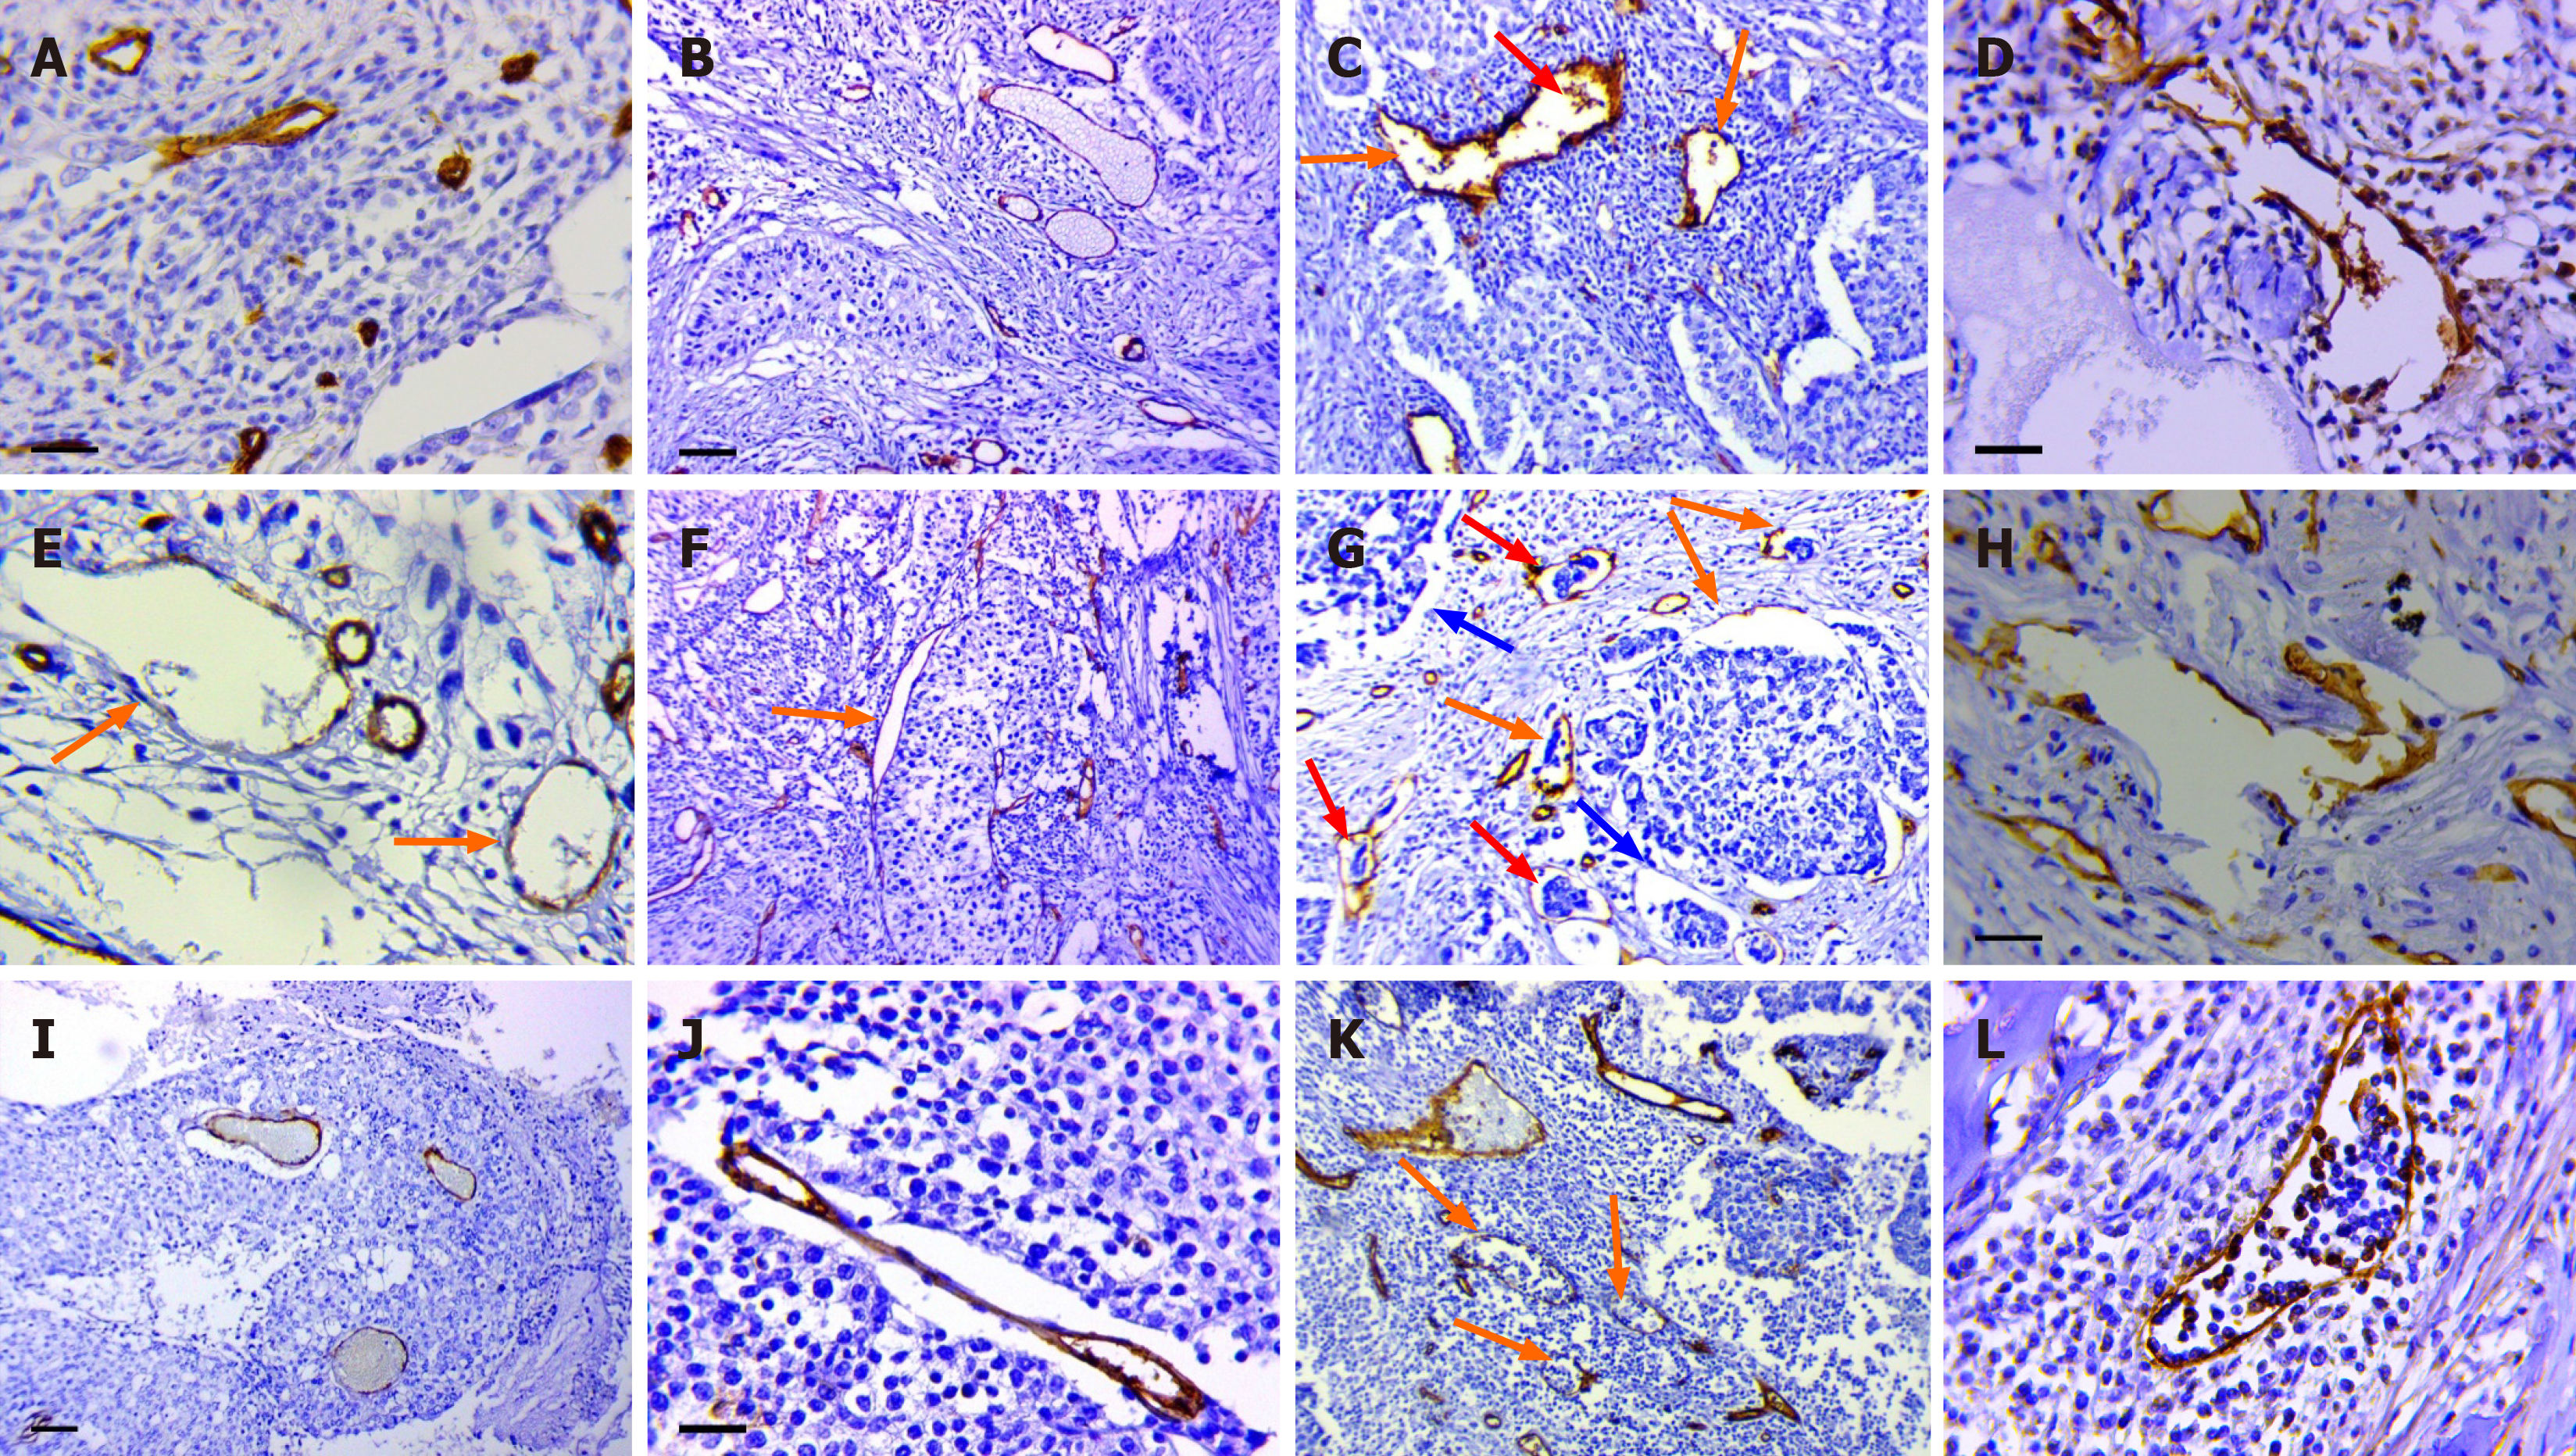
Figure 1 Different types of tumor microvessels.
A: Normal microvessels. Scale bar = 10 μm; B: Dilated capillaries (DCs). Scale bar = 100 μm; C: Atypical DCs with tumor emboli (orange arrows) and cluster of differentiation 34 (CD34)-positive cells (red arrow) in their lumen, Scale bar = 100 μm; D: Lymphatic capillary with the chaotic arrangement of the endothelial cells. Scale bar = 10 μm; E: DCs with weak expression of CD34 (orange arrows). Scale bar = 10 μm; F: Contact-type DCs (orange arrow). Scale bar = 100 μm; G: Structures with partial endothelial lining (type 1, orange arrows), structures without endothelial lining (blue arrows) and vessels with complexes of tumor cells in their lumen (red arrows). Scale bar = 100 μm; H: Structures with partial endothelial lining (type 2). Scale bar = 10 μm; I: Capillaries in the tumor solid component (type 1). Scale bar = 100 μm; J: Capillaries in the tumor solid component (type 2). Scale bar = 10 μm; K: Lymphatic capillary in lymphoid and polymorphic cell infiltrates. Scale bar = 100 μm; L: Lymphatic capillary in lymphoid and polymorphic cell infiltrates. Scale bar = 10 μm scale; A-C, E-K: Staining with antibodies against CD34; D and L: Staining with antibodies against PDPN.
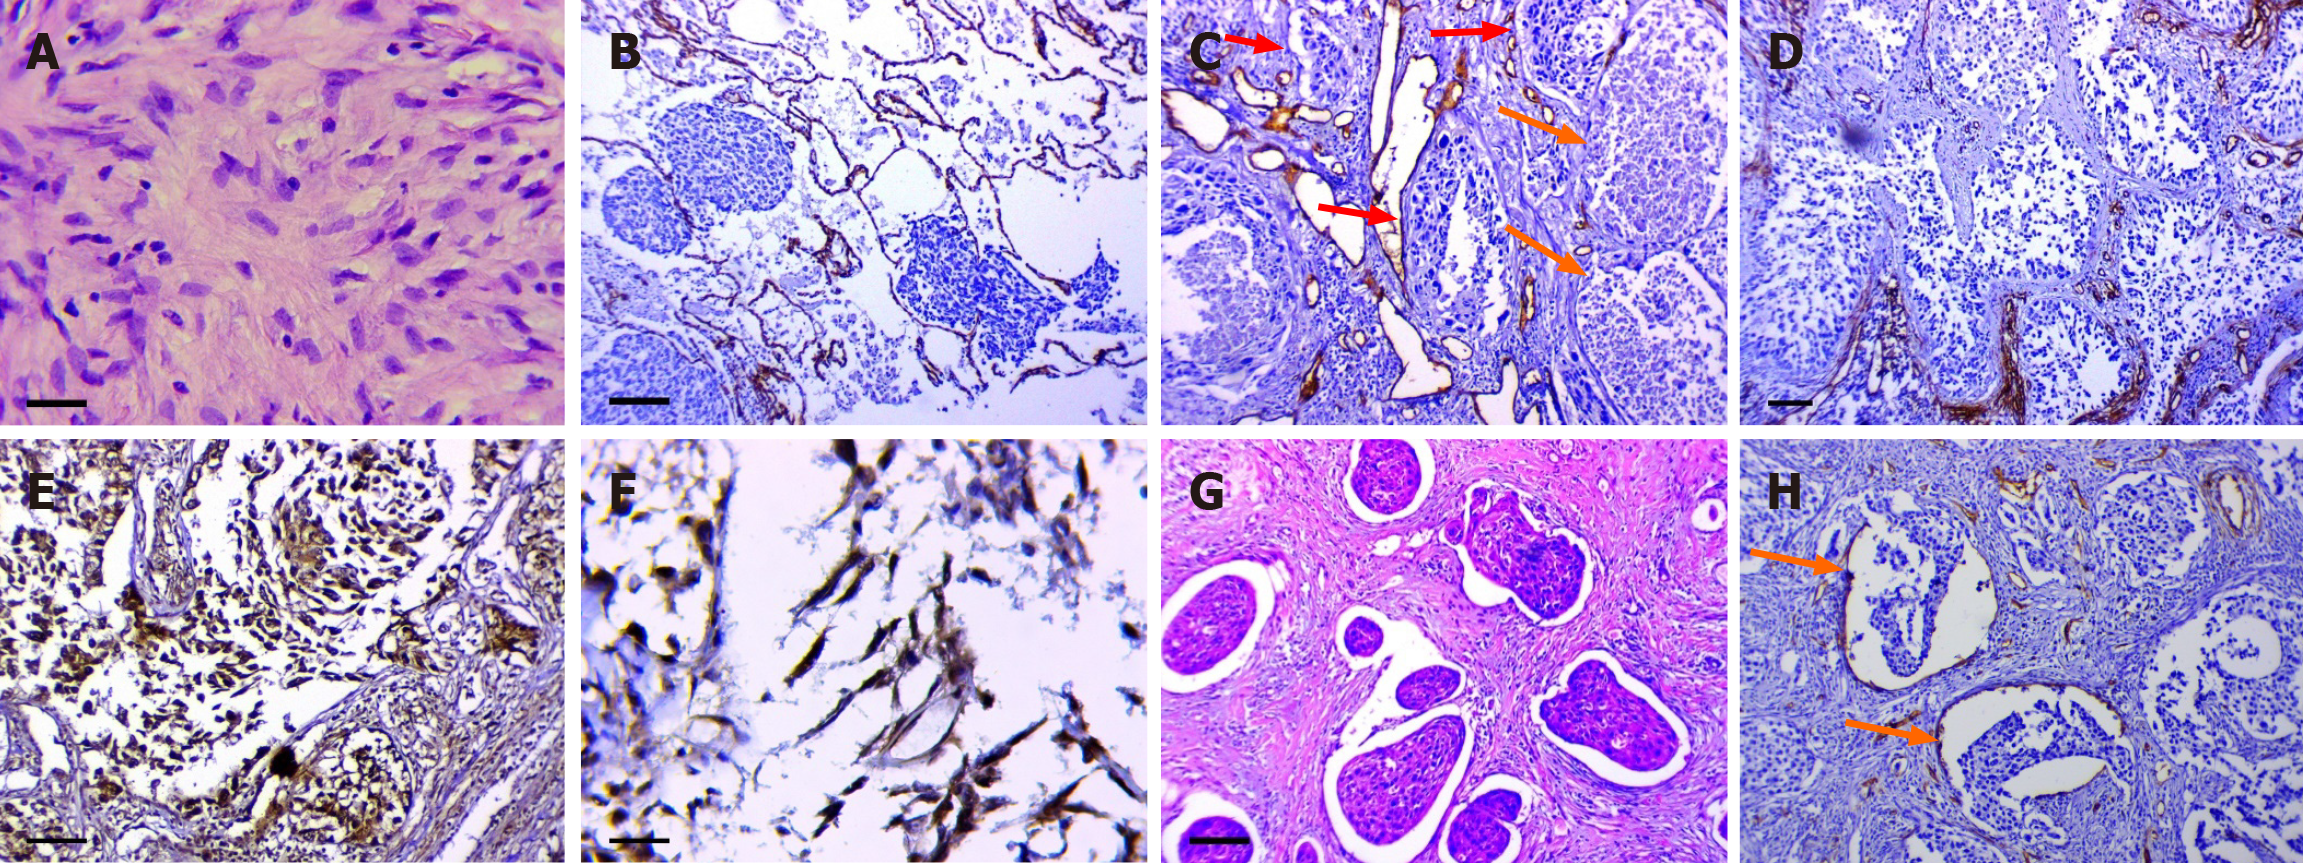
Figure 2 Features of parenchymal and stromal tumor components.
A: Loose, fine fibrous connective tissue in the tumor stroma. Scale bar = 10 μm; B: Tumor spread through the unchanged alveolar air spaces (AASs). Scale bar = 100 μm; C: Spread of the relatively unchanged clusters of tumor cells (red arrows) and the completely necrotic tumor masses (orange arrows) through the AASs having thickened walls with dilated capillaries. Scale bar = 100 μm; D: Fragmentation of the tumor masses spreading through the AASs. Scale bar = 100 μm; E: Positive nuclear expression of hypoxia-inducible factor-1 alpha (HIF-1a) in fibroblast-like tumor cells. Scale bar = 10 μm; F: Positive nuclear expression of Snail in fibroblast-like tumor cells. Scale bar = 10 μm; G: Retraction clefts. Scale bar = 100 μm; H: Structures with partial endothelial lining (orange arrows). Scale bar = 100 μm. A and G: Mayer's hematoxylin and eosin staining; B, C and H: Staining with antibodies against cluster of differentiation 34; E: Staining with antibodies against HIF-1a; F: Staining with antibodies against Snail.
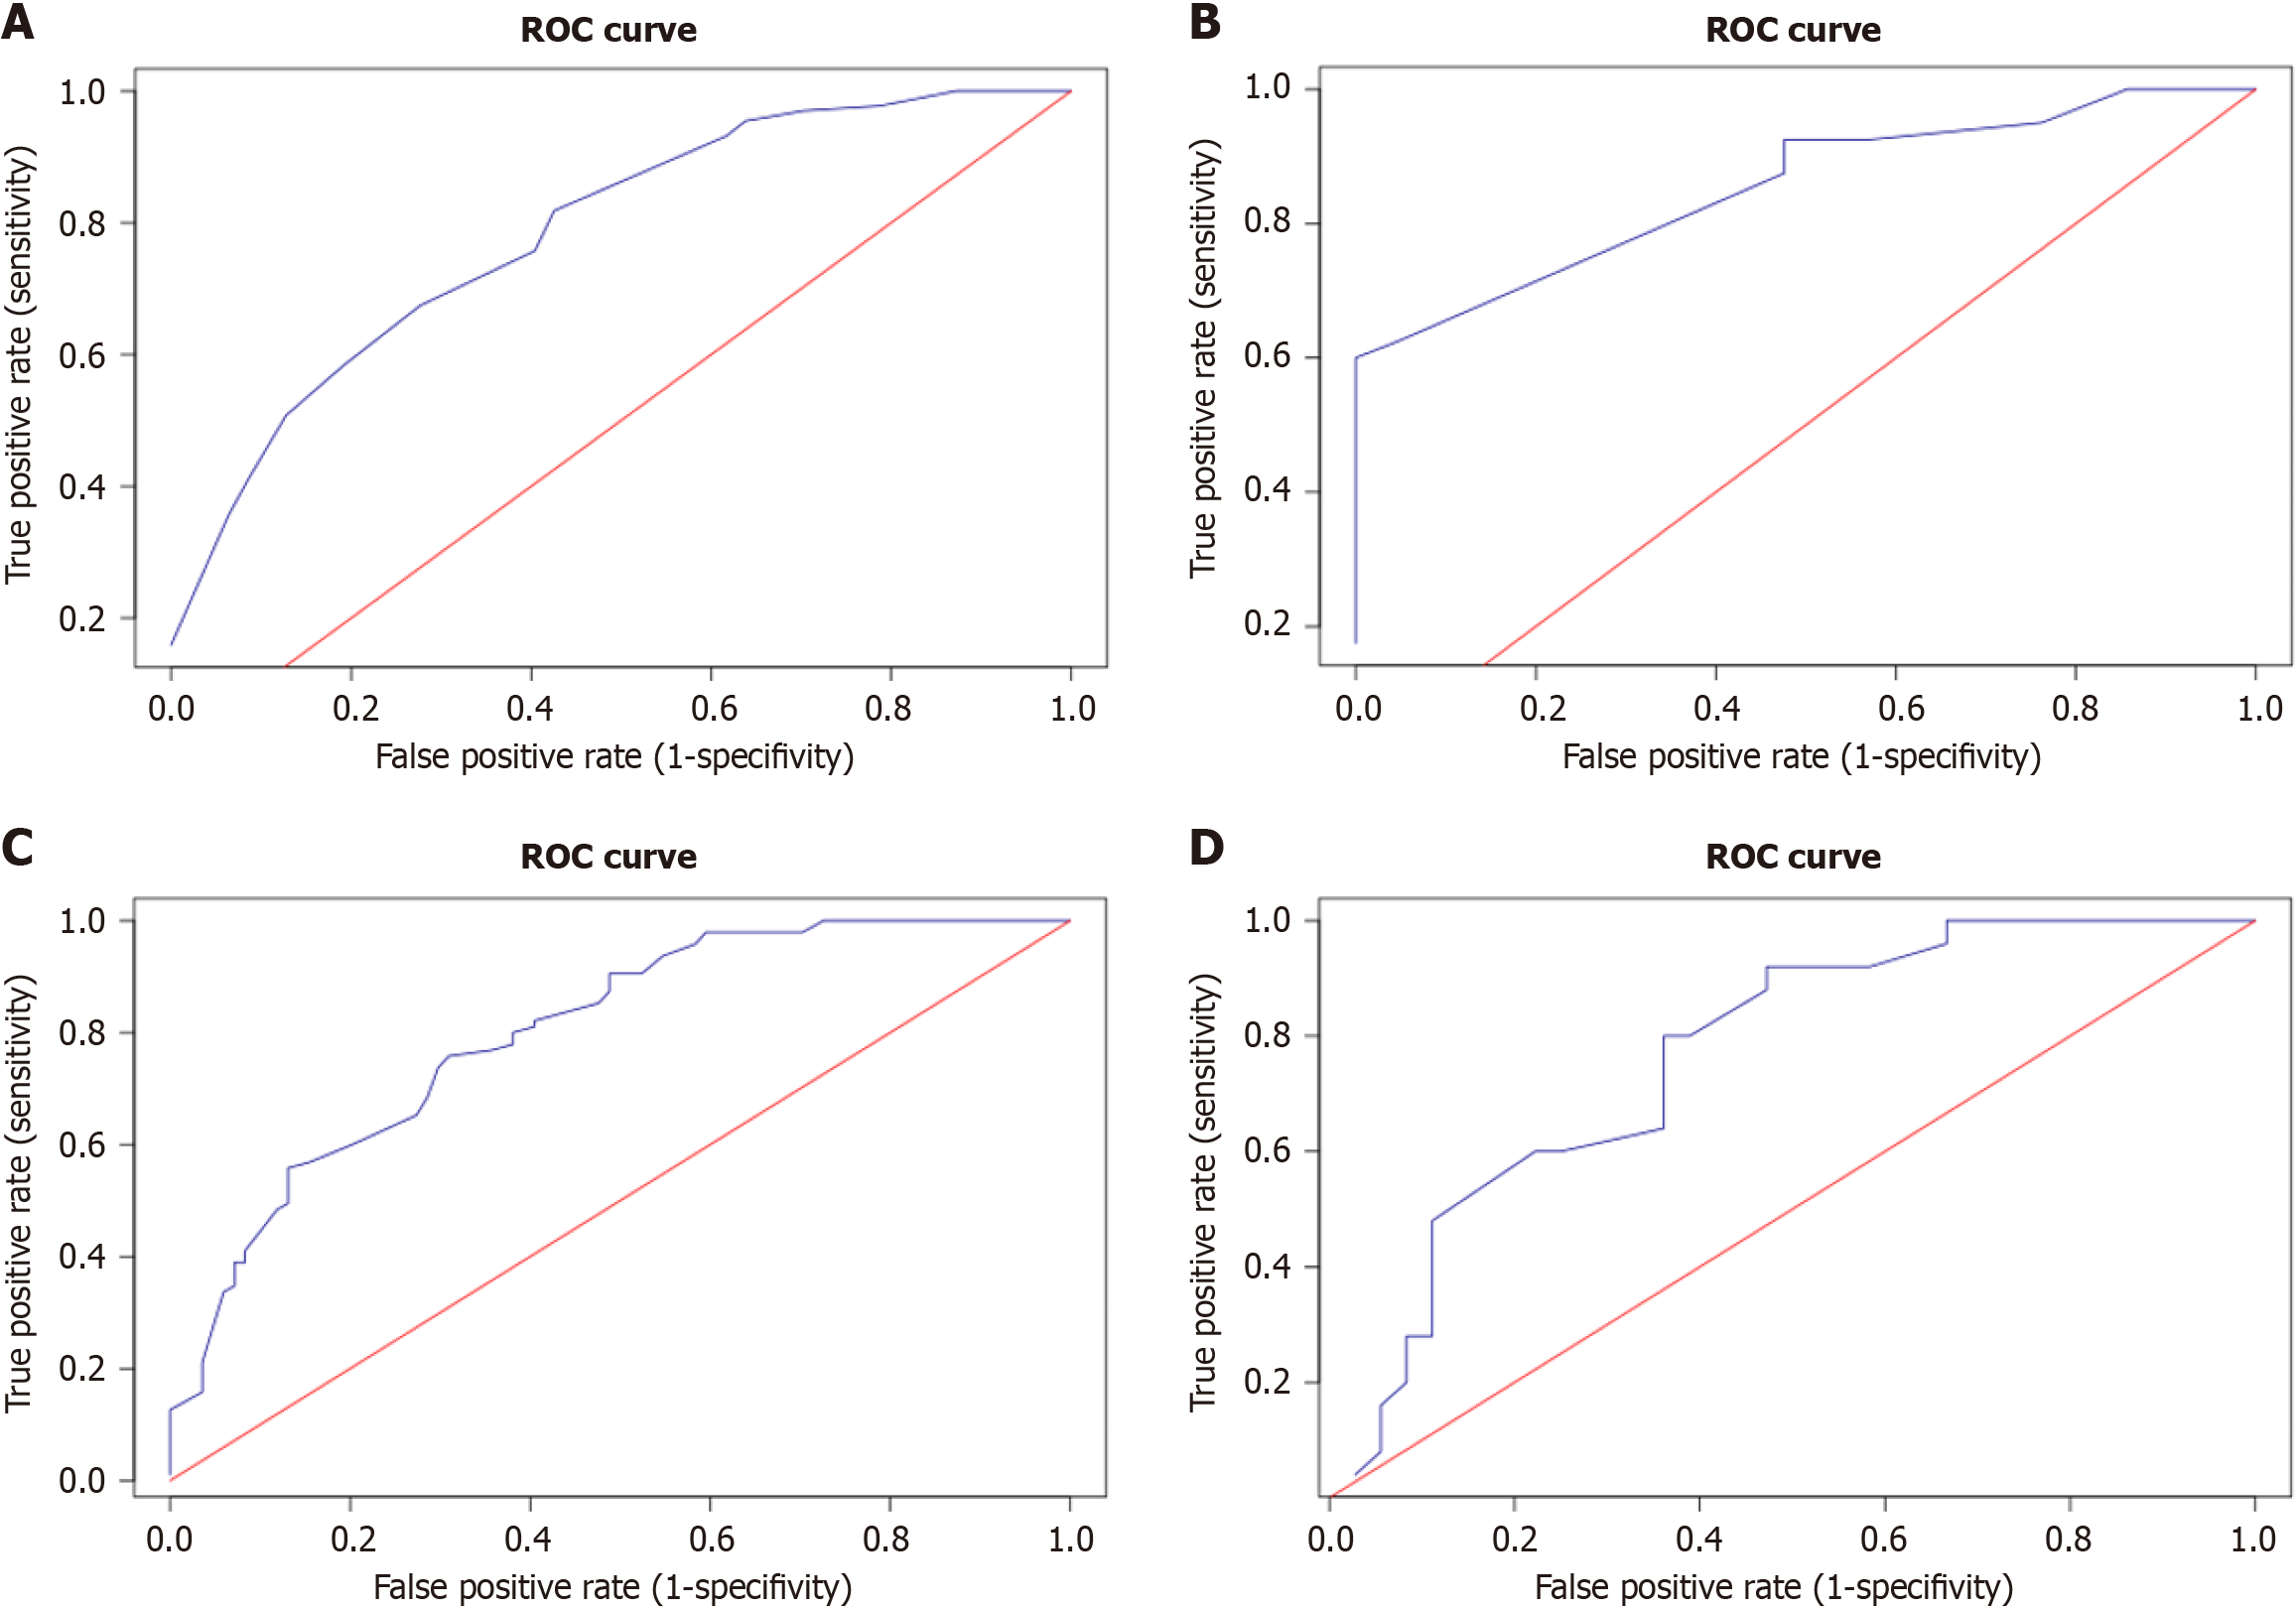
Figure 3 Receiver operating characteristic curves discriminating between patients.
A and B: Receiver operating characteristic (ROC) curves discriminating between patients with and without regional lymph node metastases. ROC curve for the main cohort (A); ROC curve for the training cohort (B); C and D: ROC curves discriminating between patients with and without disease recurrence. ROC curve for the main cohort (C); ROC curve for the training cohort (D). ROC: Receiver operating characteristic.
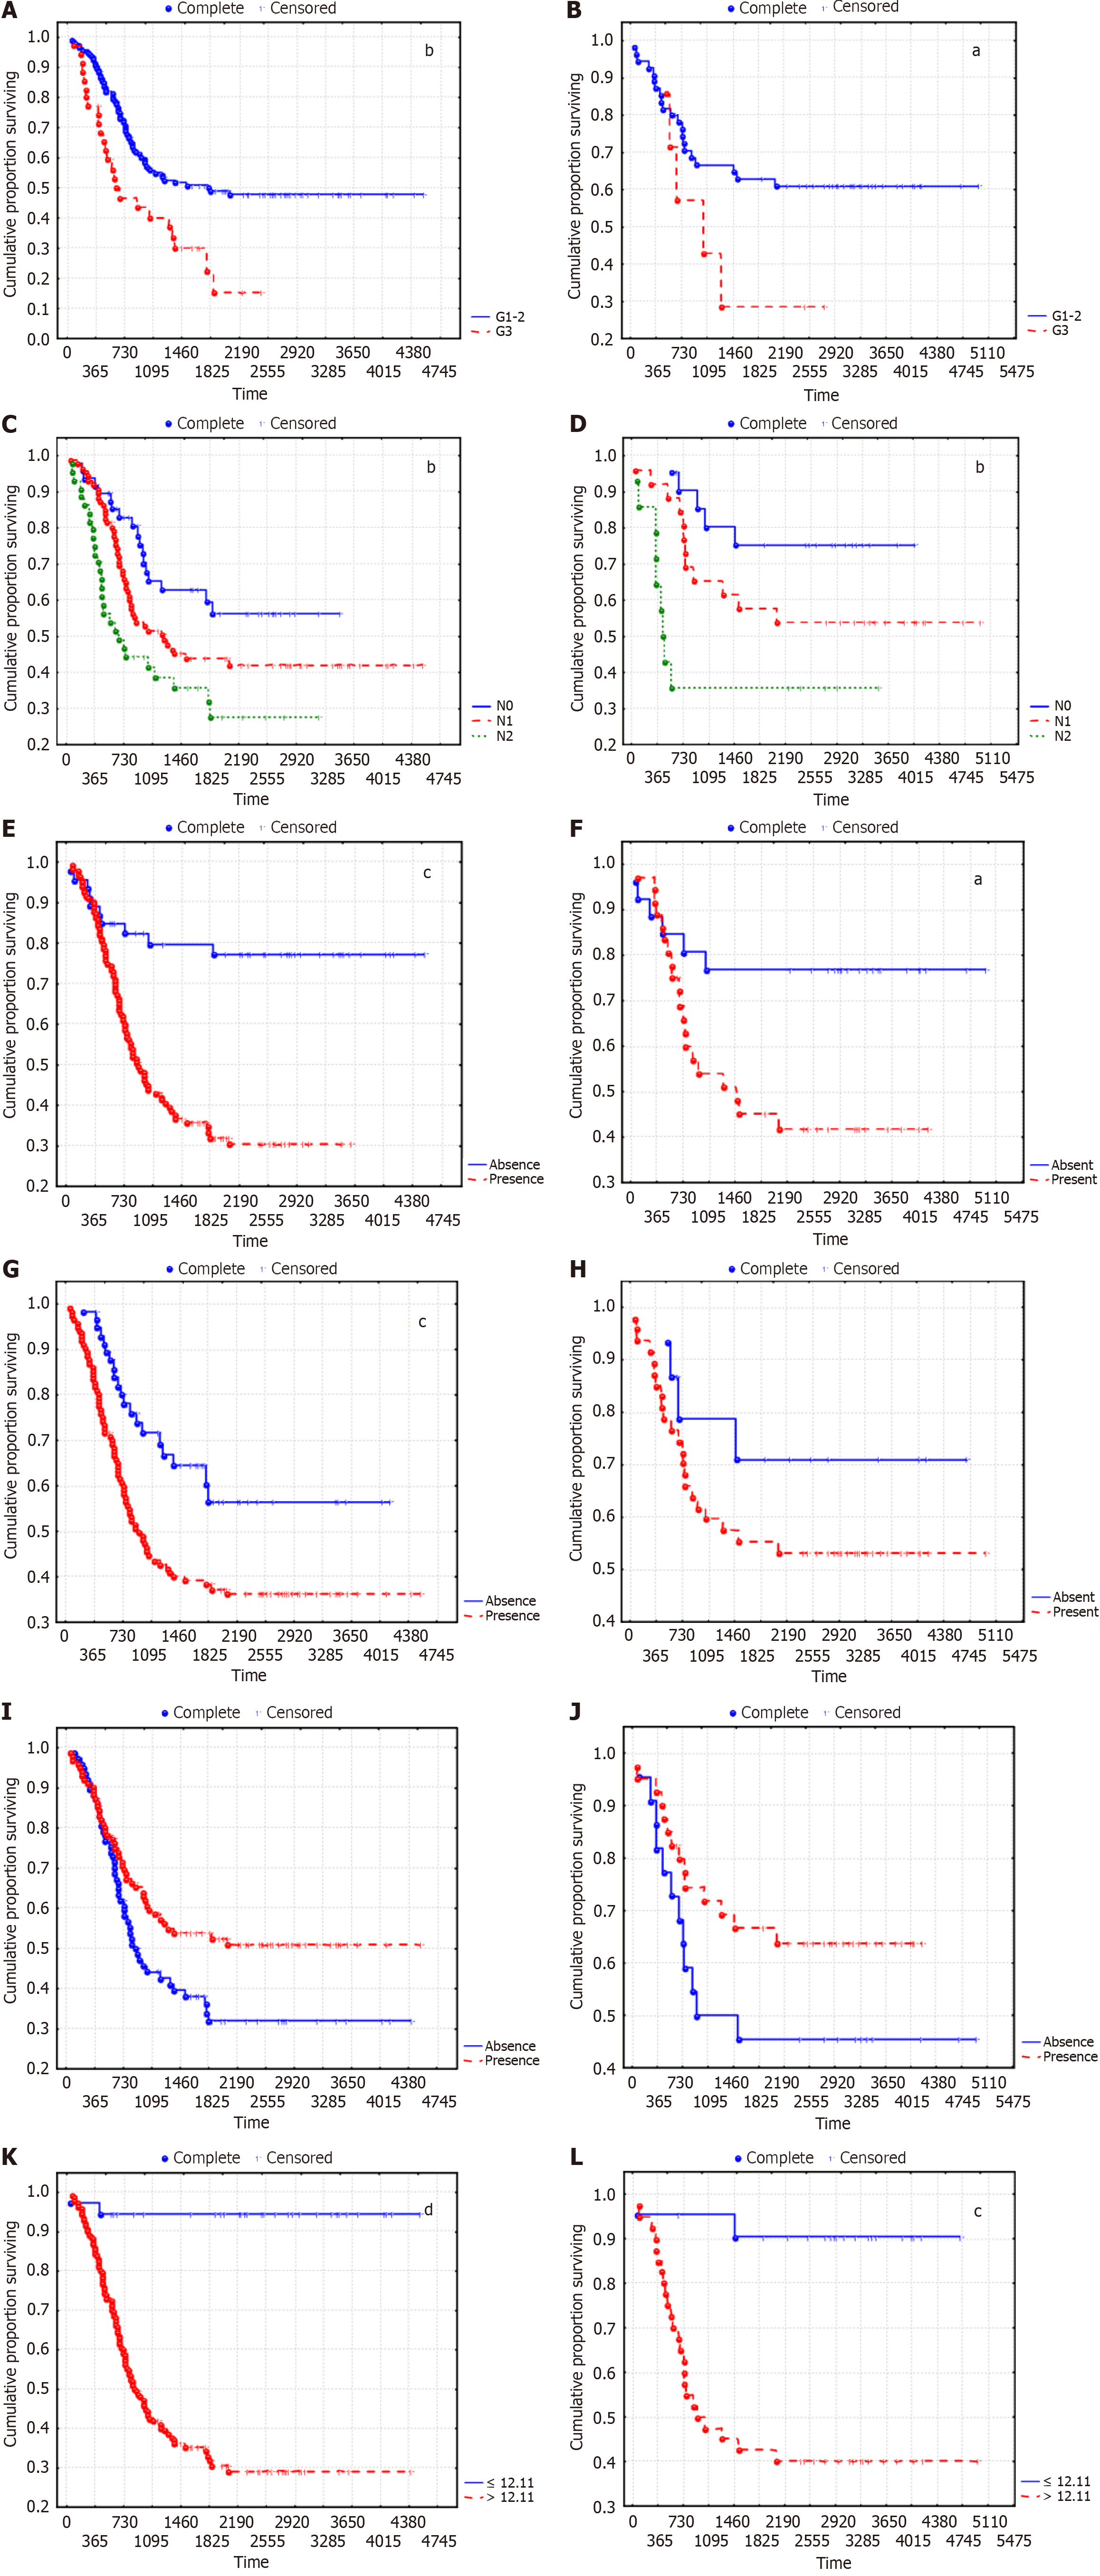
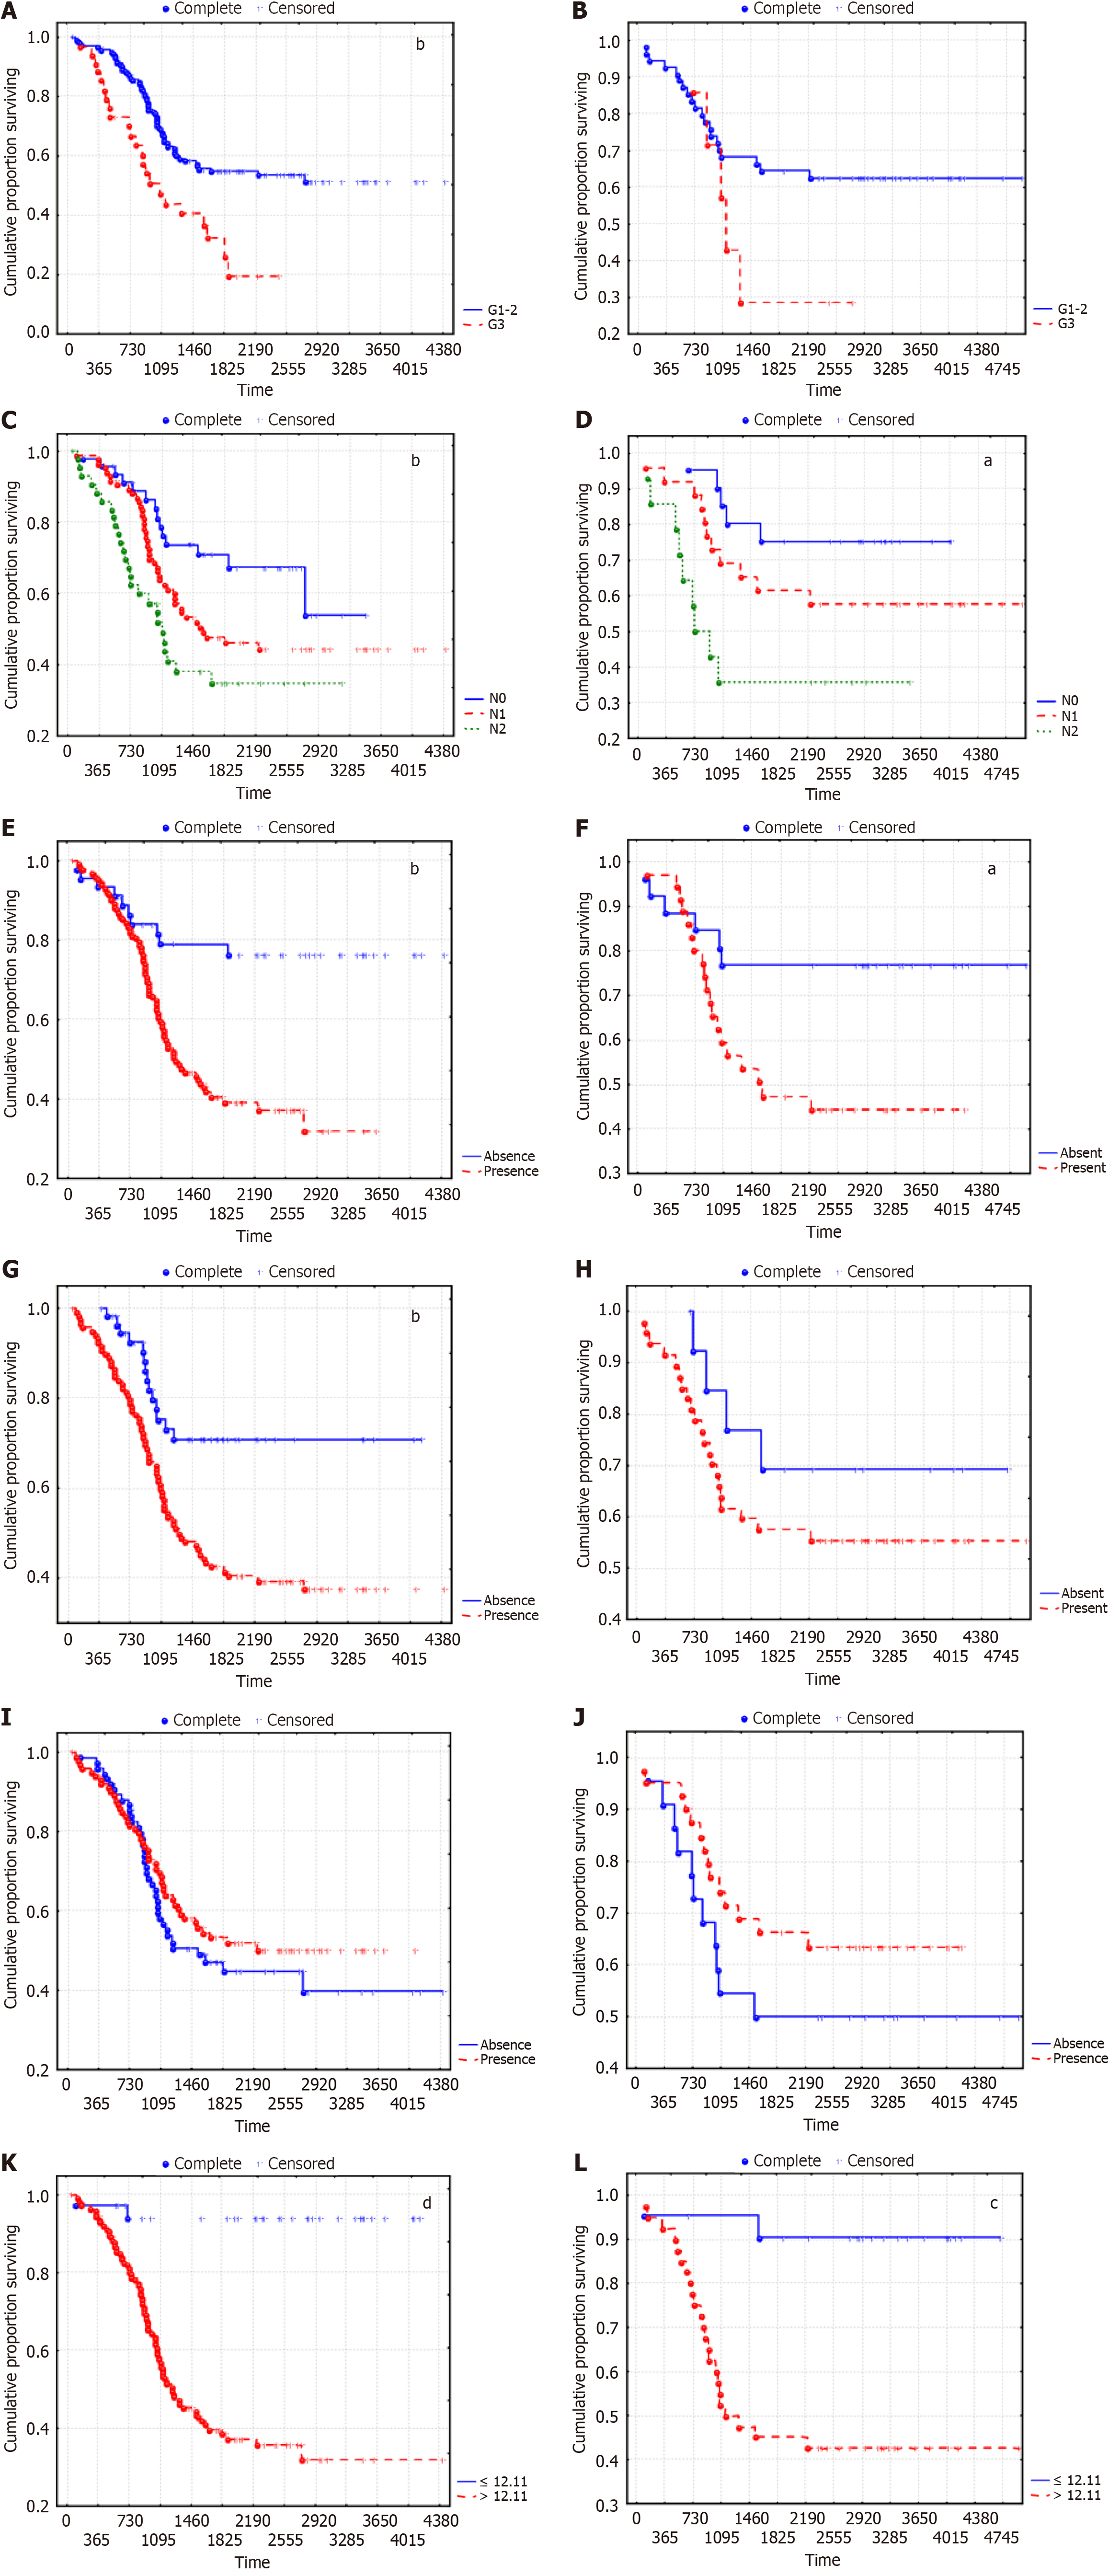
Figure 4 Disease-free survival curves according to the independent predictors of lung squamous cell carcinoma recurrence risk (log-rank test).
A and B: Tumor grade; C and D: N stage; E and F: Loose, fine fibrous connective tissue; G and H: Fragmentation of the tumor solid component; I and J: Tumor spread through the alveolar air spaces; K and L: Odds ratio sum (ORS) ≤ 12.11 or ORS > 12.11. A, C, E, G, I and K: Recurrence free survival (RFS) curves for the main cohort of patients; B, D, F, H, J and L: RFS curves for the training cohort of patients. aP < 0.05, bP < 0.01, cP < 0.001, dP < 0.0001.
Figure 5 Overall survival curves according to the independent predictors of lung squamous cell carcinoma recurrence risk (log-rank test).
A and B: Tumor grade; C and D: N stage; E and F: Loose, fine fibrous connective tissue; G and H: Fragmentation of the tumor solid component; I and J: Tumor spread through the alveolar air spaces; K and L: Odds ratio sum (ORS) ≤ 12.11 or ORS > 12.11. A, C, E, G, I and L: Overall survival (OS) curves for the main cohort of patients; B, D, F, H, J and L: OS curves for the training cohort of patients. aP < 0.05, bP < 0.01, cP < 0.001, dP < 0.0001.
- Citation: Senchukova MA, Kalinin EA, Volchenko NN. Different types of tumor microvessels in stage I-IIIA squamous cell lung cancer and their clinical significance. World J Clin Oncol 2024; 15(5): 614-634
- URL: https://www.wjgnet.com/2218-4333/full/v15/i5/614.htm
- DOI: https://dx.doi.org/10.5306/wjco.v15.i5.614


