Copyright
©The Author(s) 2022.
World J Clin Oncol. Jun 24, 2022; 13(6): 529-539
Published online Jun 24, 2022. doi: 10.5306/wjco.v13.i6.529
Published online Jun 24, 2022. doi: 10.5306/wjco.v13.i6.529
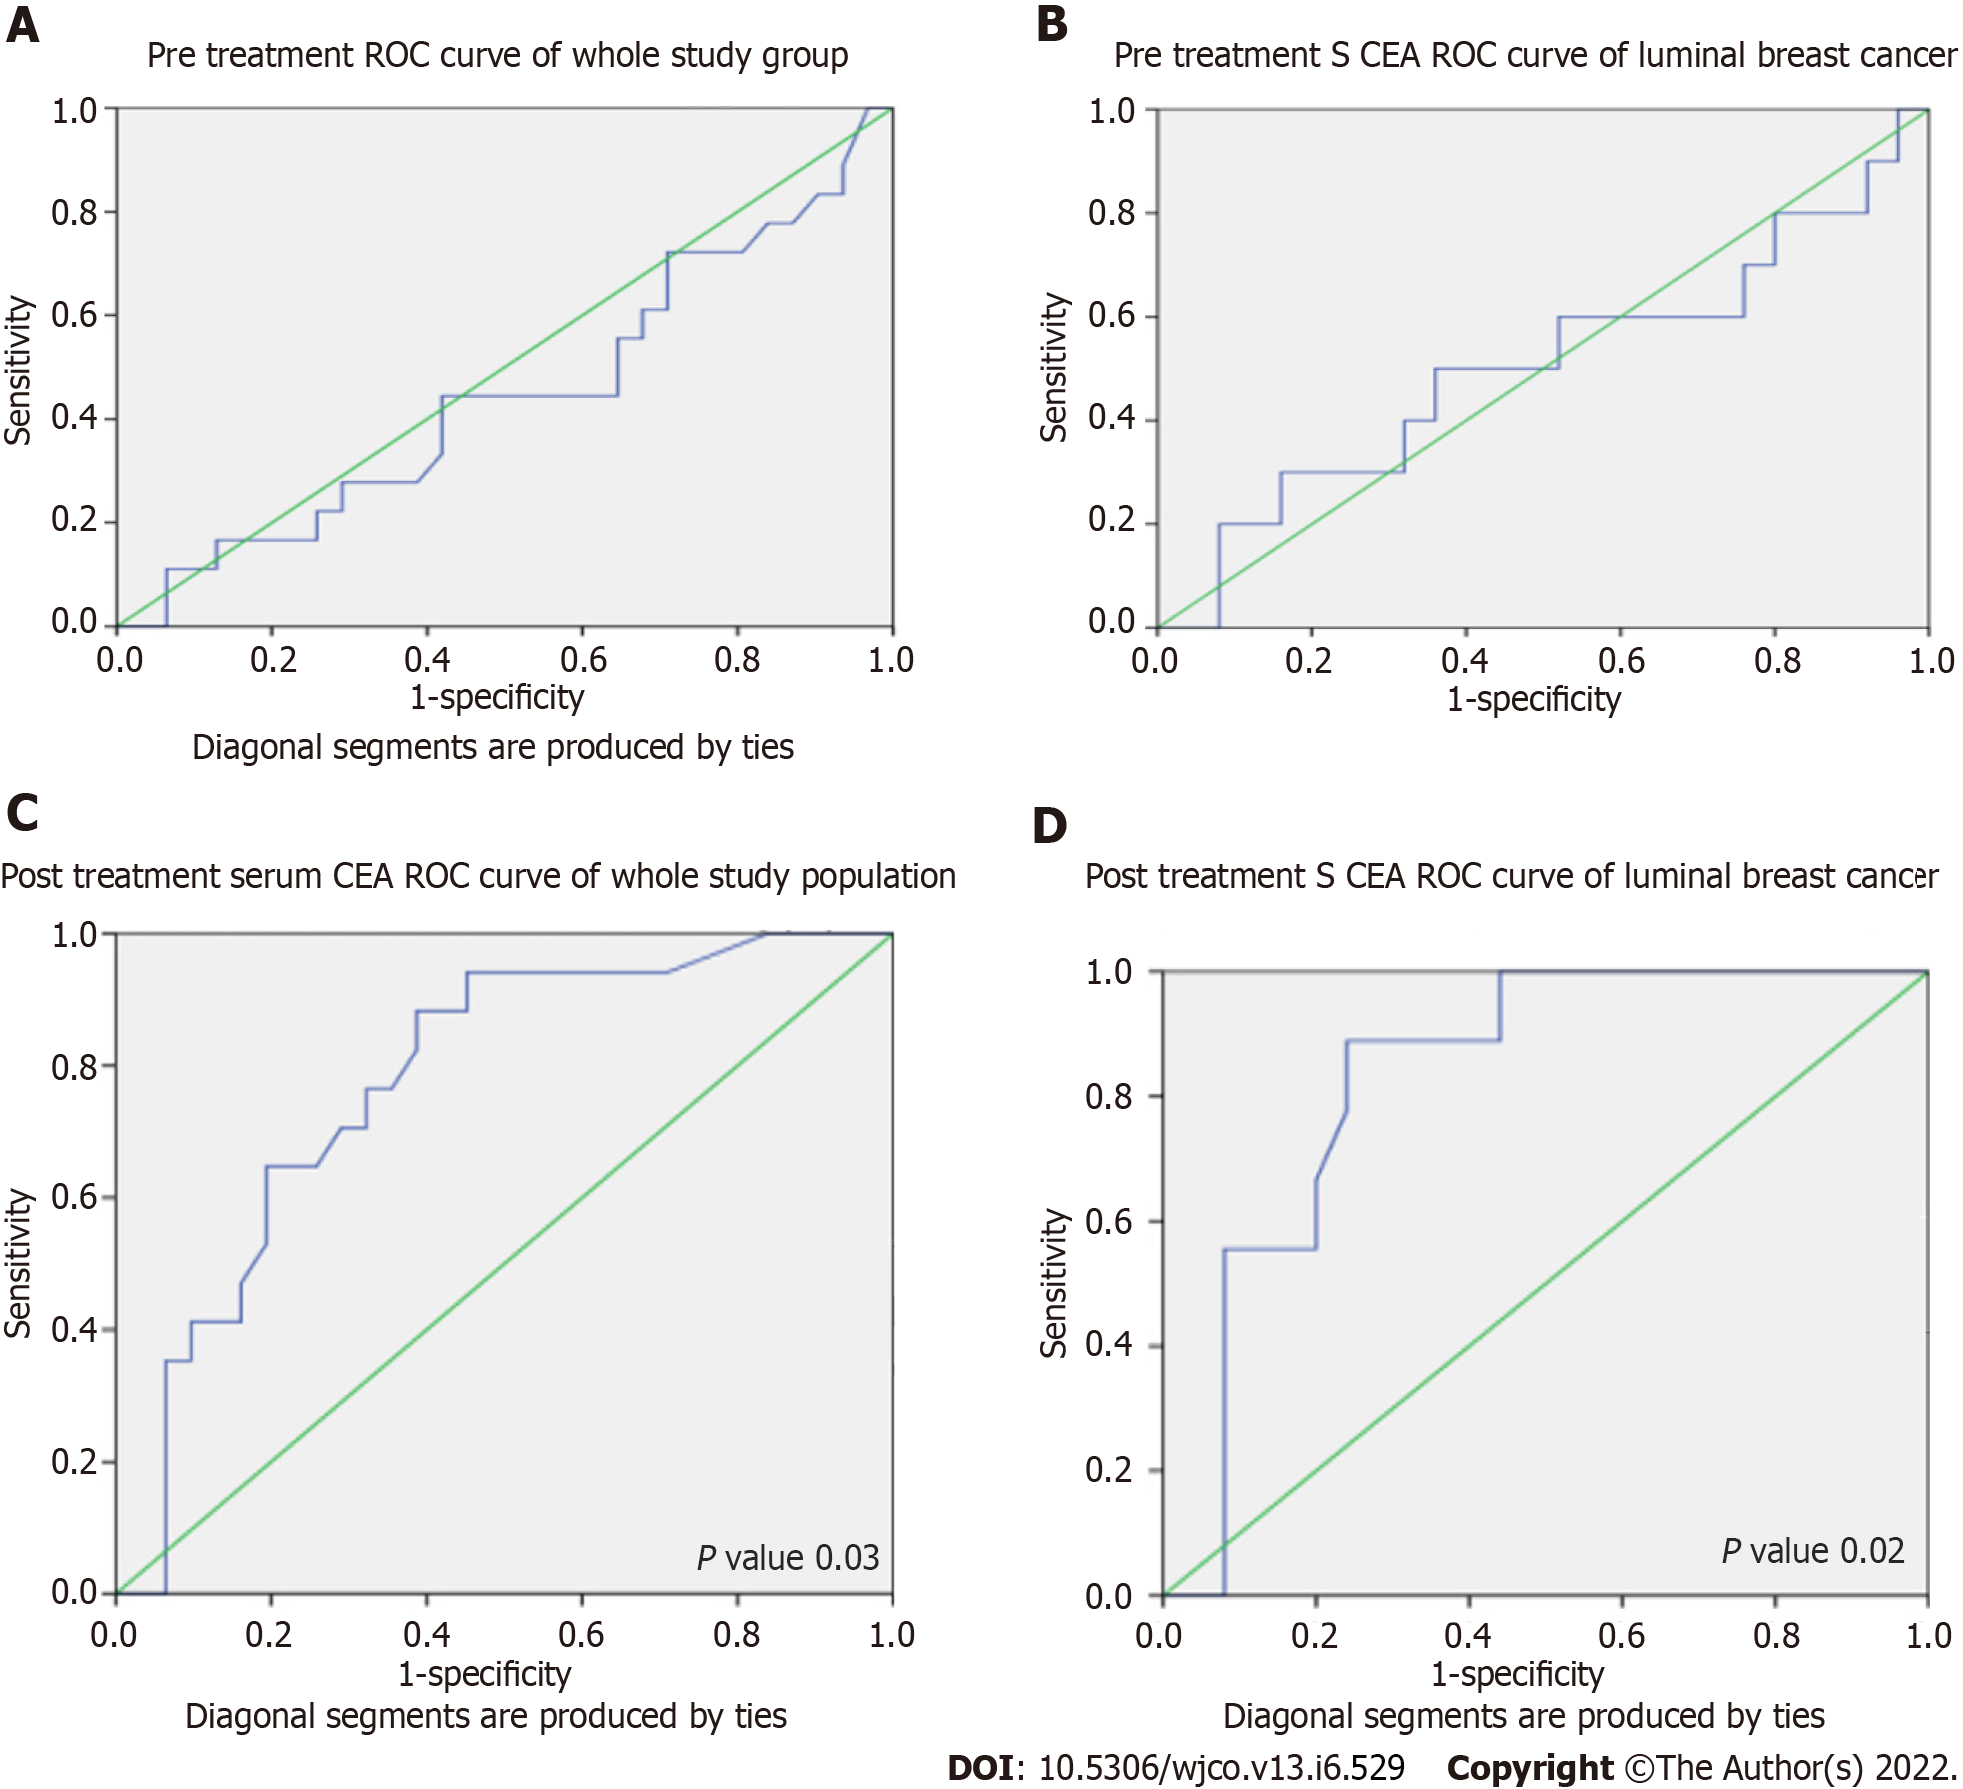
Figure 1 Receiver operator characteristic curves.
A: Pre-treatment receiver operator characteristic (ROC) curve for whole study population; B: Pre-treatment ROC curve for luminal type; C: Post-treatment ROC curve for whole study population; D: Post-treatment ROC curve for luminal type. ROC: Receiver operator characteristic; CEA: Carcinoembryonic antigen.
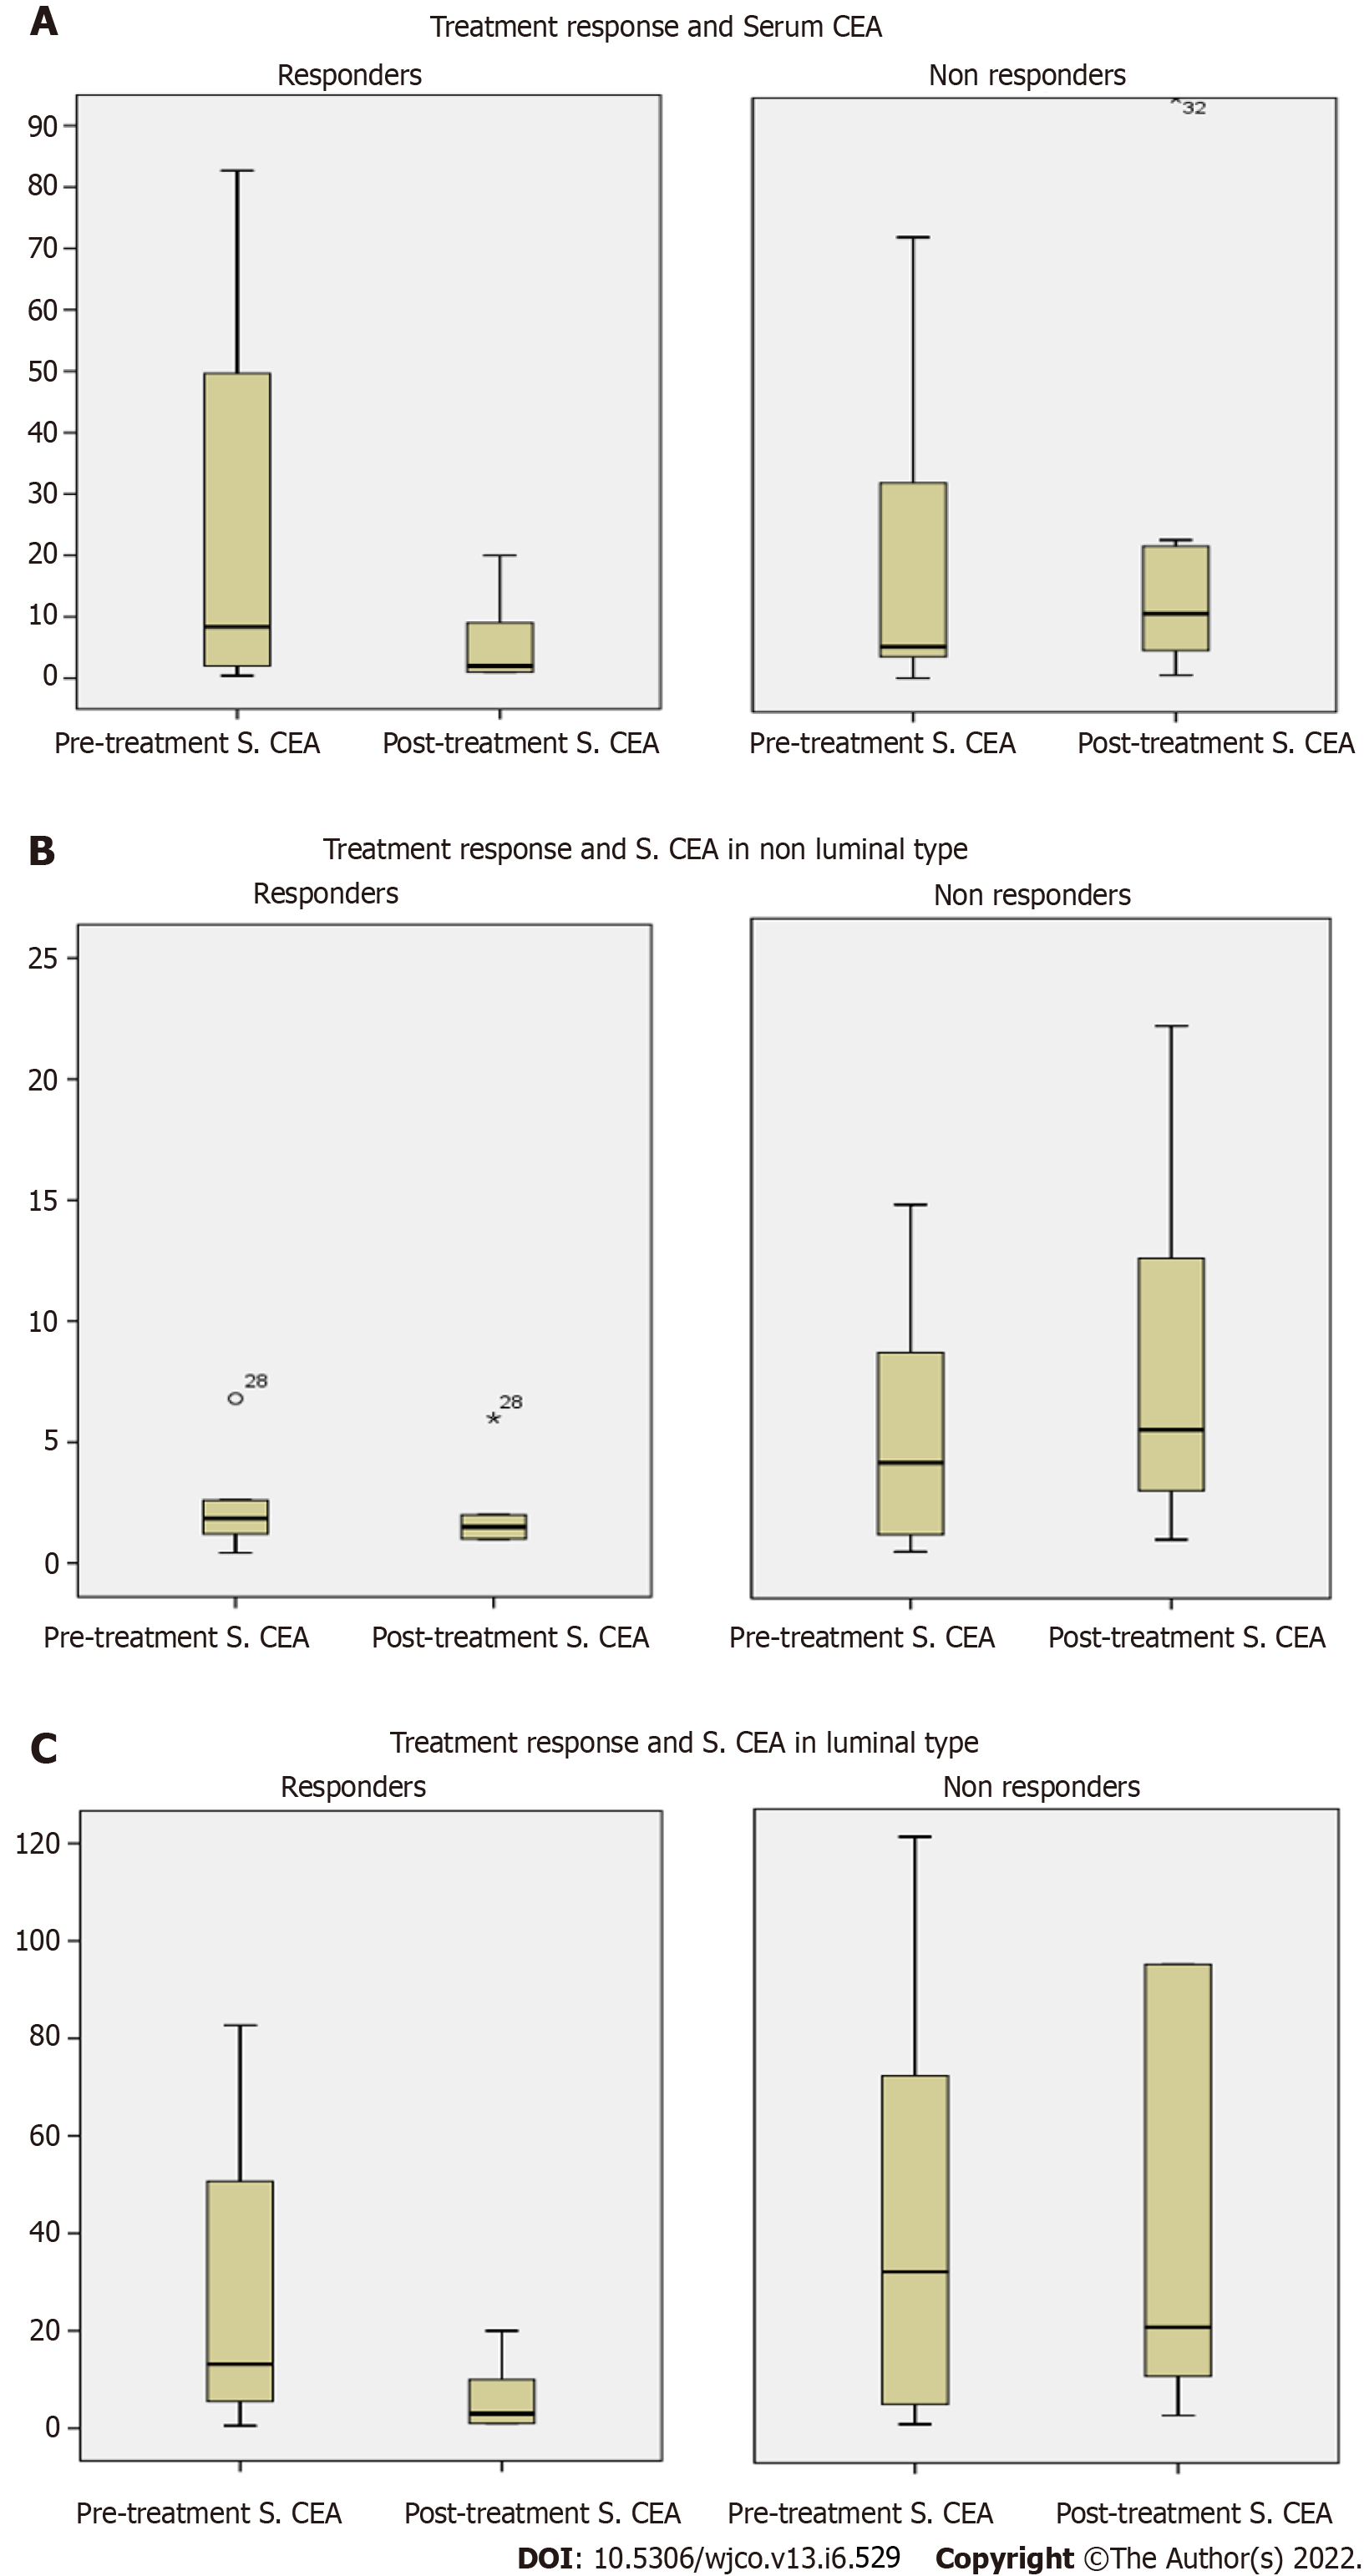
Figure 2 Treatment response.
A: Association of treatment response with serum carcinoembryonic antigen (CEA) (pre-treatment and post-treatment) in whole study population; B: Association of treatment response with serum CEA in non-luminal type; C: Association of treatment response with serum CEA in luminal type. CEA: Carcinoembryonic antigen.
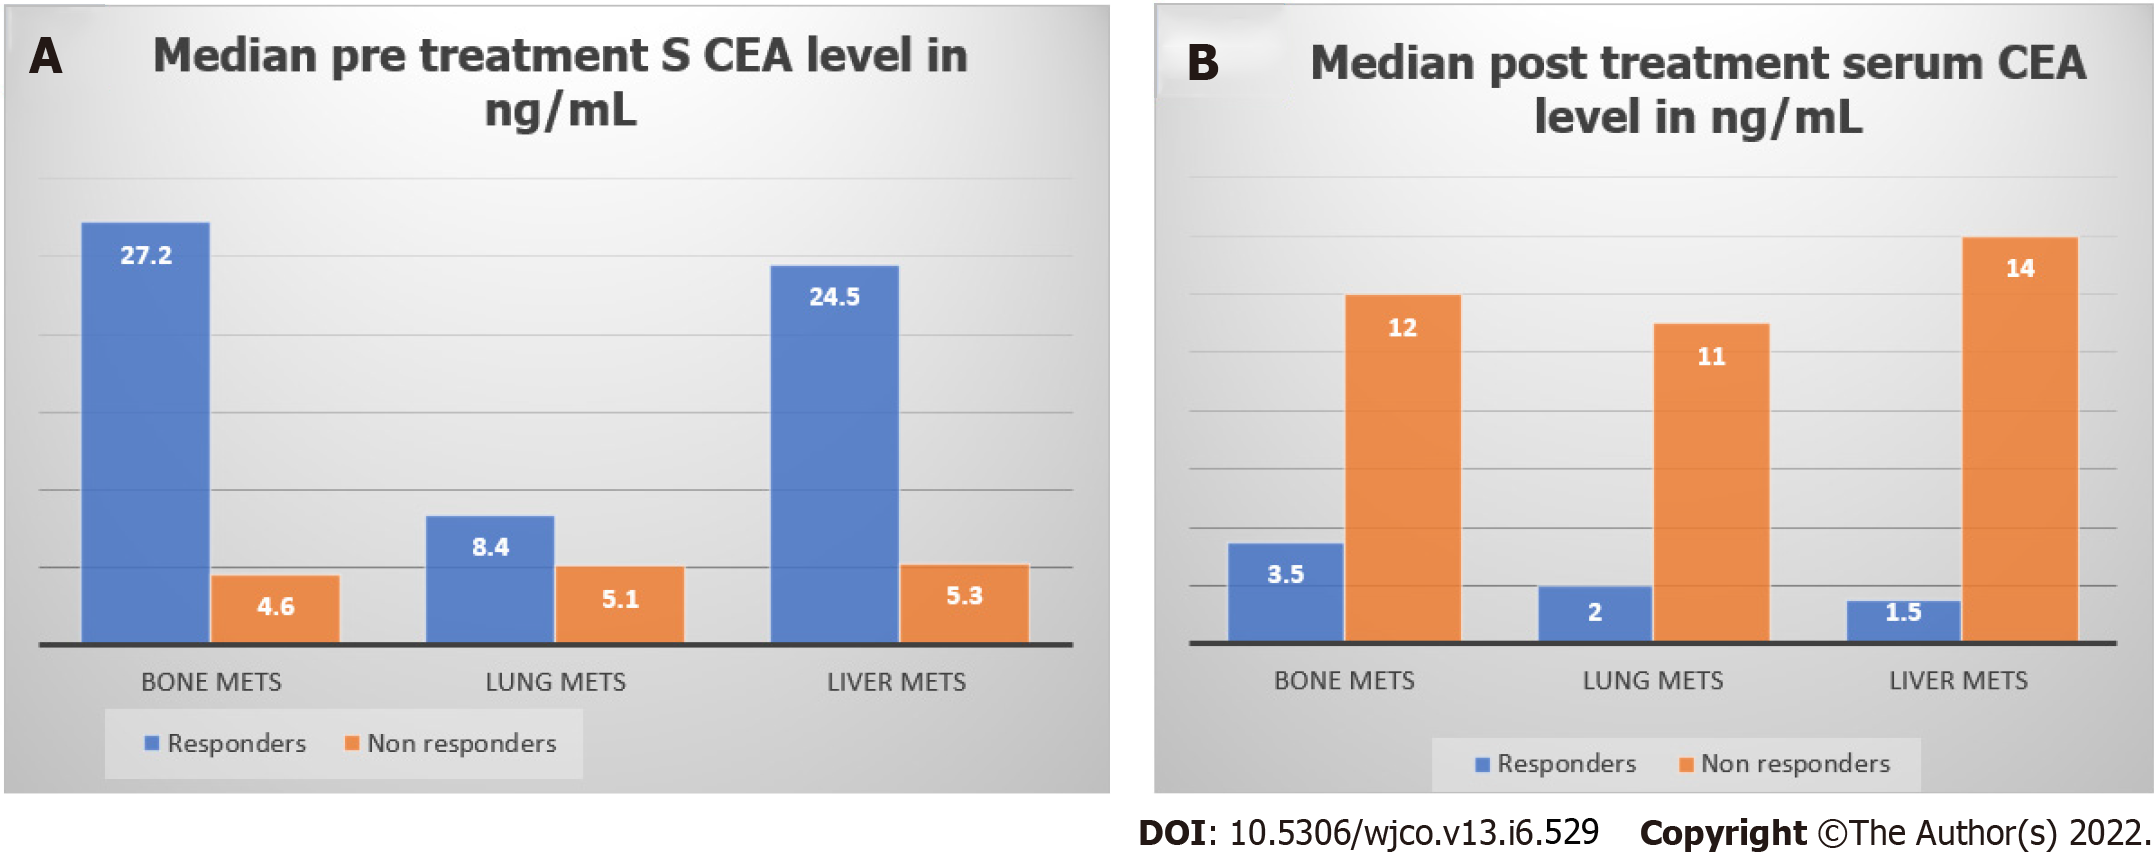
Figure 3 Median pre-treatment and post-treatment serum carcinoembryonic antigen levels in responders and non-responders according to various sites of metastasis.
A: Median pre-treatment serum carcinoembryonic antigen (CEA) level; B: Median post-treatment serum CEA level. CEA: Carcinoembryonic antigen.
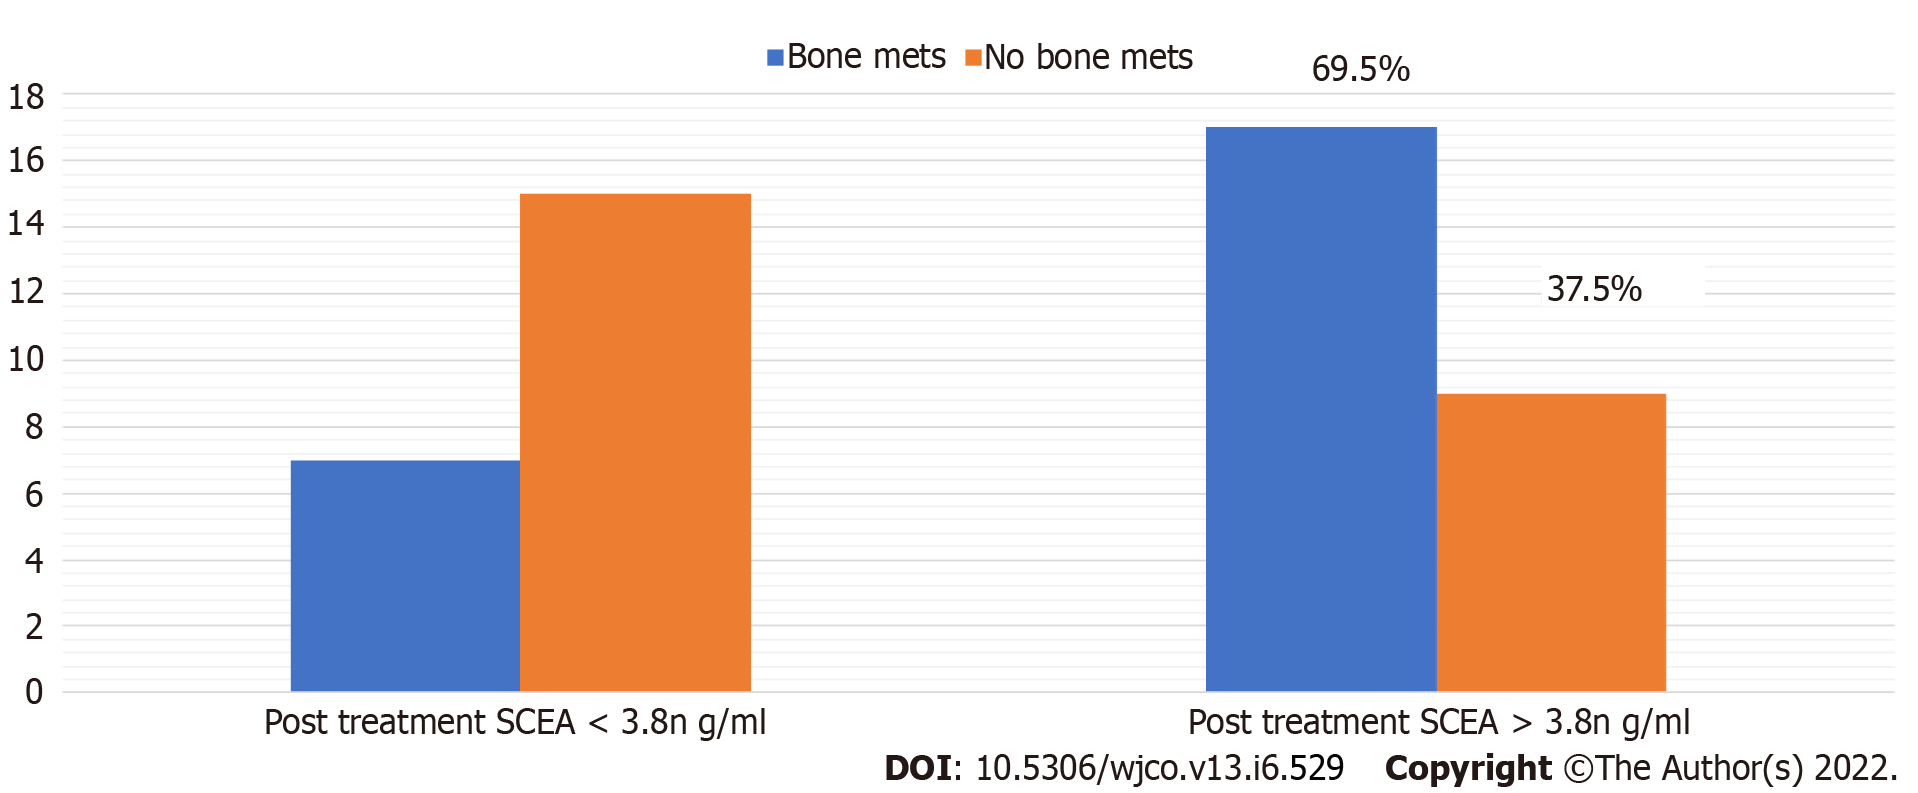
Figure 4 Association of post-treatment serum carcinoembryonic antigen with bone metastases.
CEA: Carcinoembryonic antigen.
- Citation: Anoop TM, Joseph P R, Soman S, Chacko S, Mathew M. Significance of serum carcinoembryonic antigen in metastatic breast cancer patients: A prospective study. World J Clin Oncol 2022; 13(6): 529-539
- URL: https://www.wjgnet.com/2218-4333/full/v13/i6/529.htm
- DOI: https://dx.doi.org/10.5306/wjco.v13.i6.529


