Copyright
©The Author(s) 2022.
World J Clin Oncol. Feb 24, 2022; 13(2): 135-146
Published online Feb 24, 2022. doi: 10.5306/wjco.v13.i2.135
Published online Feb 24, 2022. doi: 10.5306/wjco.v13.i2.135
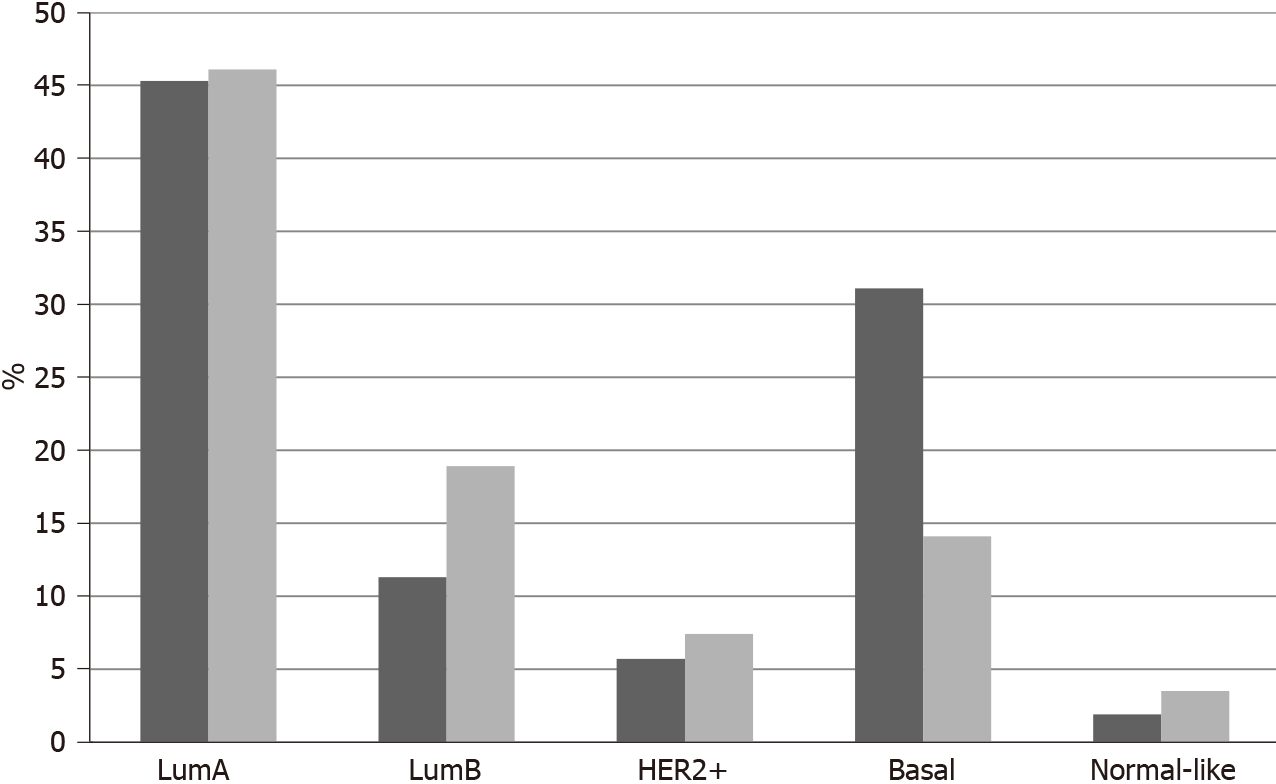
Figure 1 Percentage of patients with different breast cancer molecular sub-types among the neurotrophic receptor tyrosine kinase amplified and non-amplified groups.
Data are from TCGA breast cancer cohort. Black columns: Neurotrophic receptor tyrosine kinase amplified; Grey columns: Neurotrophic receptor tyrosine kinase non-amplified.
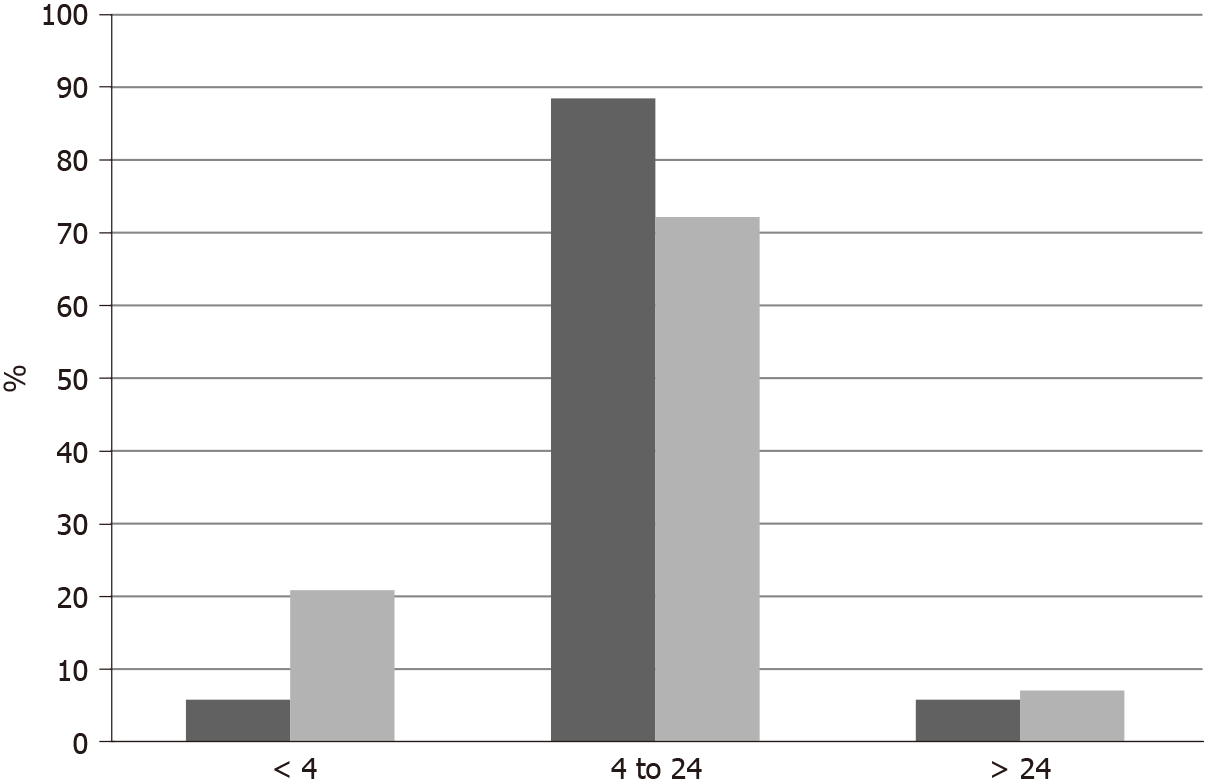
Figure 2 Percentage of patients with different aneuploidy score levels in breast cancer groups with and without neurotrophic receptor tyrosine kinase amplifications.
Data are from TCGA breast cancer cohort. Black columns: Neurotrophic receptor tyrosine kinase amplified; Grey columns: Neurotrophic receptor tyrosine kinase non-amplified.
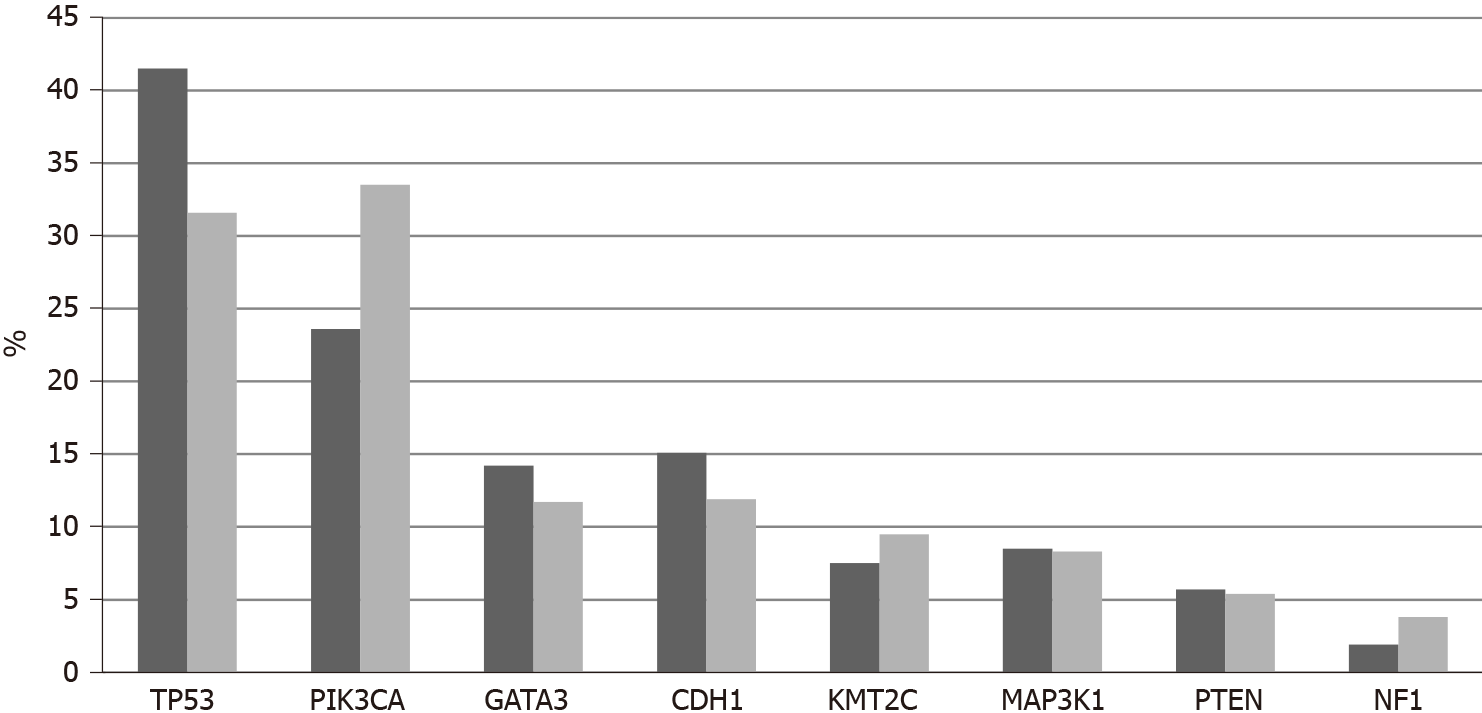
Figure 3 Percentage of mutations in the most common breast cancer associated genes in breast cancers with and without neurotrophic receptor tyrosine kinase amplifications.
Data are from TCGA breast cancer cohort. Black columns: Neurotrophic receptor tyrosine kinase amplified; Grey columns: Neurotrophic receptor tyrosine kinase non-amplified.
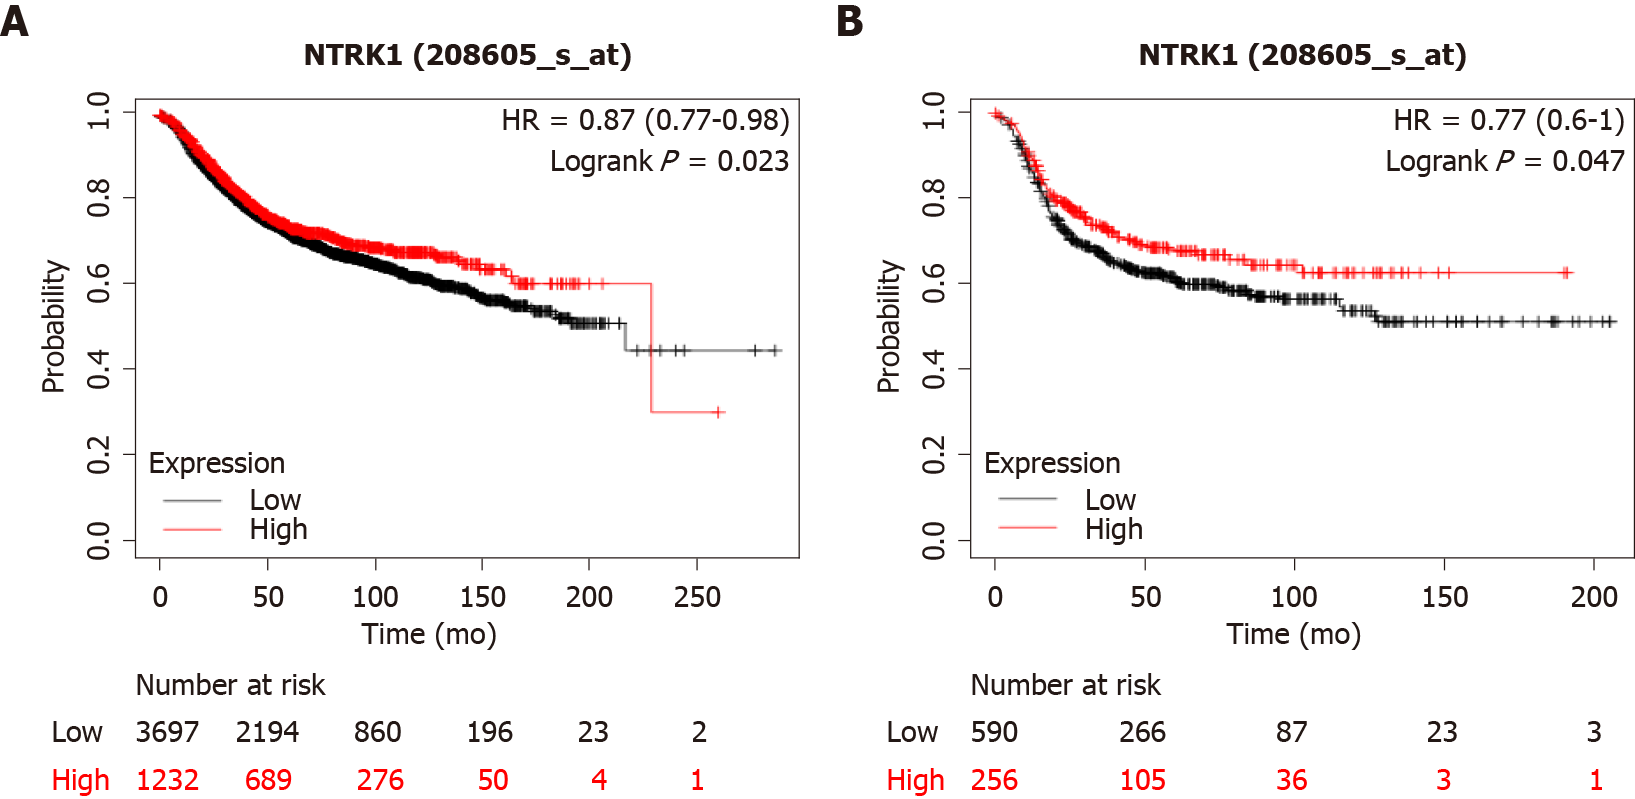
Figure 4 Overall survival of breast cancers according to NTRK1 mRNA expression.
A: Overall survival curves of all breast cancer patients with high NTRK1 mRNA expression vs low NTRK1 mRNA expression, across sub-types. Log-rank P = 0.02; B: Overall survival curves of basal sub-type patients with high NTRK1 mRNA expression vs low NTRK1 mRNA expression. Log-rank P = 0.04.
- Citation: Stravodimou A, Voutsadakis IA. Neurotrophic receptor tyrosine kinase family members in secretory and non-secretory breast carcinomas. World J Clin Oncol 2022; 13(2): 135-146
- URL: https://www.wjgnet.com/2218-4333/full/v13/i2/135.htm
- DOI: https://dx.doi.org/10.5306/wjco.v13.i2.135


