Copyright
©The Author(s) 2021.
World J Clin Oncol. Jun 24, 2021; 12(6): 500-506
Published online Jun 24, 2021. doi: 10.5306/wjco.v12.i6.500
Published online Jun 24, 2021. doi: 10.5306/wjco.v12.i6.500
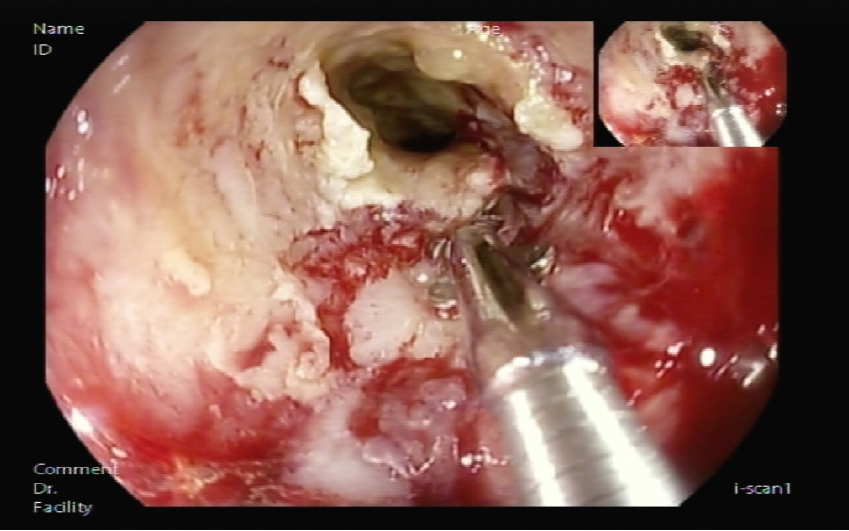
Figure 1 Endoscopic view of rectal neuroendocrine carcinoma.
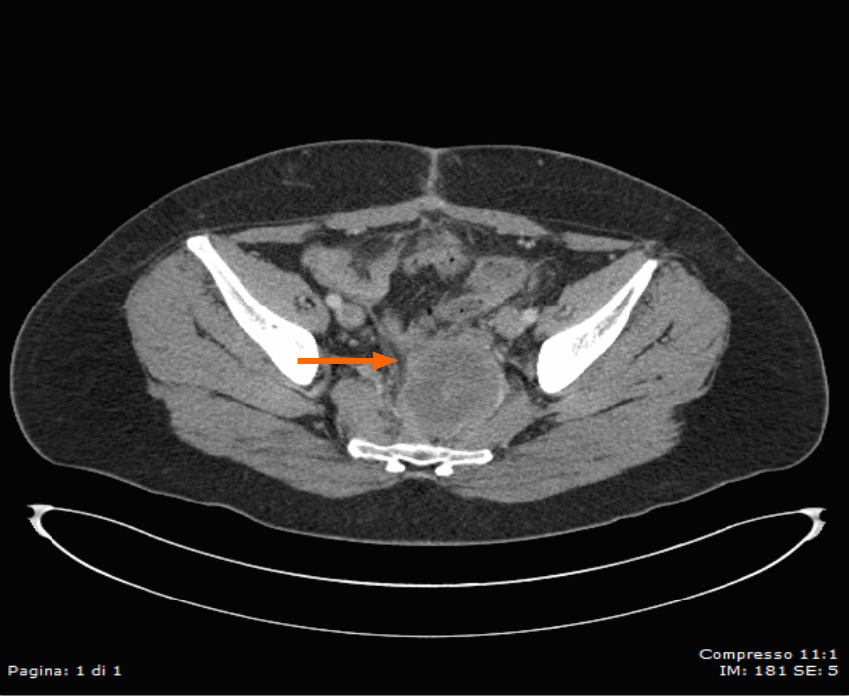
Figure 2 Computed tomography scan view of rectal neuroendocrine carcinoma.
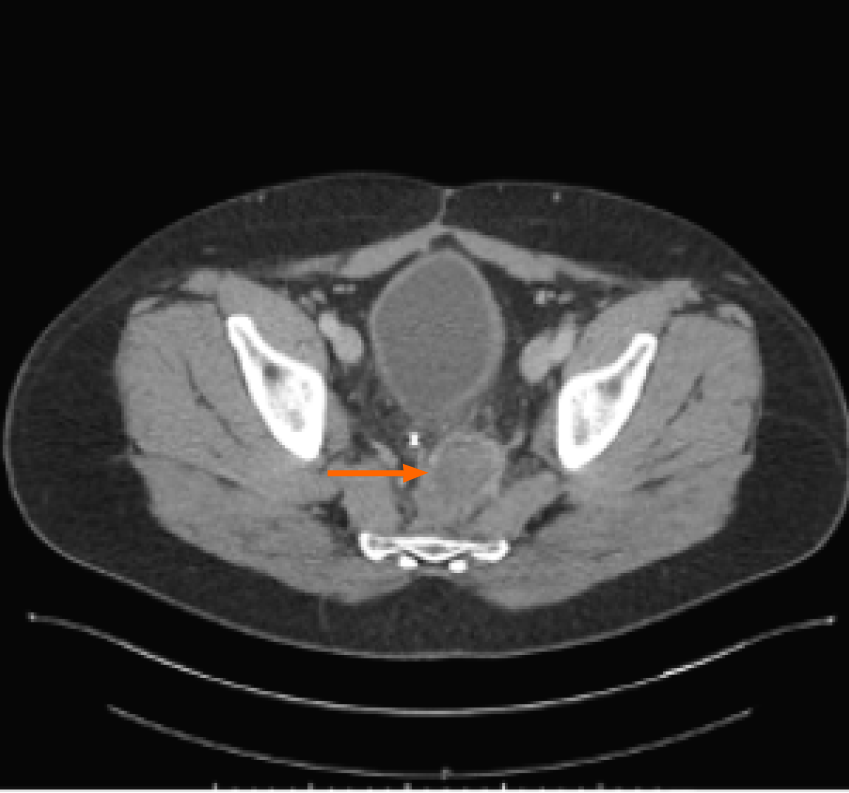
Figure 3 Computed tomography image of rectal lesion downstaging after chemotherapy.
Figure 4 Positron emission tomography/computed tomography images of periaortic lymph nodes.
A: Positron emission tomography image; B: Computed tomography image.
Figure 5 Positron emission tomography/computed tomography images showing complete response after radiotherapy.
A: Positron emission tomography image; B: Computed tomography image.
- Citation: Della Torre S, de Nucci G, Lombardi PM, Grandi S, Manes G, Bollina R. Long-term complete response in metastatic poorly-differentiated neuroendocrine rectal carcinoma with a multimodal approach: A case report. World J Clin Oncol 2021; 12(6): 500-506
- URL: https://www.wjgnet.com/2218-4333/full/v12/i6/500.htm
- DOI: https://dx.doi.org/10.5306/wjco.v12.i6.500


