Copyright
©The Author(s) 2021.
World J Clin Oncol. May 24, 2021; 12(5): 342-354
Published online May 24, 2021. doi: 10.5306/wjco.v12.i5.342
Published online May 24, 2021. doi: 10.5306/wjco.v12.i5.342
Figure 1 The inhibitory effect of thymoquinone and royal jelly on the viability of MDA-MB-231 and FHs74 Int cell line.
A: 3-(4,5-dmethylthiazol-2-yl)-2,5-diphenyltetrazolium bromide assay showing the percentage viability of MDA-MB-231 cell line and the half-maximal inhibitory concentration of thymoquinone (TQ) on MDA-MB-231 human breast cancer cell line after 24 h of treatment with different TQ concentrations. Cell viability was estimated by measuring the absorbance of the cell suspension after incubation with 3-(4,5-dimethylthiazol-2-yl)-2,5-diphenyltetrazolium bromide; B: Trypan blue exclusion assay showing the percentage cell viability after 24 h of treatment with different royal jelly concentrations on FHs74 Int; C: MDA-MB-231 cell lines. Data shown are an average of 3 independent experiments for panels A and B, and 2 independent experiments for panel C, respectively, expressed as mean ± standard error of the mean. Asterisks represent statistically significant results compared to the control, (aP < 0.05, bP < 0.01, cP < 0.001). RJ: Royal jelly; TQ: Thymoquinone.
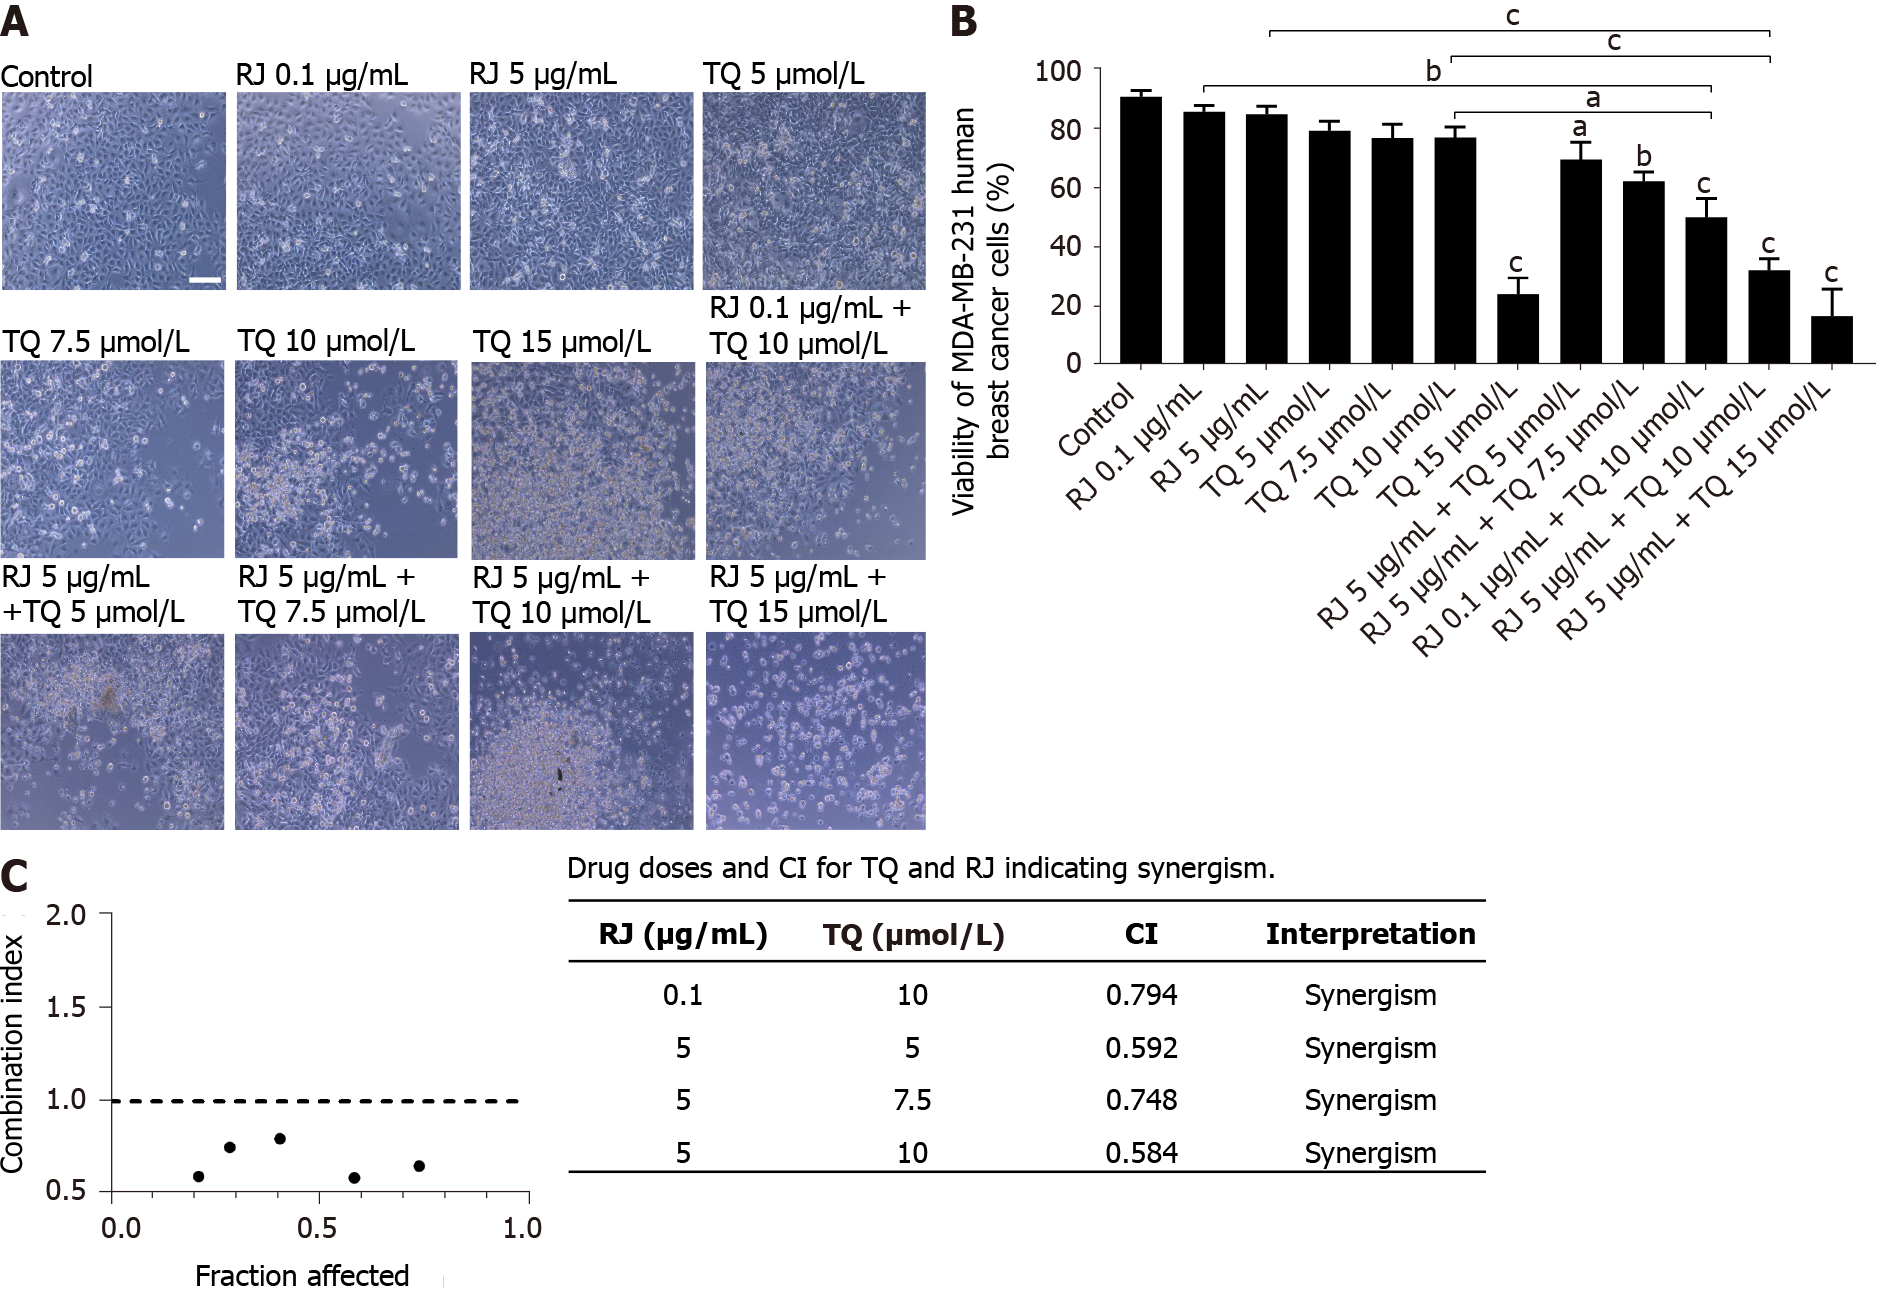
Figure 2 Royal jelly and thymoquinone combinations enhanced the inhibition of MDA-MB-231 human breast cancer cell viability.
A: Representative light microscopy images of MDA-MB-231 viability in response to different treatments. Cells were visualized by Axiovert inverted microscope from Zeiss at 10 × magnification with scale bar = 10 µmol/L; B: Trypan blue exclusion assay showing the percentage viability of MDA-MB-231 cell line after 24 h of treatment with different concentrations of royal jelly (RJ), thymoquinone, and combinations. Data shown are an average of three independent experiments expressed as mean ± standard error of the mean. Asterisks represent statistically significant results compared to the control and treatment conditions, (aP < 0.05, bP < 0.01, cP < 0.001); C: Fraction affected-combination index plot showing combination index (CI) values plotted as a function of fraction affected values corresponding to the % cell death of five different combinations of thymoquinone (5 µmol/L, 7.5 µmol/L, 10 µmol/L and 15 µmol/L) and royal jelly (0.1 and 5 µg/mL) in MDA-MB-231 cells. The dotted line is the reference line, where CI value is equal to 1; circles in black represent CI values at different Fa. CI > 1, CI = 1, and CI < 1 indicate antagonistic, additive, and synergistic effects, respectively. CI: Combination index; RJ: Royal jelly; TQ: Thymoquinone.
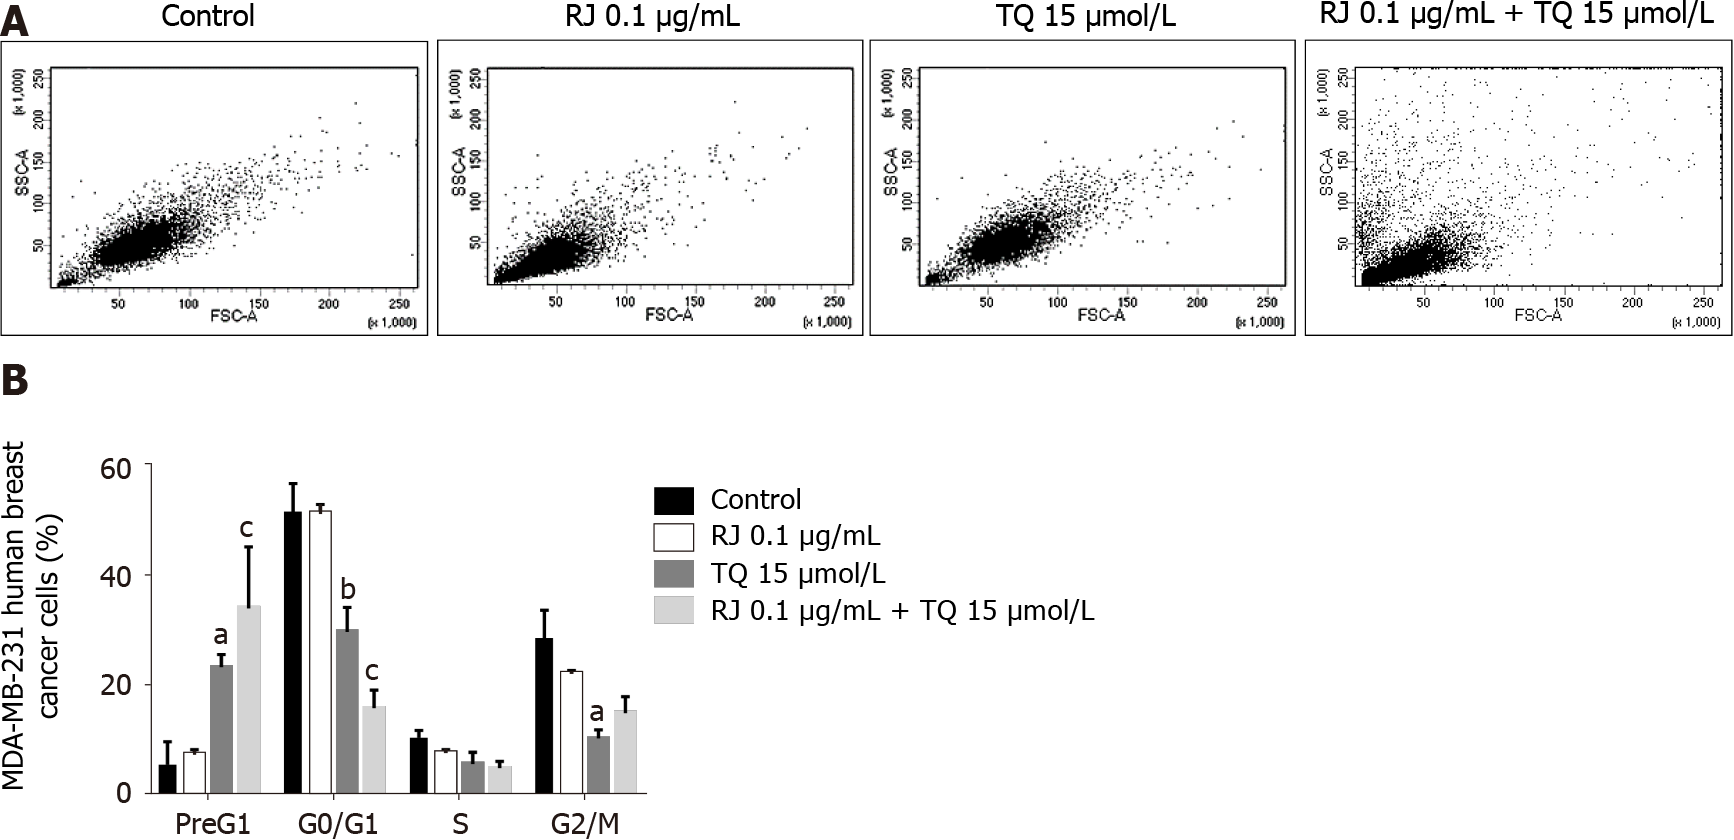
Figure 3 Cell death is enhanced by thymoquinone alone and by the combination thymoquinone and royal jelly.
A: Representative density plots showing MDA-MB-231 cell distribution as a function of side scatter area and forward scatter area in the control and post-treatment with 15 µmol/L thymoquinone (TQ) and 0.1 µg/mL royal jelly alone and in combination for 24 h; B: Propidium iodide staining with flow cytometry showing the increase in Pre G1 upon treatment with TQ alone and the combination of TQ and royal jelly. Data shown are an average of three independent experiments expressed as mean ± standard error of the mean and analyzed by a two-way analysis of variance test followed by multiple comparisons test. Asterisks represent statistically significant results compared to the control, (aP < 0.05, bP < 0.01, cP < 0.001). RJ: Royal jelly; TQ: Thymoquinone.
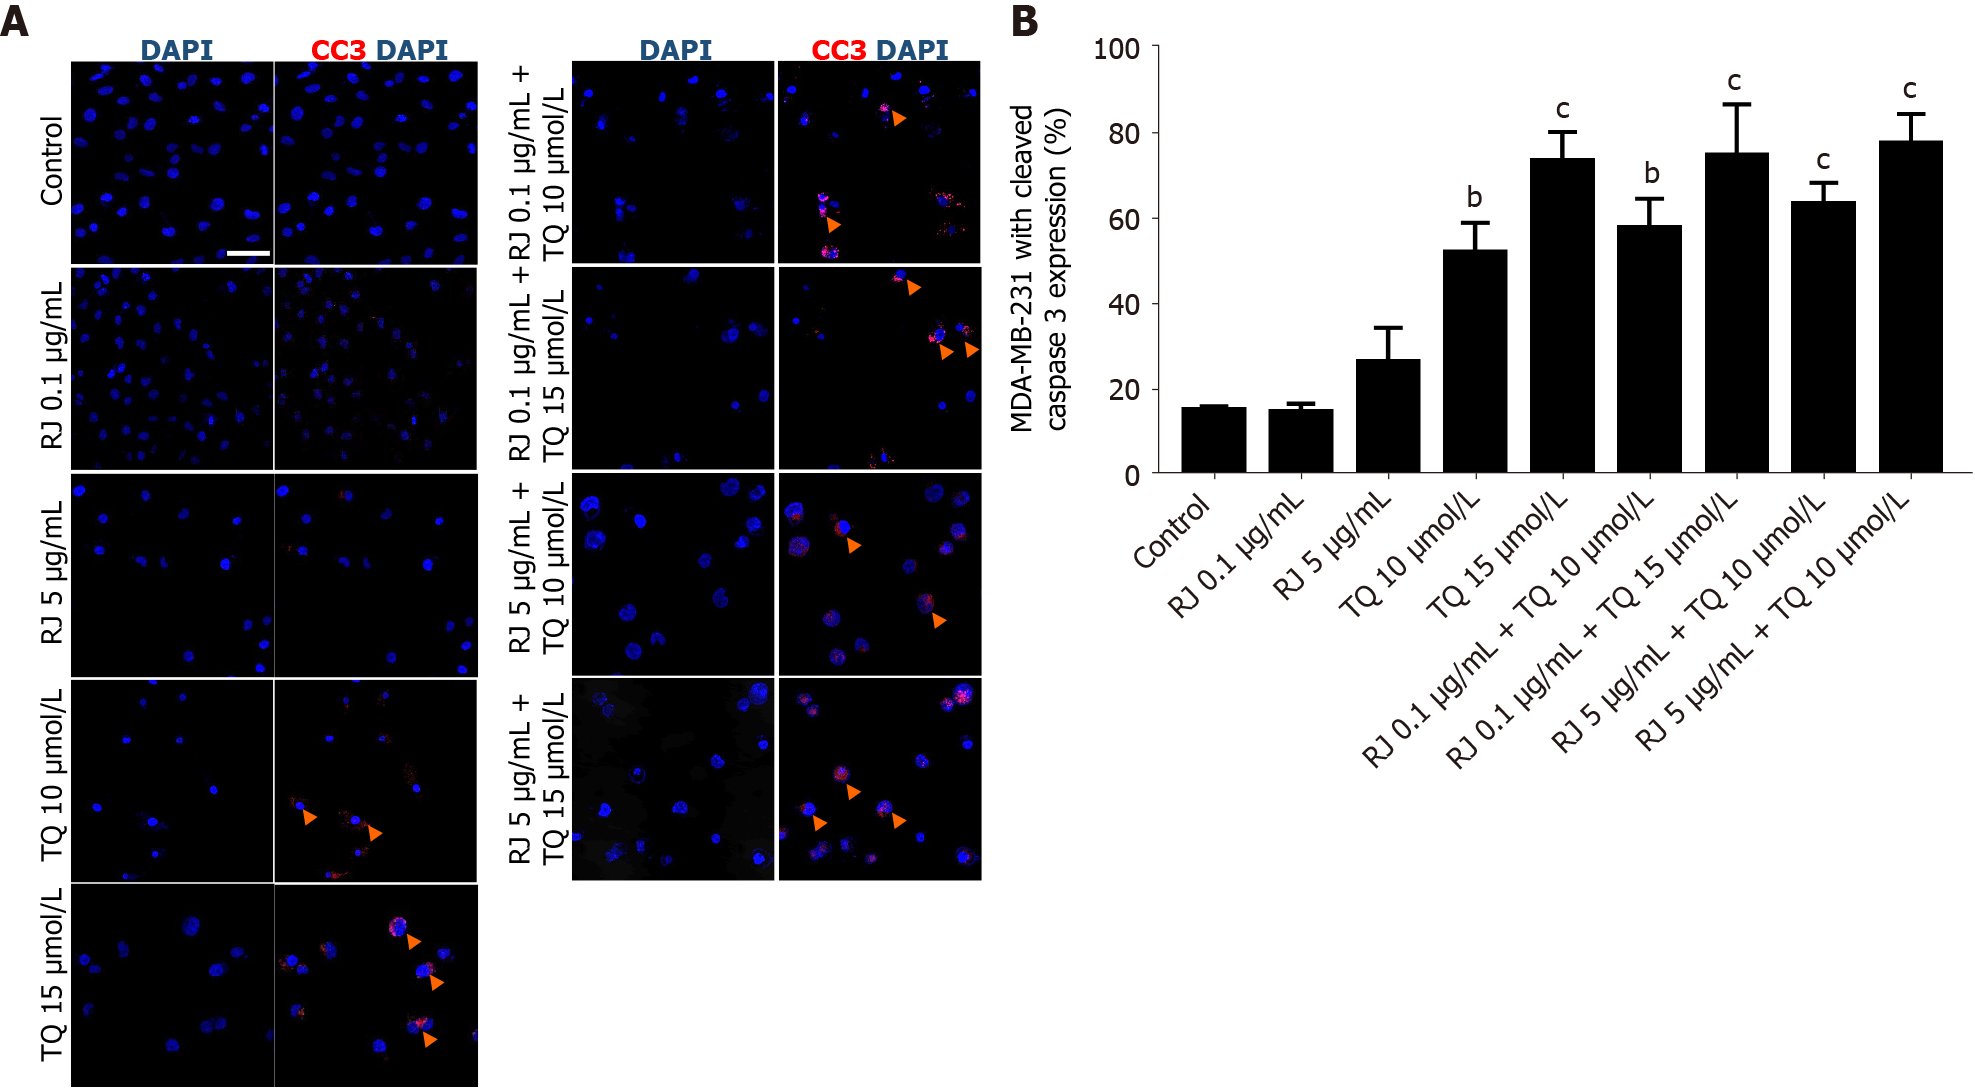
Figure 4 Effect of royal jelly, thymoquinone and combinations on caspase 3 cleavage in MDA-MB-231 human breast cancer cells.
A: Immunofluorescence micrographs of cleaved caspase 3 expression at 24 h after treatment. Red indicates cleaved caspase 3 expression and blue indicates nuclei counter stained by 4′,6-diamidino-2-phenylindole. Arrows indicate apoptotic nuclei. Nuclei were visualized by confocal Zeiss Axio microscope, 40 × oil immersion with scale bar = 50 µmol/L; B: Quantification of cleaved caspase 3 in MDA-MB-231 cells at 24 h of treatment with different concentrations of royal jelly, thymoquinone, and their combinations. Data shown are an average of 3 independent experiments expressed as mean ± standard error of the mean. Asterisks represent statistically significant results, (aP < 0.05, bP < 0.01, cP < 0.001). RJ: Royal jelly; TQ: Thymoquinone.
- Citation: Moubarak MM, Chanouha N, Abou Ibrahim N, Khalife H, Gali-Muhtasib H. Thymoquinone anticancer activity is enhanced when combined with royal jelly in human breast cancer. World J Clin Oncol 2021; 12(5): 342-354
- URL: https://www.wjgnet.com/2218-4333/full/v12/i5/342.htm
- DOI: https://dx.doi.org/10.5306/wjco.v12.i5.342


