Copyright
©The Author(s) 2020.
World J Clin Oncol. Aug 24, 2020; 11(8): 673-678
Published online Aug 24, 2020. doi: 10.5306/wjco.v11.i8.673
Published online Aug 24, 2020. doi: 10.5306/wjco.v11.i8.673
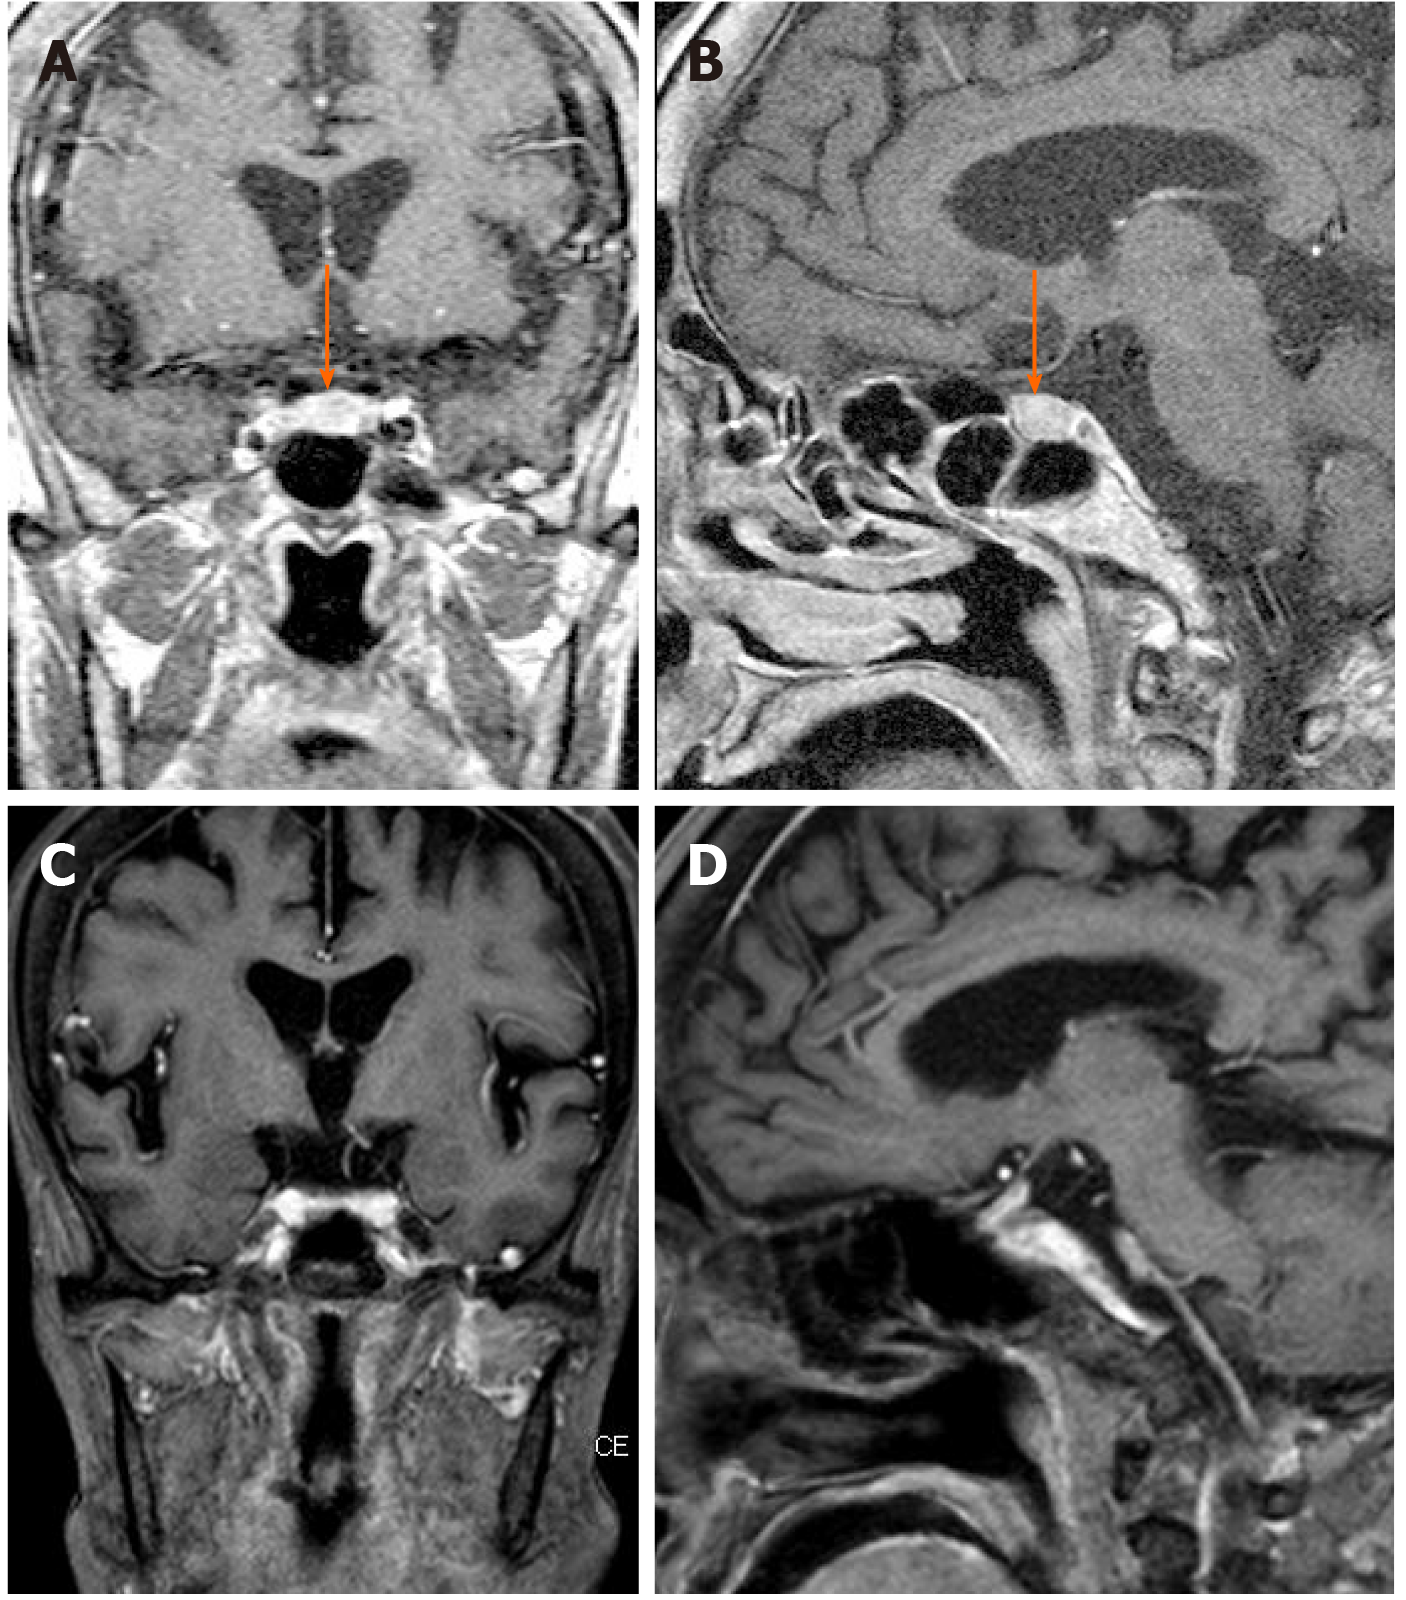
Figure 1 Magnetic resonance imaging: T1-weighted imaging.
A and B: At presentation: coronary (A) and sagittal (B) view magnetic resonance images (MRI) showing an enlarged pituitary gland; C and D: Three months later (after the third cycle of chemotherapy): Coronary (C) and sagittal (D) view MRI showing substantial mass reduction.
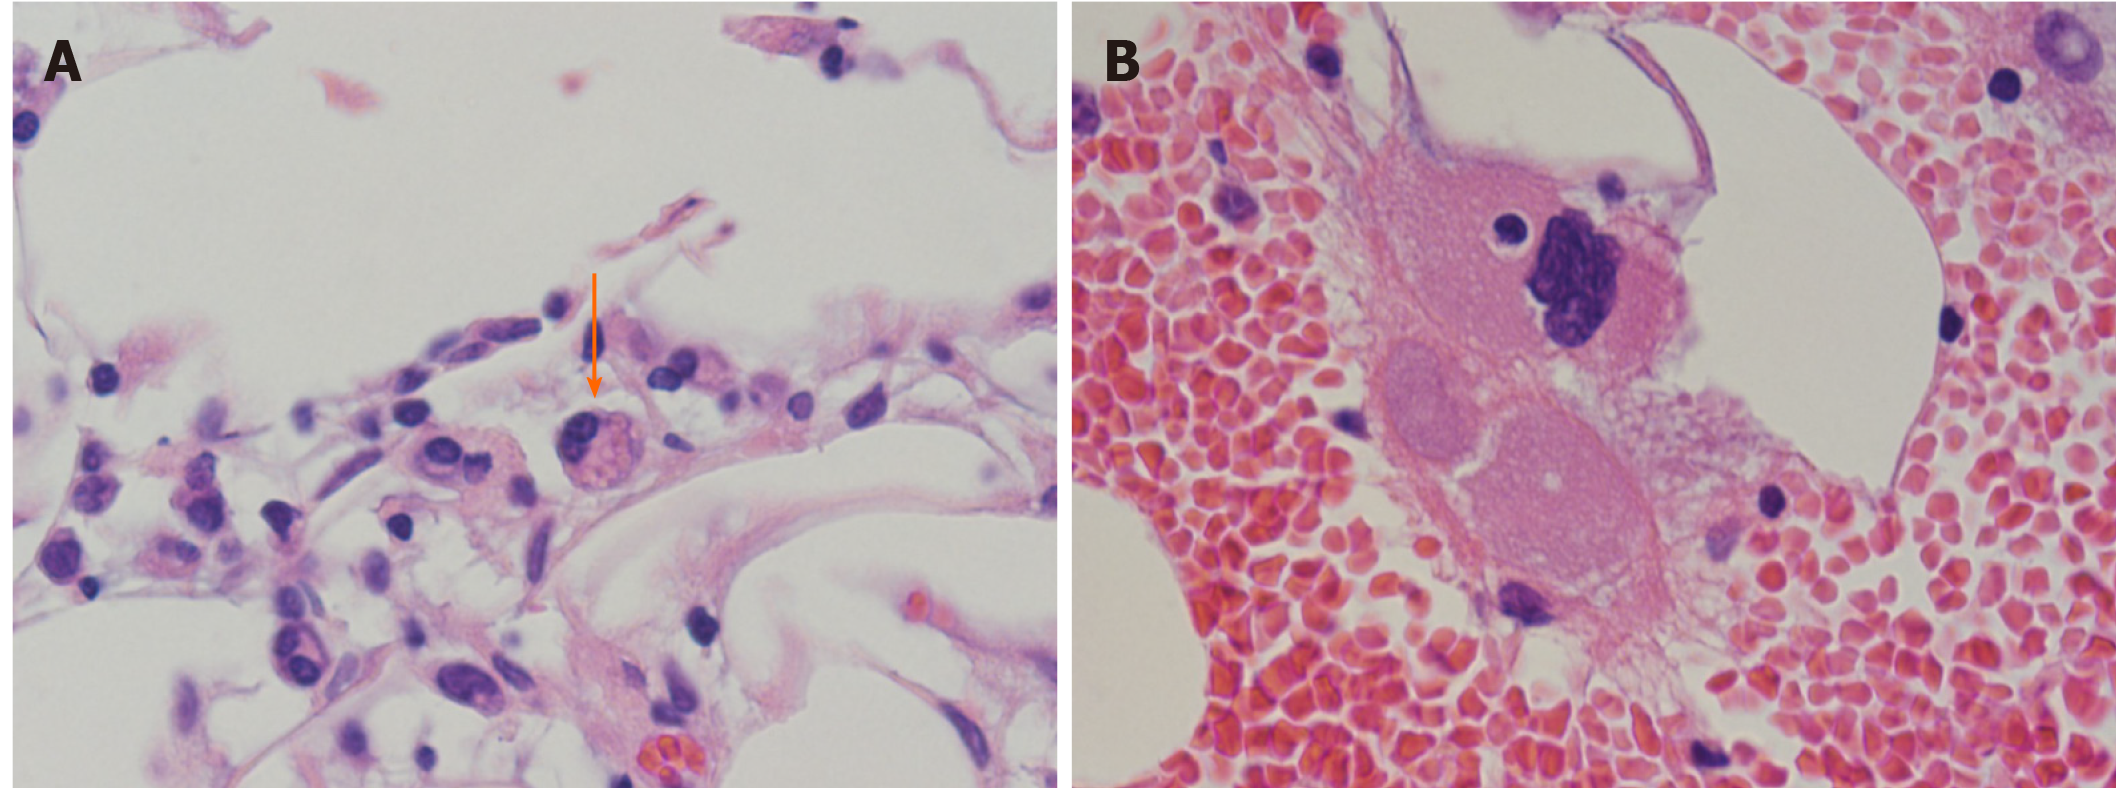
Figure 2 Bone marrow aspiration showing hemophagocytosis (designated by an arrow).
A and B: Wright and Giemsa staining at ×400 (A) and ×1000 (B) magnification.
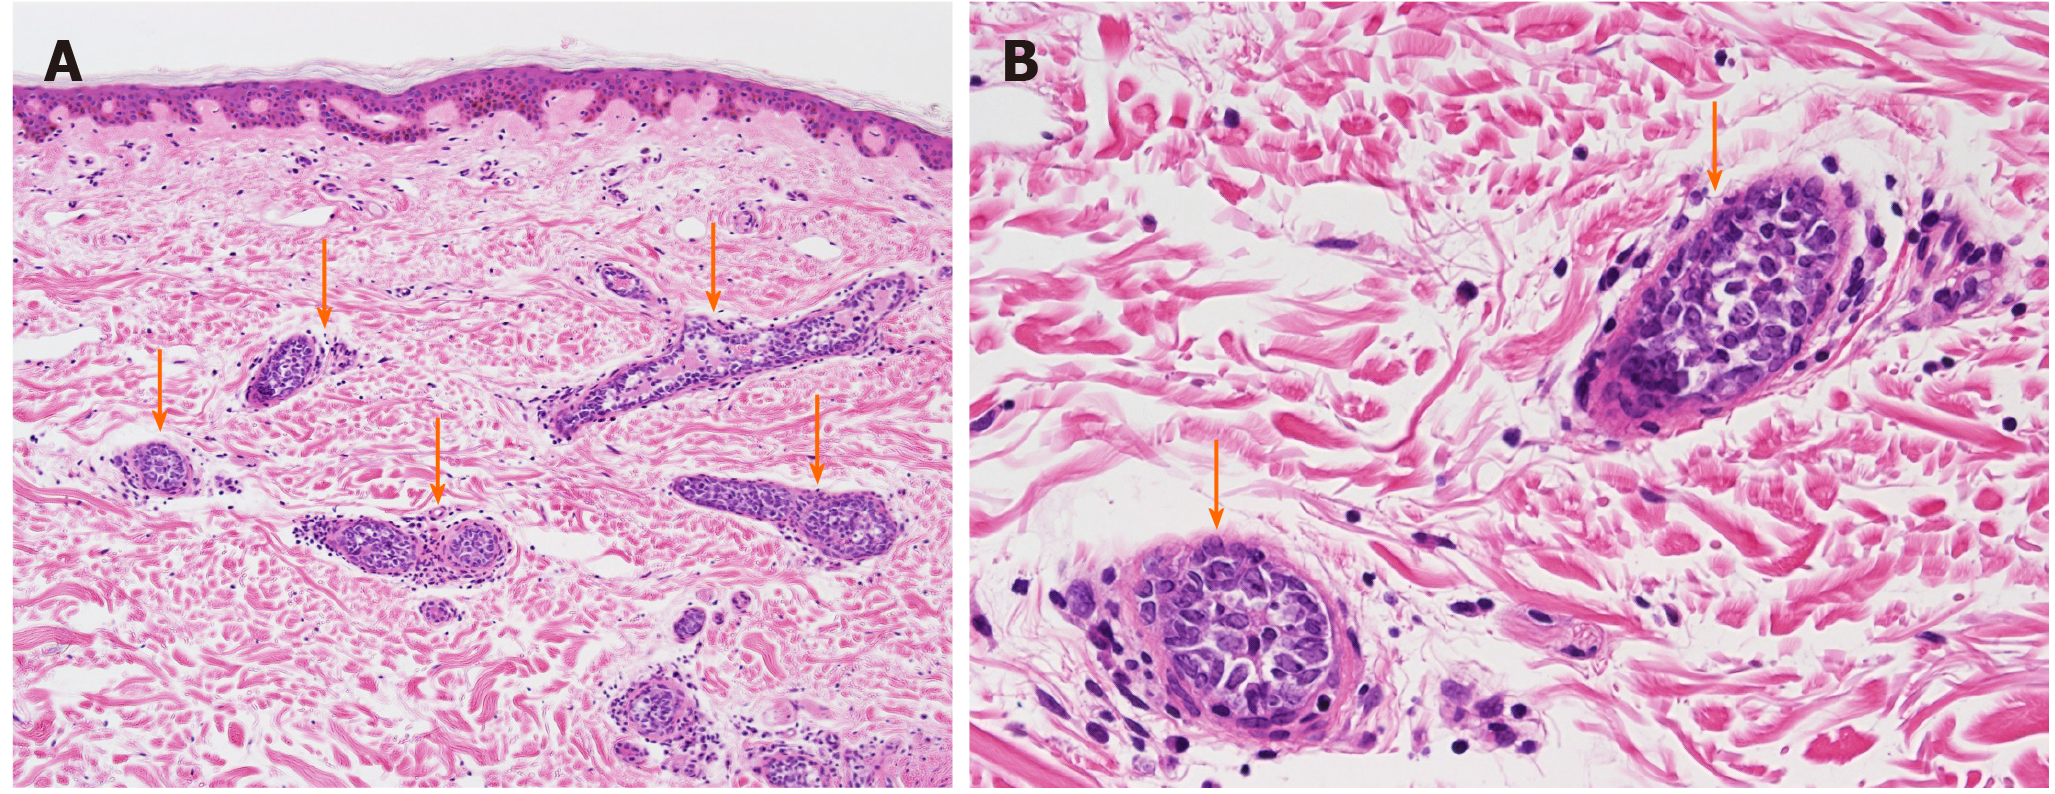
Figure 3 Hematoxylin and eosin.
A and B: Histopathology of intravascular lymphoma by random skin biopsy: the arrows indicate lymphoma cells seen within the lumen of small vessels: hematoxylin and eosin stain at ×400 (A) and ×1000 (B) magnification.
- Citation: Kawahigashi T, Teshima S, Tanaka E. Intravascular lymphoma with hypopituitarism: A case report. World J Clin Oncol 2020; 11(8): 673-678
- URL: https://www.wjgnet.com/2218-4333/full/v11/i8/673.htm
- DOI: https://dx.doi.org/10.5306/wjco.v11.i8.673


