Copyright
©The Author(s) 2020.
World J Clin Oncol. Feb 24, 2020; 11(2): 91-102
Published online Feb 24, 2020. doi: 10.5306/wjco.v11.i2.91
Published online Feb 24, 2020. doi: 10.5306/wjco.v11.i2.91
Figure 1 Radiographic images of the pituitary carcinoma discussed in case 1.
A: Magnetic resonance imaging (MRI) in September 2010 shows a 3.4 cm × 2.0 cm × 2.6 cm enhancing sellar mass (arrow); B: MRI in April 2013 shows stable residual sellar lesion post-surgery and radiation (arrow); C: MRI in April 2014 shows enlarging lesion extending to the suprasellar region and left cavernous sinus (arrow); D: MRI/Magnetic Resonance Angiography in May 2015 shows multiloculated hemorrhagic collection around an enlarging dural enhancing lesion (arrow); E, F: MRI in August 2016, in comparison to MRI in March 2016, shows more enhancing solid appearing sellar mass with interval enlargement of the tumor burden along the left cavernous sinus and middle cranial fossa.
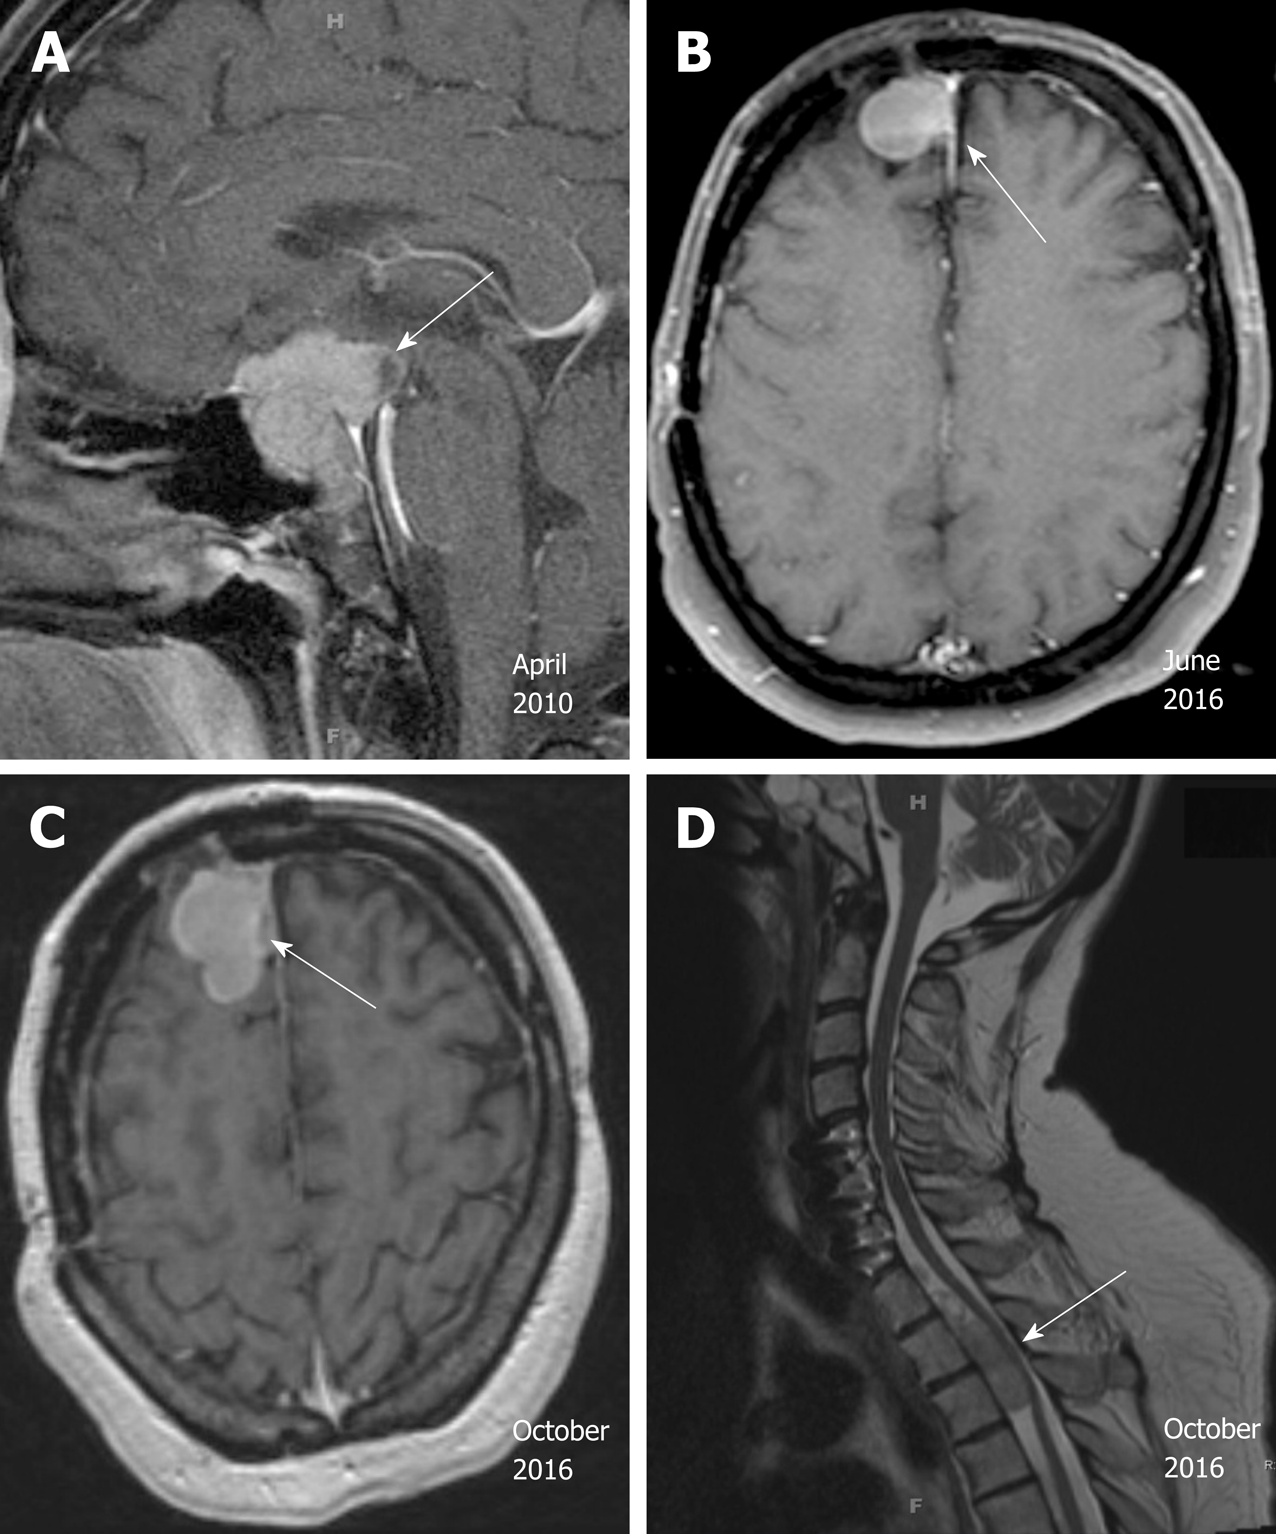
Figure 2 Radiographic images of the pituitary carcinoma discussed in case 2.
A: Magnetic resonance imaging (MRI) in April 2010 shows a suprasellar mass invading the optic chiasm and enveloping the carotid siphon and cavernous sinus (arrow); B: MRI in June 2016 shows recurrence of a 2.3 cm right frontal lesion (arrow); C: MRI of brain in October 2016 shows enhancing anterior right frontal lobe mass measuring 4.1 cm × 2.1 cm (arrow); D: MRI of spine in October 2016 shows extramedullary metastatic tumor within the ventral spinal canal at T1-T3 levels (arrow, T5 lesion is not shown here).
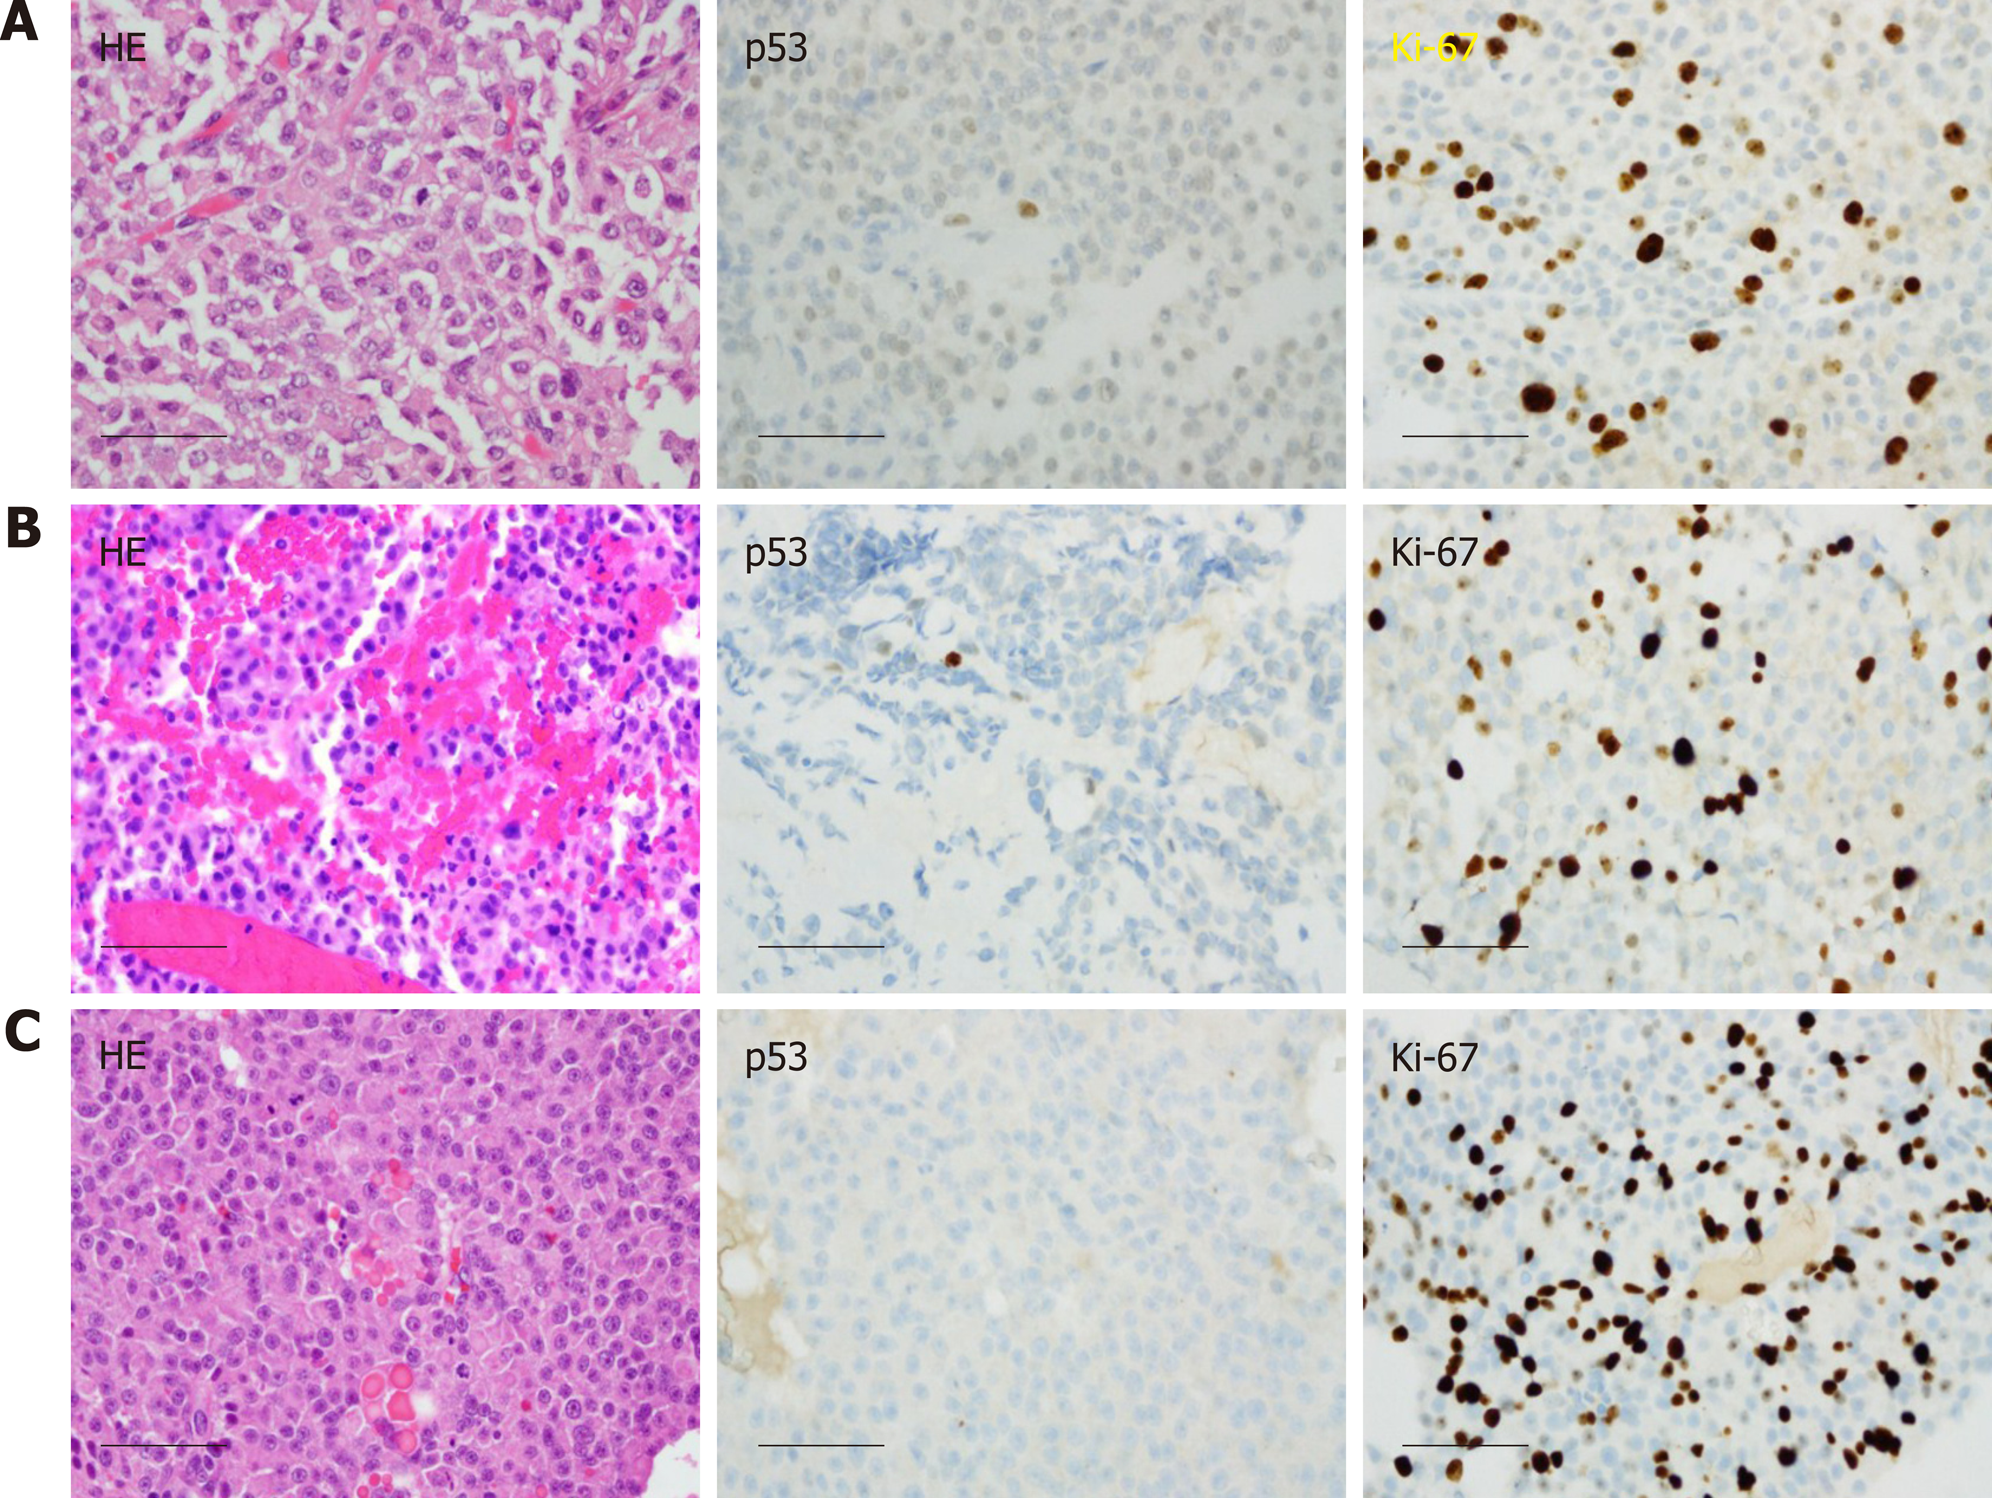
Figure 3 Histological images of the pituitary carcinoma discussed in case 1.
A: "Pituitary tumor" in 02/2011 showed an atypical pituitary adenoma with fairly frequent mitotic figures (up to four per 10 high power fields), weak immunoreactivity for p53, and a Ki-67 labeling index of 13%; B: Recurrent "pituitary tumor" in 04/2014 also showed fairly frequent mitotic figures (up to two per 10 high power fields, no significant reactivity for p53, and a Ki-67 labeling index of 17%; C: The "left convexity mass" in 05/2015 showed morphological features similar to those of the previously resected tissues, but with numerous mitotic figures (at least three per most individual high power fields), a Ki-67 labeling index of 25.5%, and no reactivity for p53. Scale bar = 50 microns for all panels (400×).
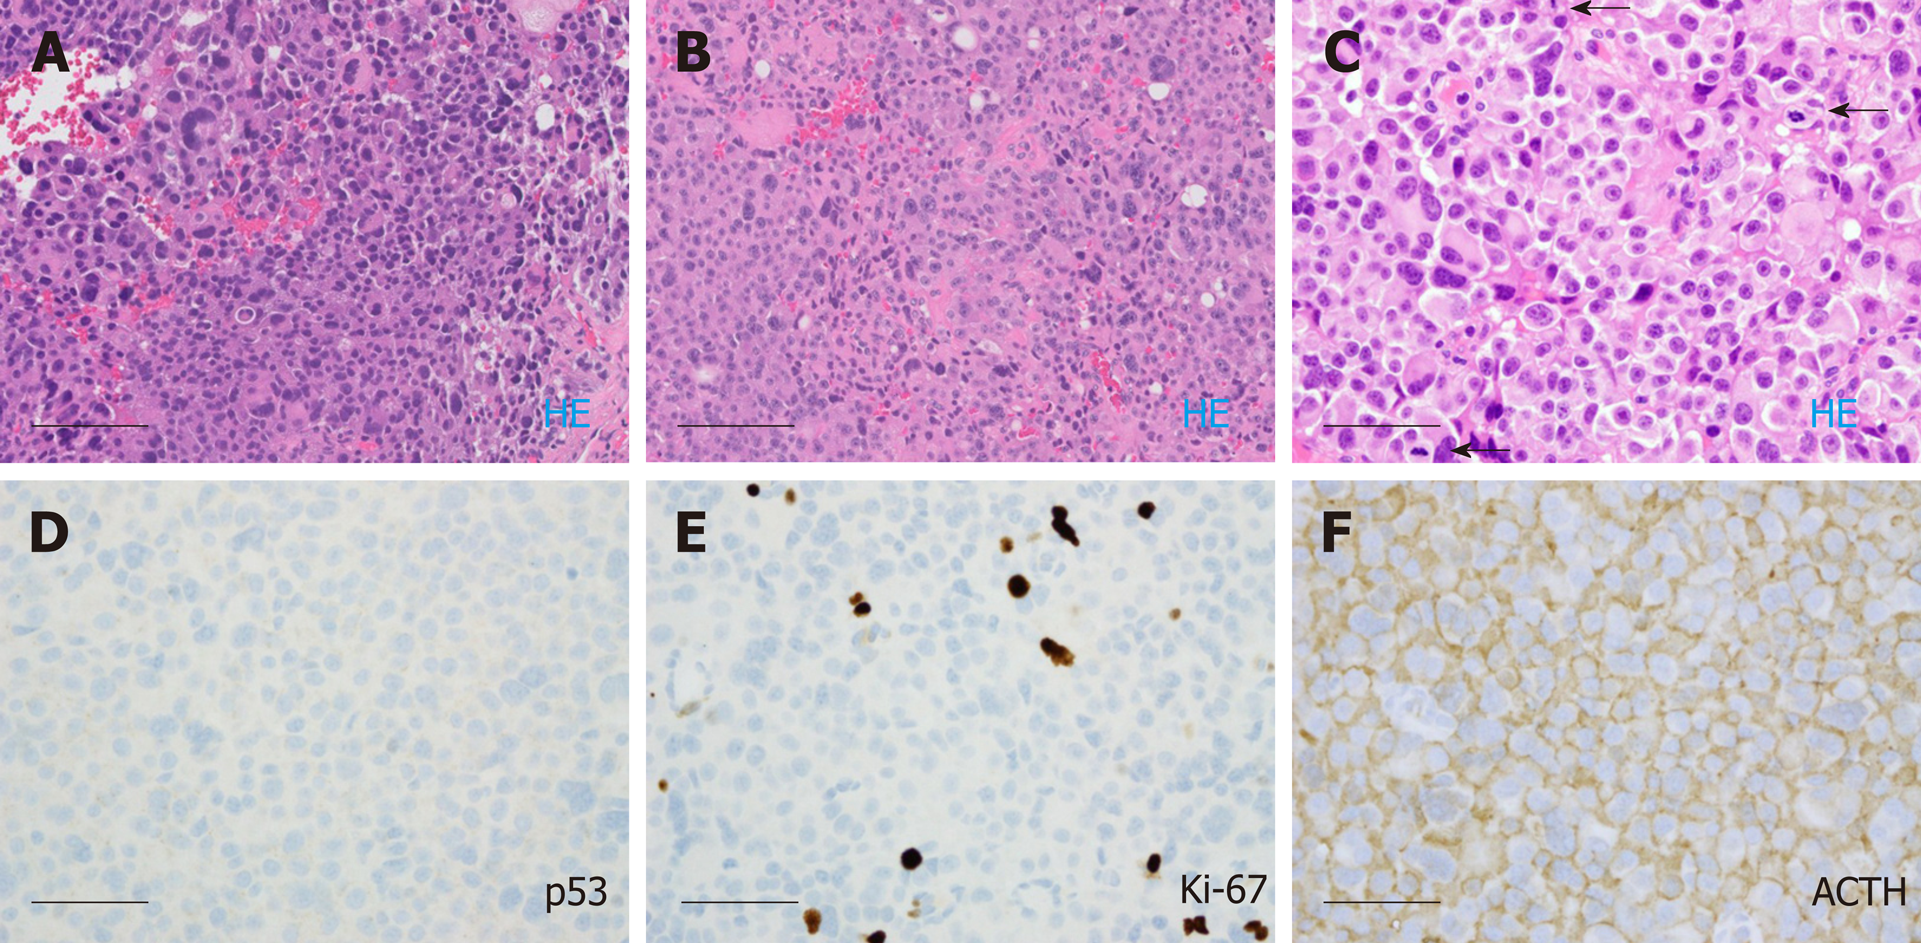
Figure 4 Histological images of the pituitary carcinoma discussed in case 2.
A: "Pituitary tumor" in 05/2010 showed an atypical pituitary adenoma with marked pleomorphism and frequent mitotic figures (ranging up to five per ten high power fields); B: The "right frontal brain lesion tissue" in 10/2016 resembled the 2010 resection material from the pituitary; C-F: The spinal cord "intradural tumor" in 11/2016 resembled the previous two resection specimens, lacked significant immunoreactivity for p53, exhibited a Ki-67 labeling index of approximately 4.8%, and showed diffuse immunoreactivity for adrenocorticotrophic hormone (arrows). Scale bar = 100 microns for panels A and B (200 ×); Scale bar = 50 microns for panels C, D, E, F (400 ×).
- Citation: Xu L, Khaddour K, Chen J, Rich KM, Perrin RJ, Campian JL. Pituitary carcinoma: Two case reports and review of literature. World J Clin Oncol 2020; 11(2): 91-102
- URL: https://www.wjgnet.com/2218-4333/full/v11/i2/91.htm
- DOI: https://dx.doi.org/10.5306/wjco.v11.i2.91


