Copyright
©The Author(s) 2020.
World J Clin Oncol. Nov 24, 2020; 11(11): 959-967
Published online Nov 24, 2020. doi: 10.5306/wjco.v11.i11.959
Published online Nov 24, 2020. doi: 10.5306/wjco.v11.i11.959
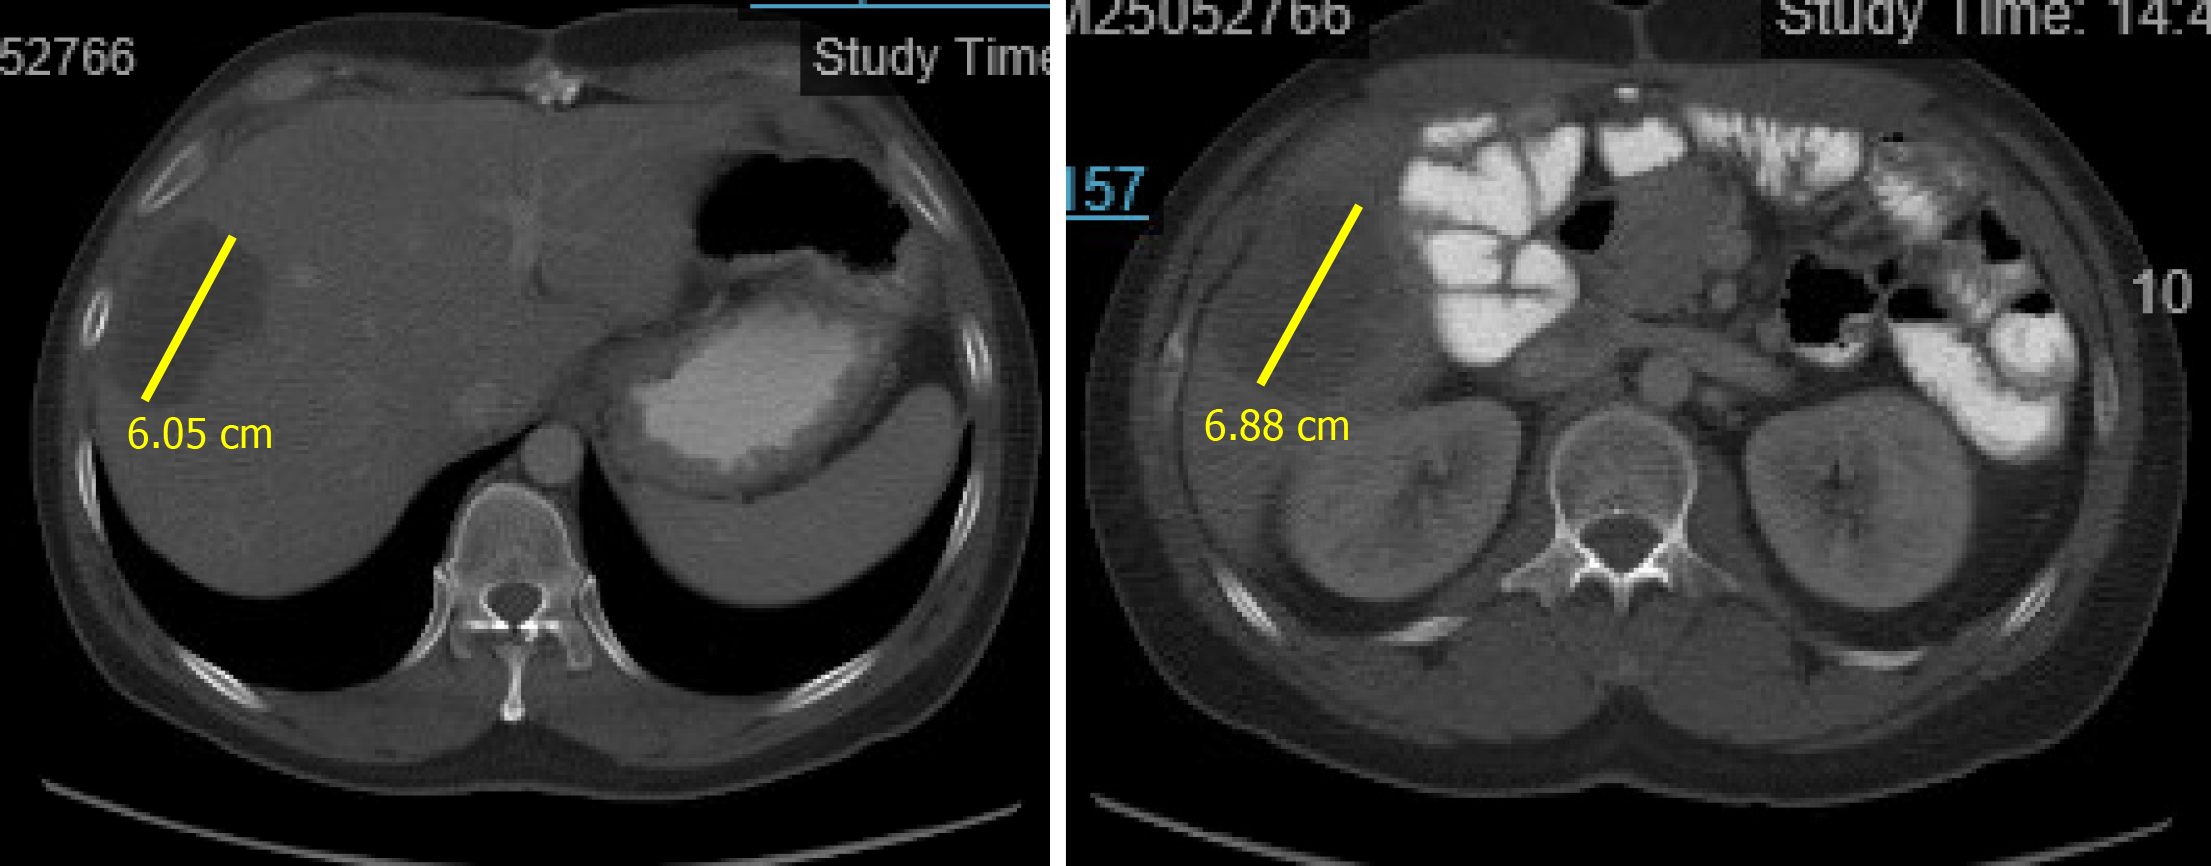
Figure 1 Initial computed tomography images of abdomen and pelvis displaying two hypoattenuating liver masses, which are most consistent with liver metastases from invasive colorectal carcinoma.
Images were captured on 7/25/2016.
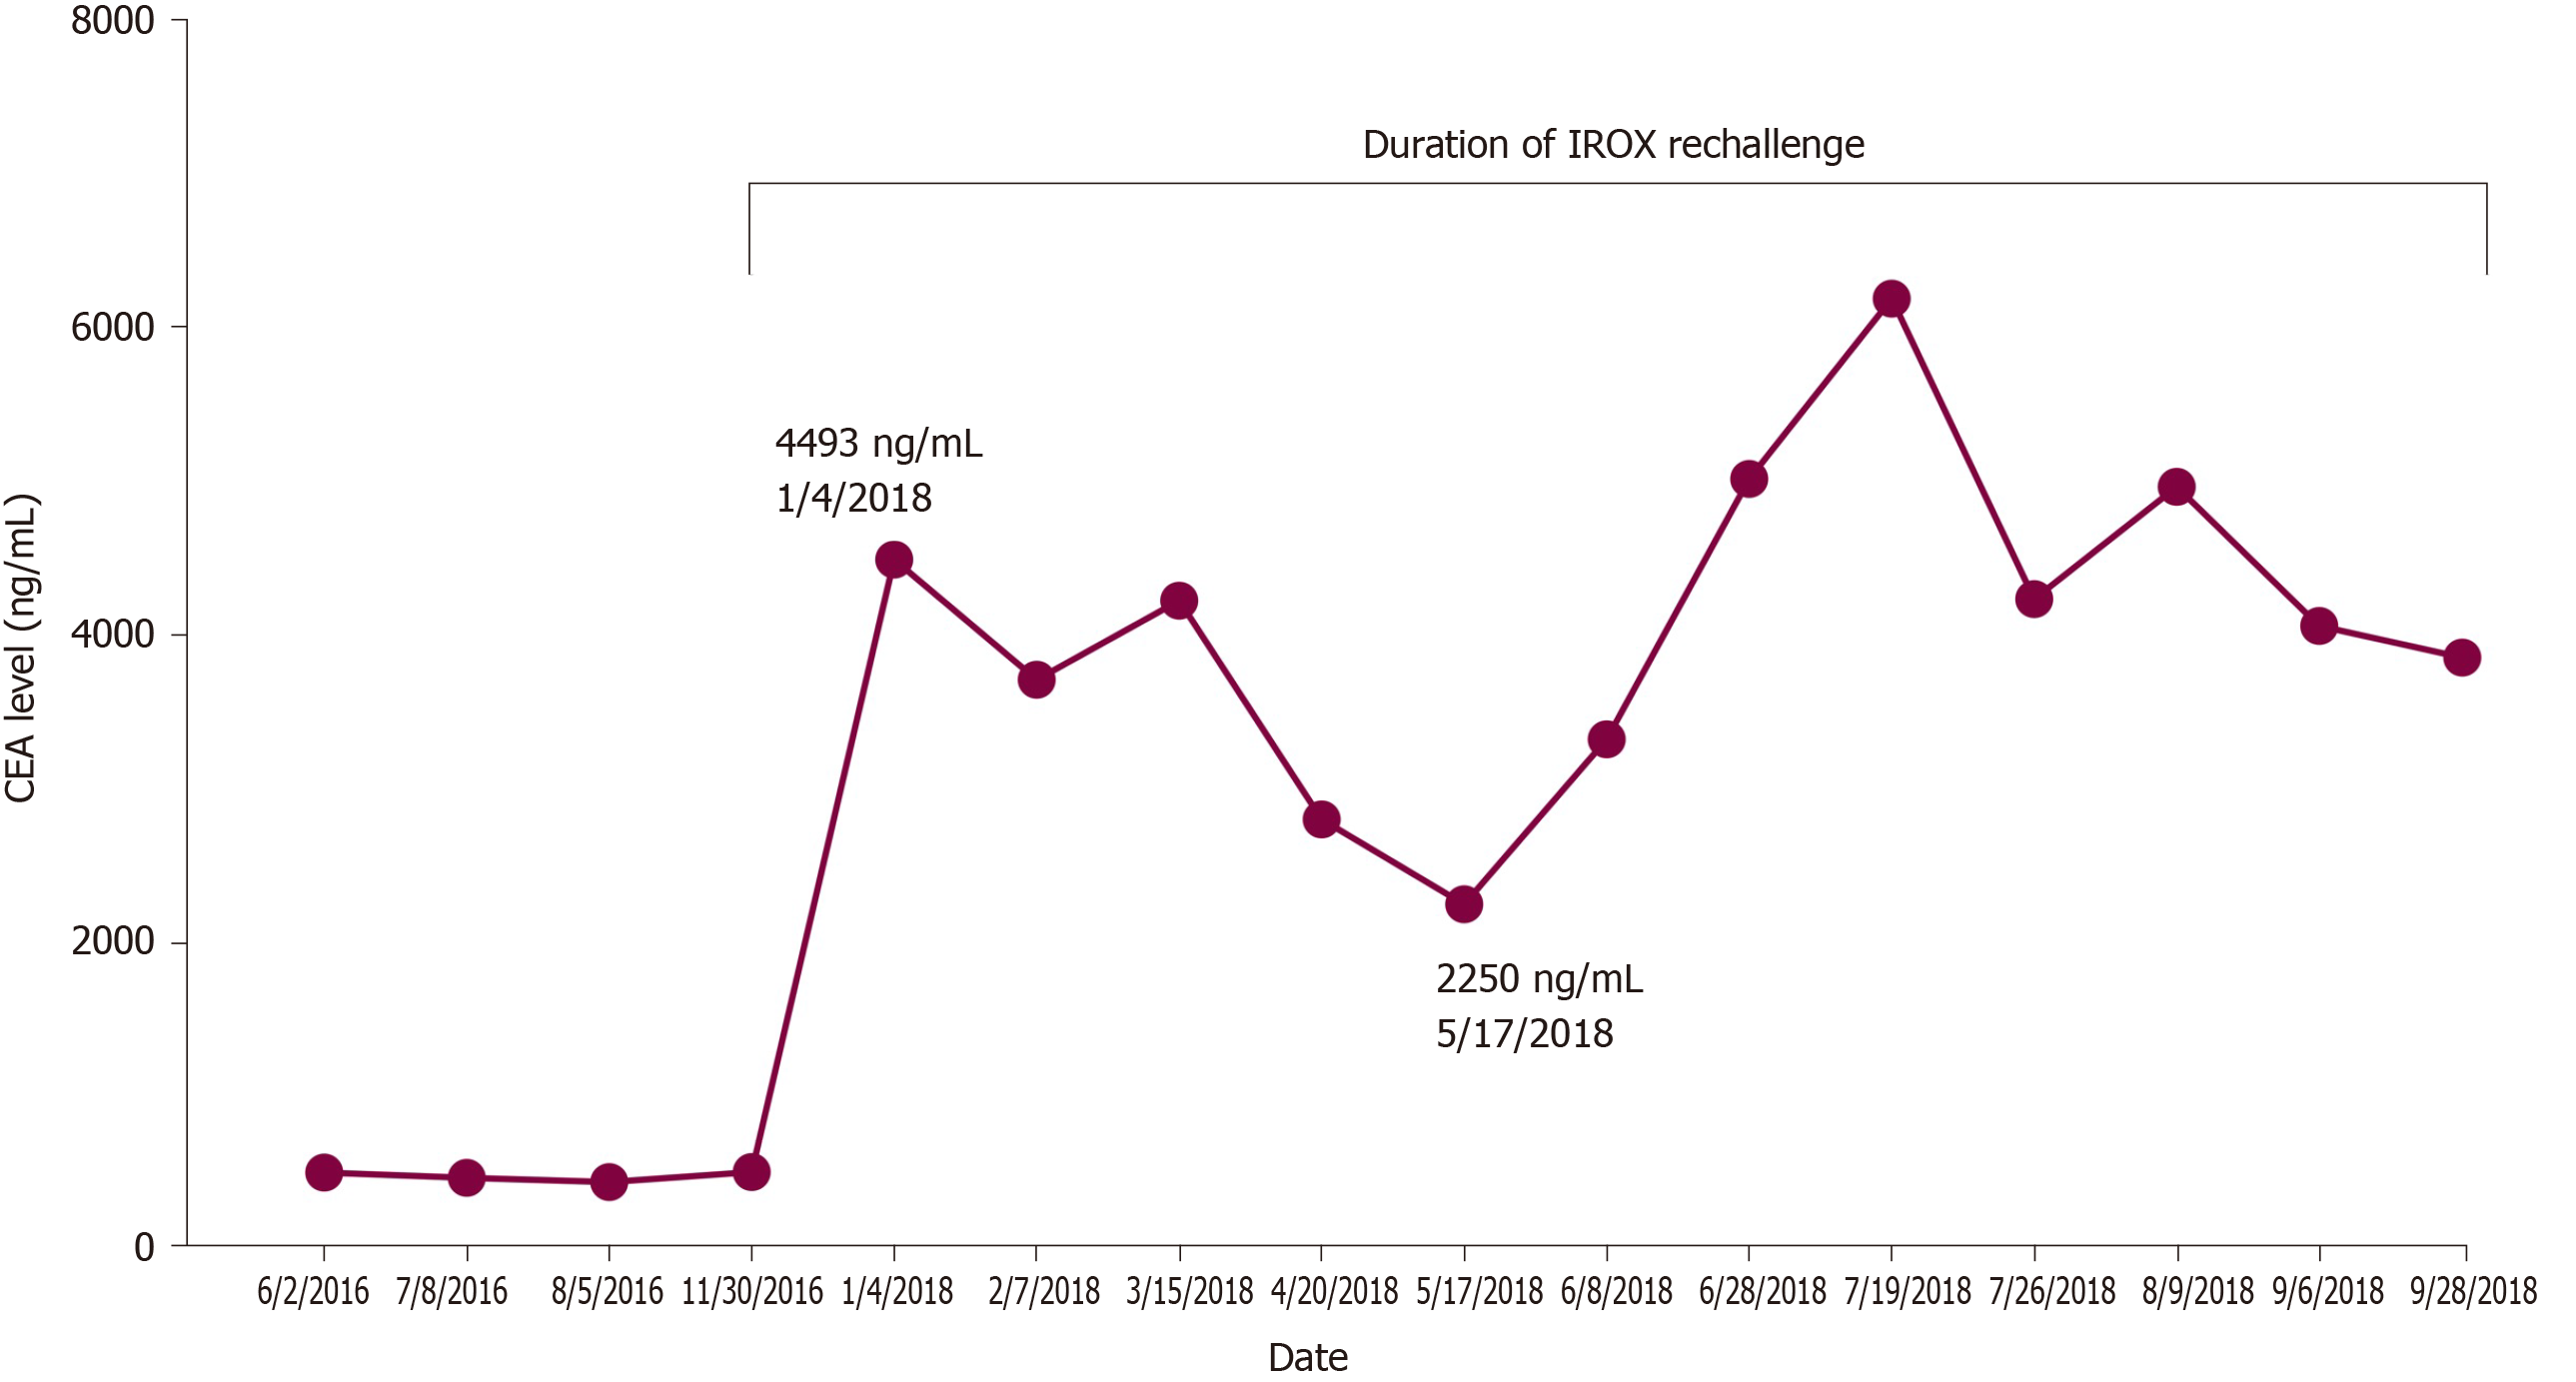
Figure 2 Trend in carcinoembryonic antigen levels during irinotecan with oxaliplatin rechallenge therapy.
CEA: Carcinoembryonic antigen; IROX: Irinotecan with oxaliplatin.
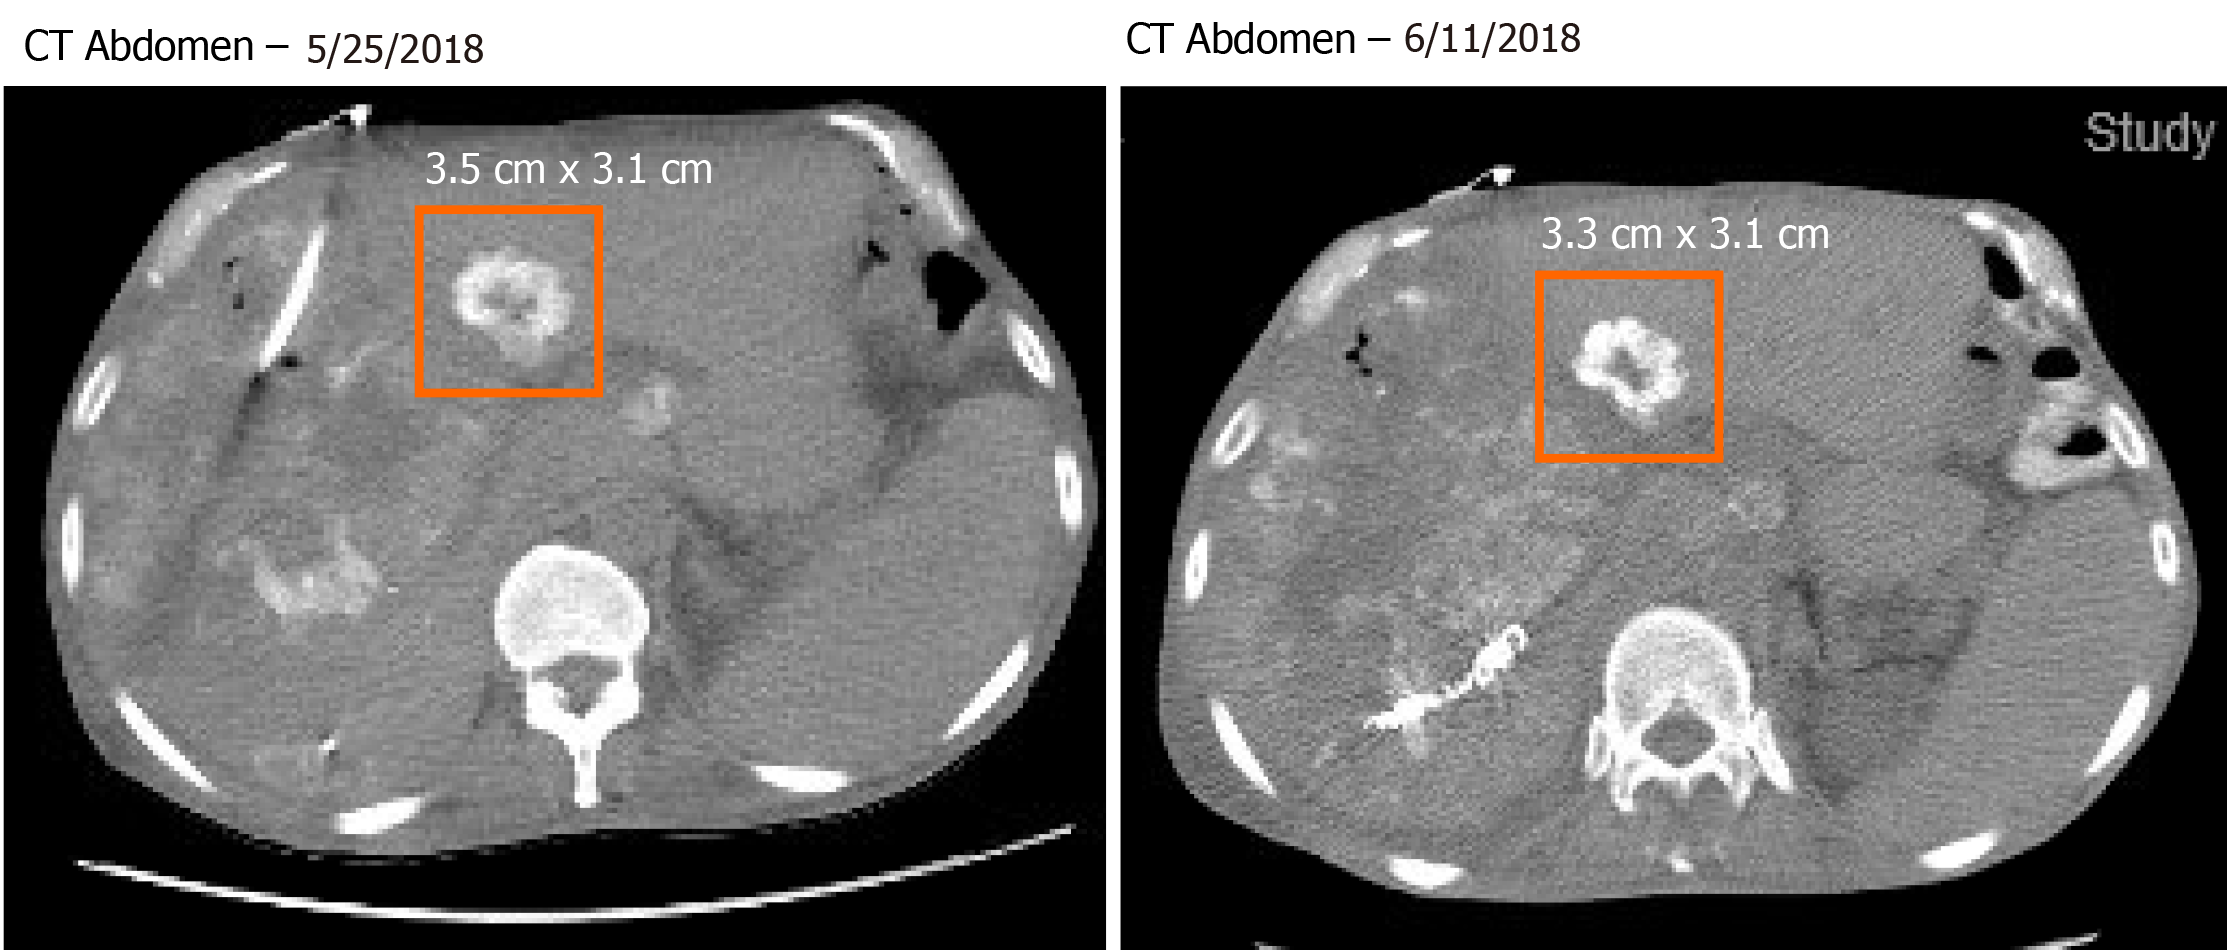
Figure 3 Computed tomography abdomen images showed interval response with decrease in liver metastasis size.
These images show size of the metastatic lesion at 4- and 5-mo post initiation of irinotecan with oxaliplatin rechallenge therapy. CT: Computed tomography.
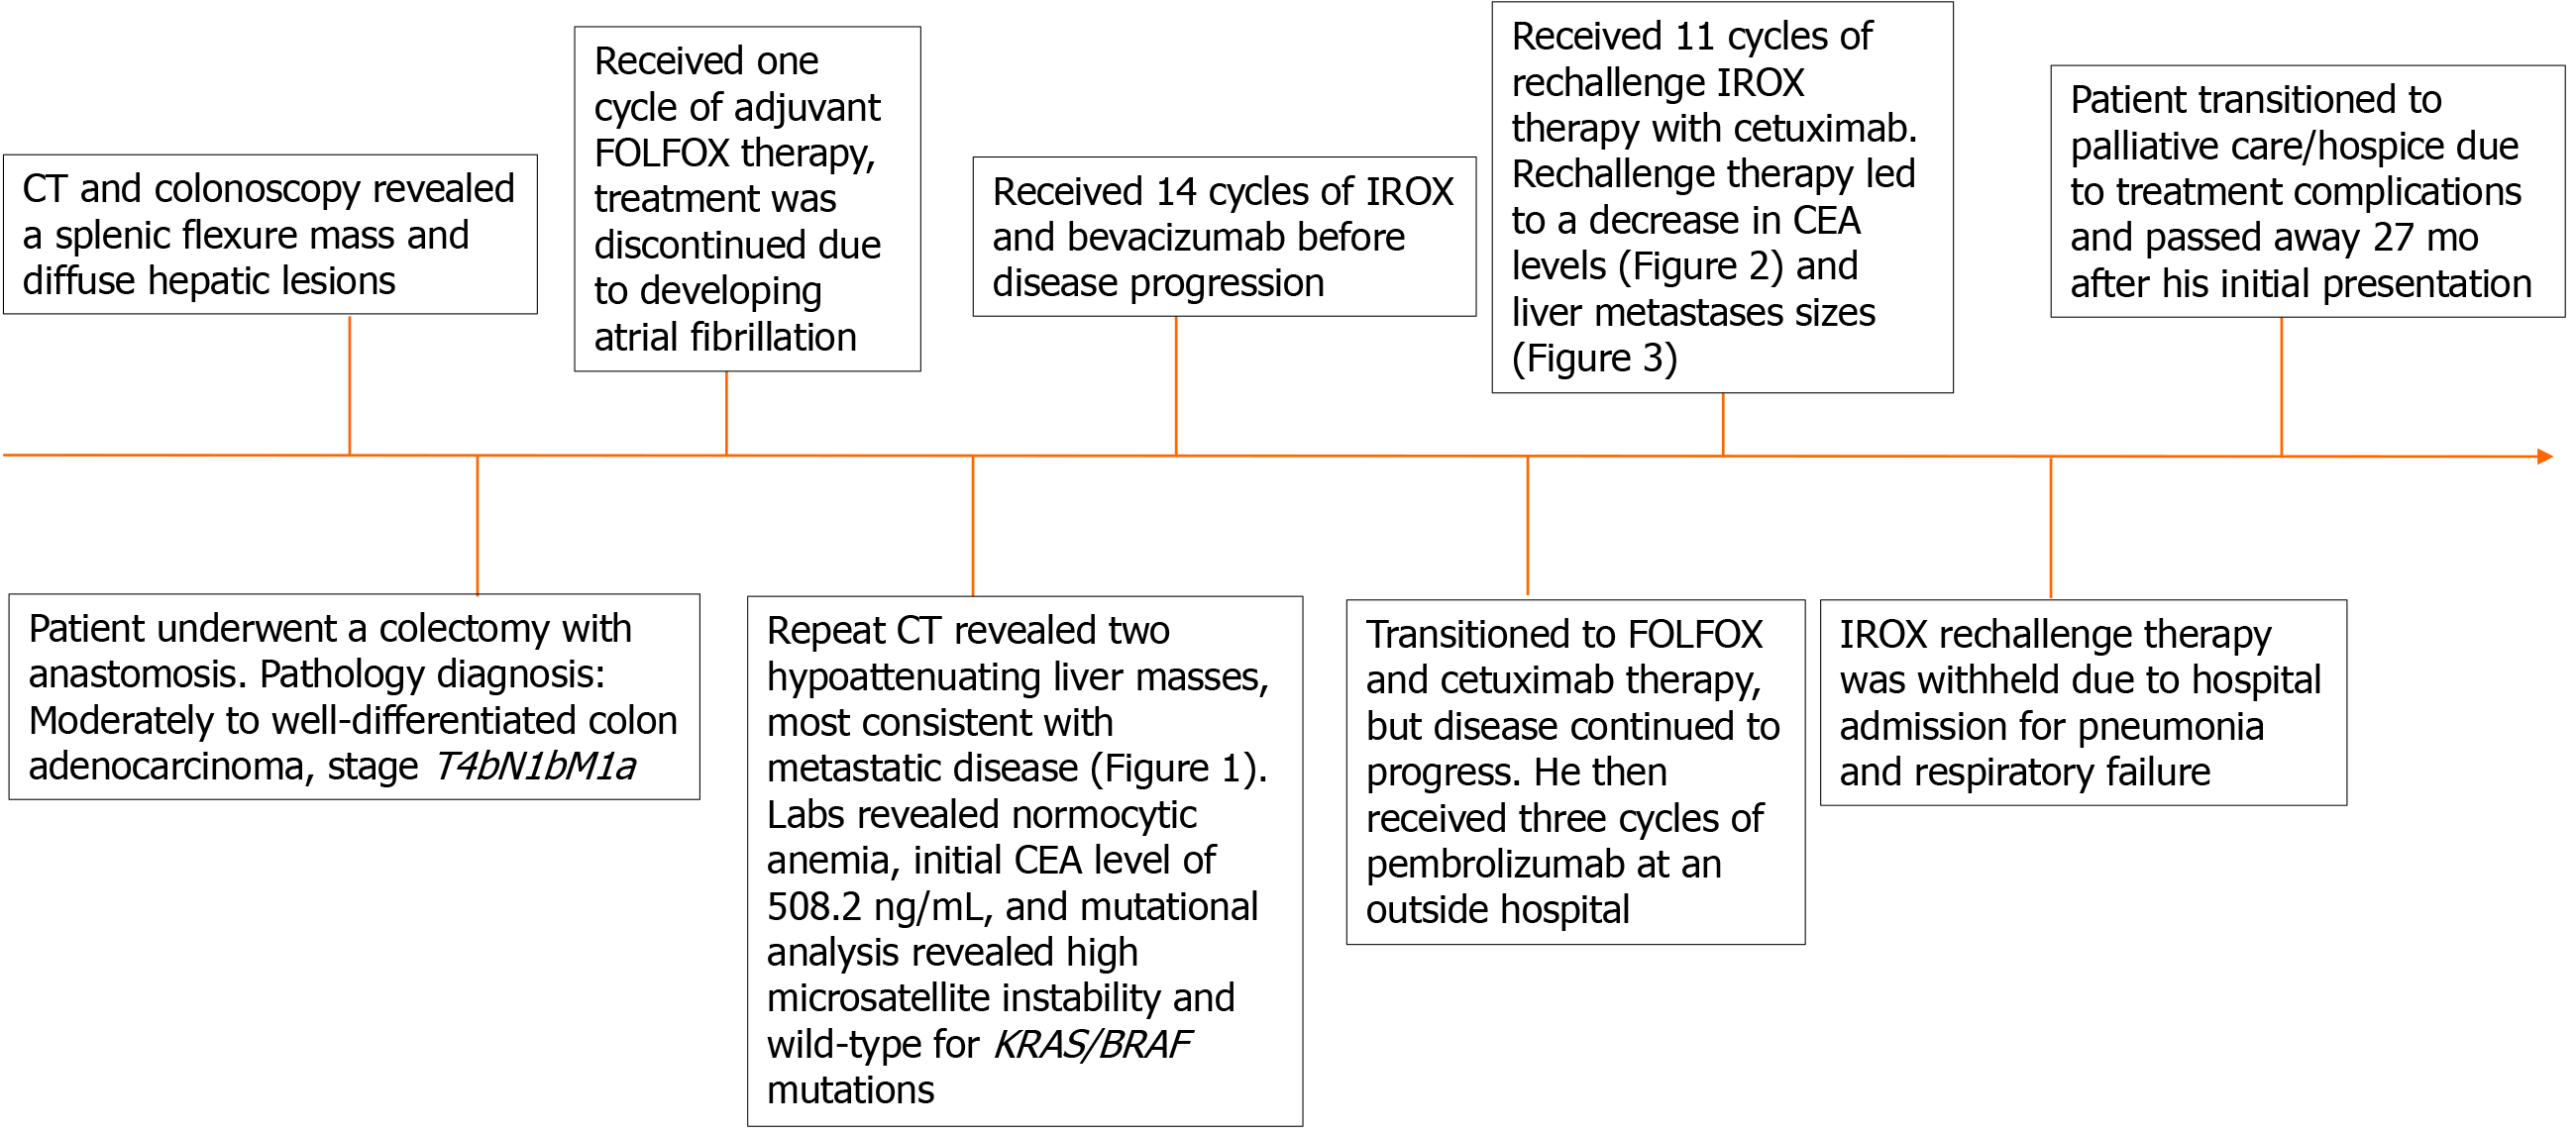
Figure 4 Timeline summary of events.
CT: Computed tomography; FOLFOX: Folinic acid, 5-fluorouracil, and oxaliplatin; CEA: Carcinoembryonic antigen; IROX: Irinotecan and oxaliplatin; KRAS: Kirsten rat sarcoma viral oncogene; BRAF: B-Raf oncogene.
- Citation: Reddy TP, Khan U, Burns EA, Abdelrahim M. Chemotherapy rechallenge in metastatic colon cancer: A case report and literature review . World J Clin Oncol 2020; 11(11): 959-967
- URL: https://www.wjgnet.com/2218-4333/full/v11/i11/959.htm
- DOI: https://dx.doi.org/10.5306/wjco.v11.i11.959


