Copyright
©The Author(s) 2019.
World J Clin Oncol. Jul 24, 2019; 10(7): 247-255
Published online Jul 24, 2019. doi: 10.5306/wjco.v10.i7.247
Published online Jul 24, 2019. doi: 10.5306/wjco.v10.i7.247
Figure 1 A schematic model of pseudoprogression in a lymph node.
A: Healthy lymph node without infiltration; B: Tumor cells infiltrating the tissue, which leads to growth; C: Infiltration of tumor cells into a preexisting tumor cell conglomerate resulting in a further growth; D: Immune cells and healthy tissue cells.
Figure 2 Posttreatment PD-L1 expression pattern in our patients’ high grade serous ovarian carcinoma and in tumor infiltrating lymphocytes.
A: Tumor cell with strong positive membranous staining of PD-L1; B: Tumor with artificial membranous and some cytoplasmatic staining of PD-L1 as well as some immune cells with PD-L1 expression; C: For comparison: an example of PD-L1 staining in immune cells.
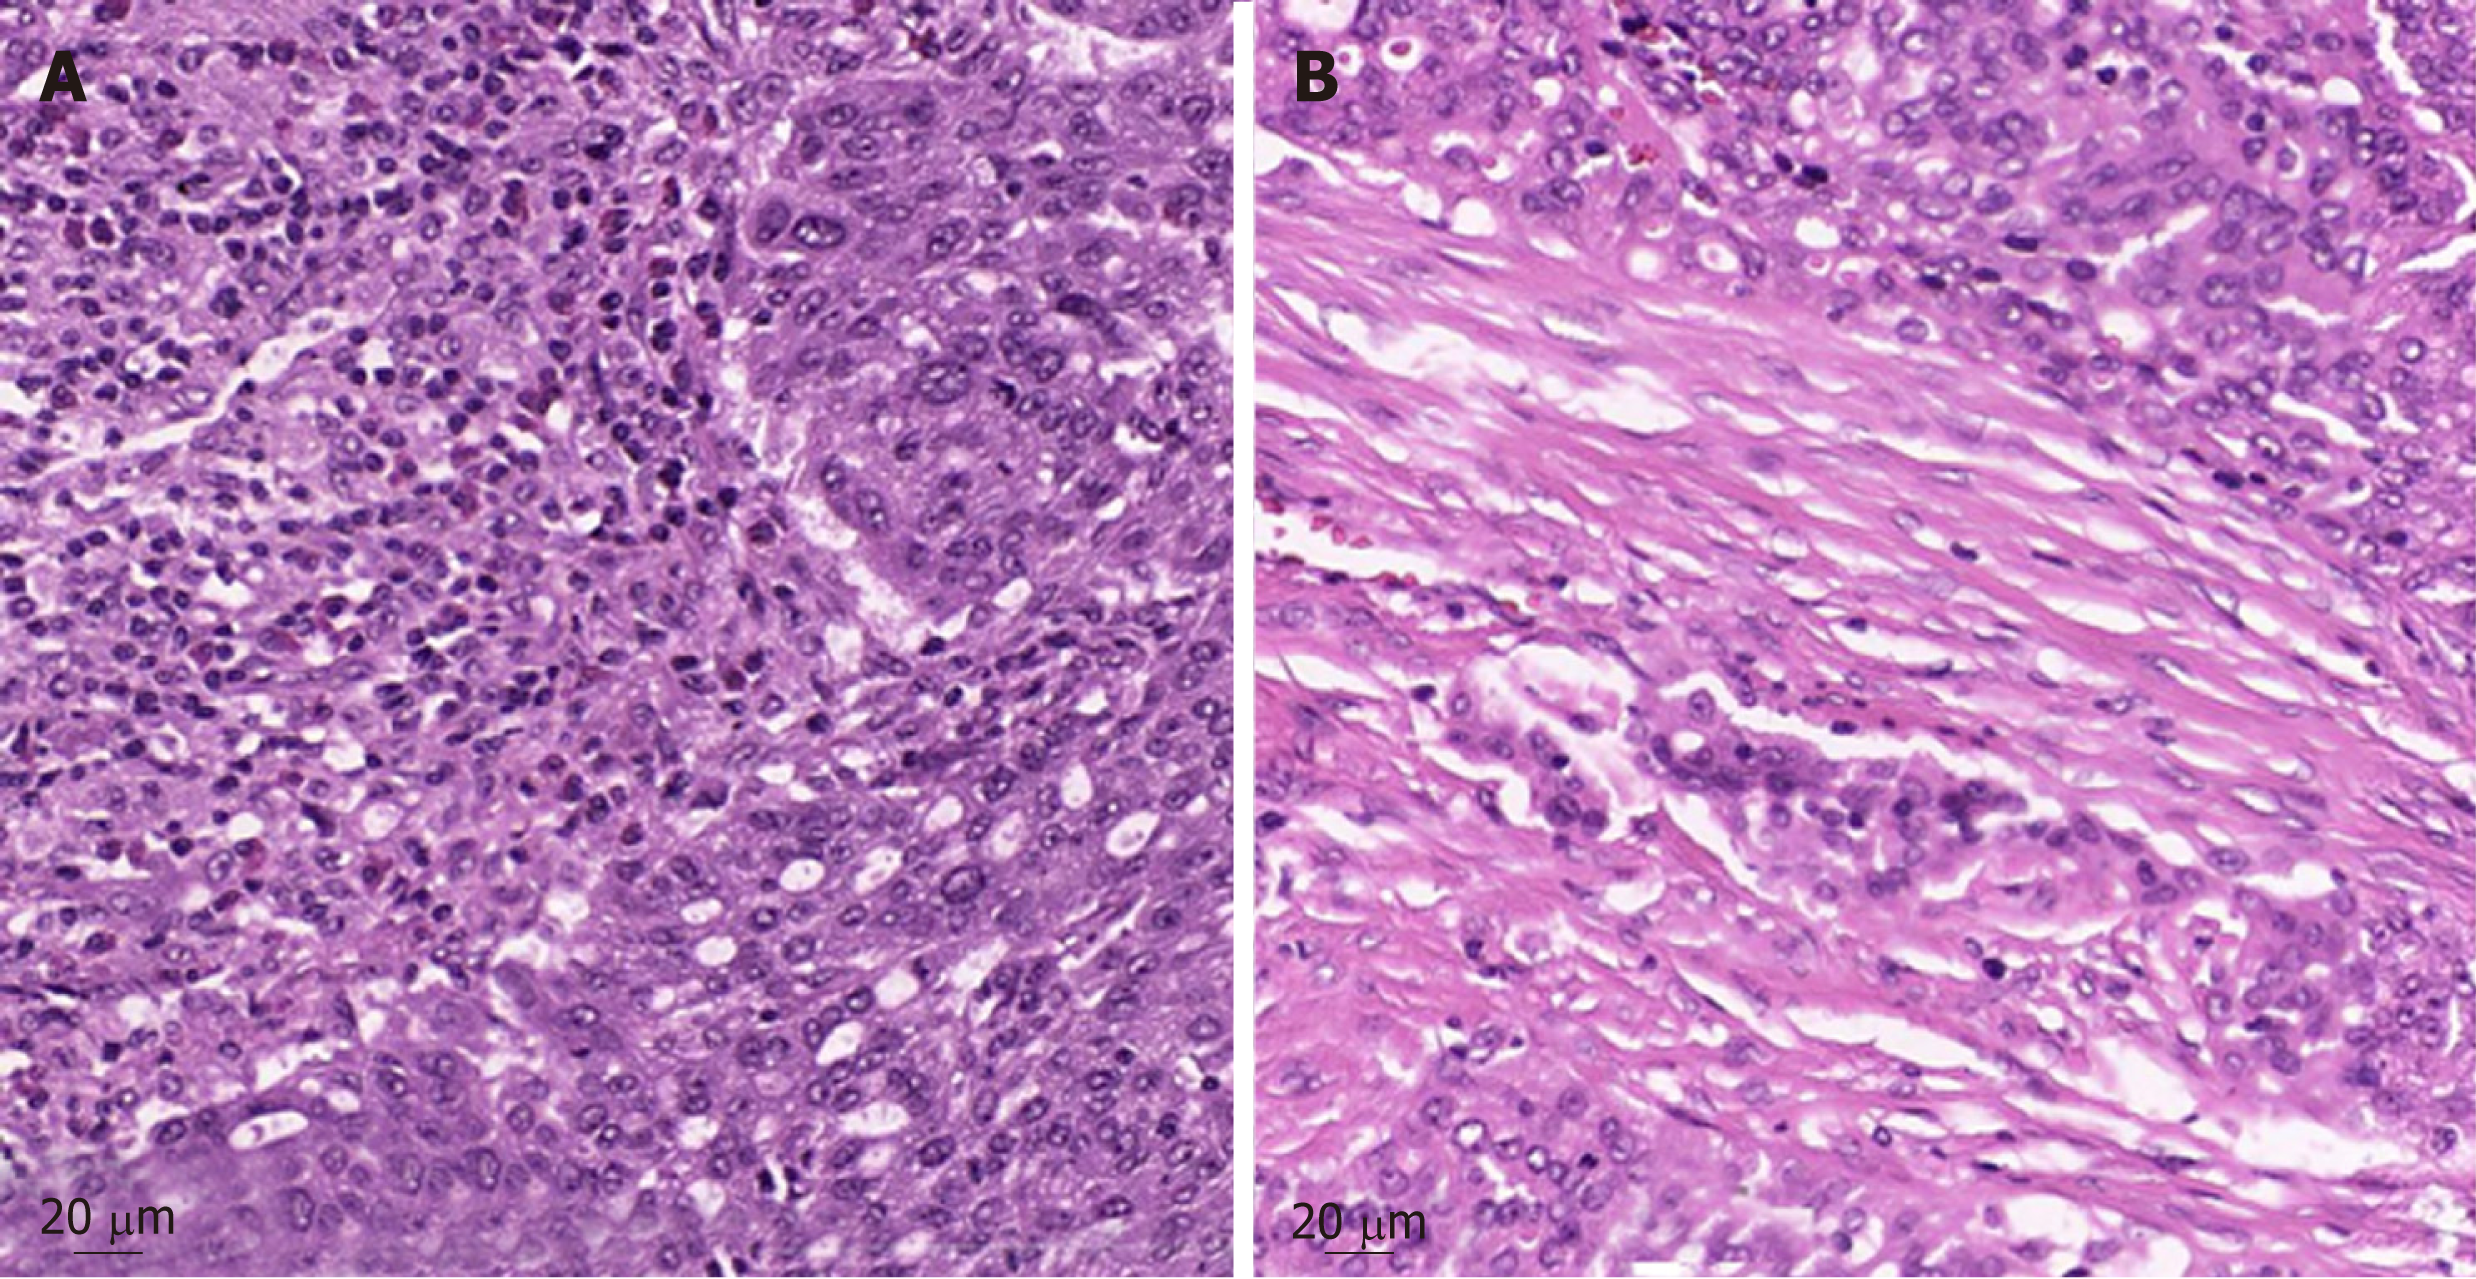
Figure 3 Tumor biopsy before and after treatment with nivolumab.
A: Pretreatment tumor biopsy in 2012, HE-stain. Note the intratumoral lymphocytes (TILS); B: Posttreatment tumor biopsy of the high-grade serous carcinoma of the left colic flexure in 2016, HE-stain. Note reduced intratumoral lymphocytes.
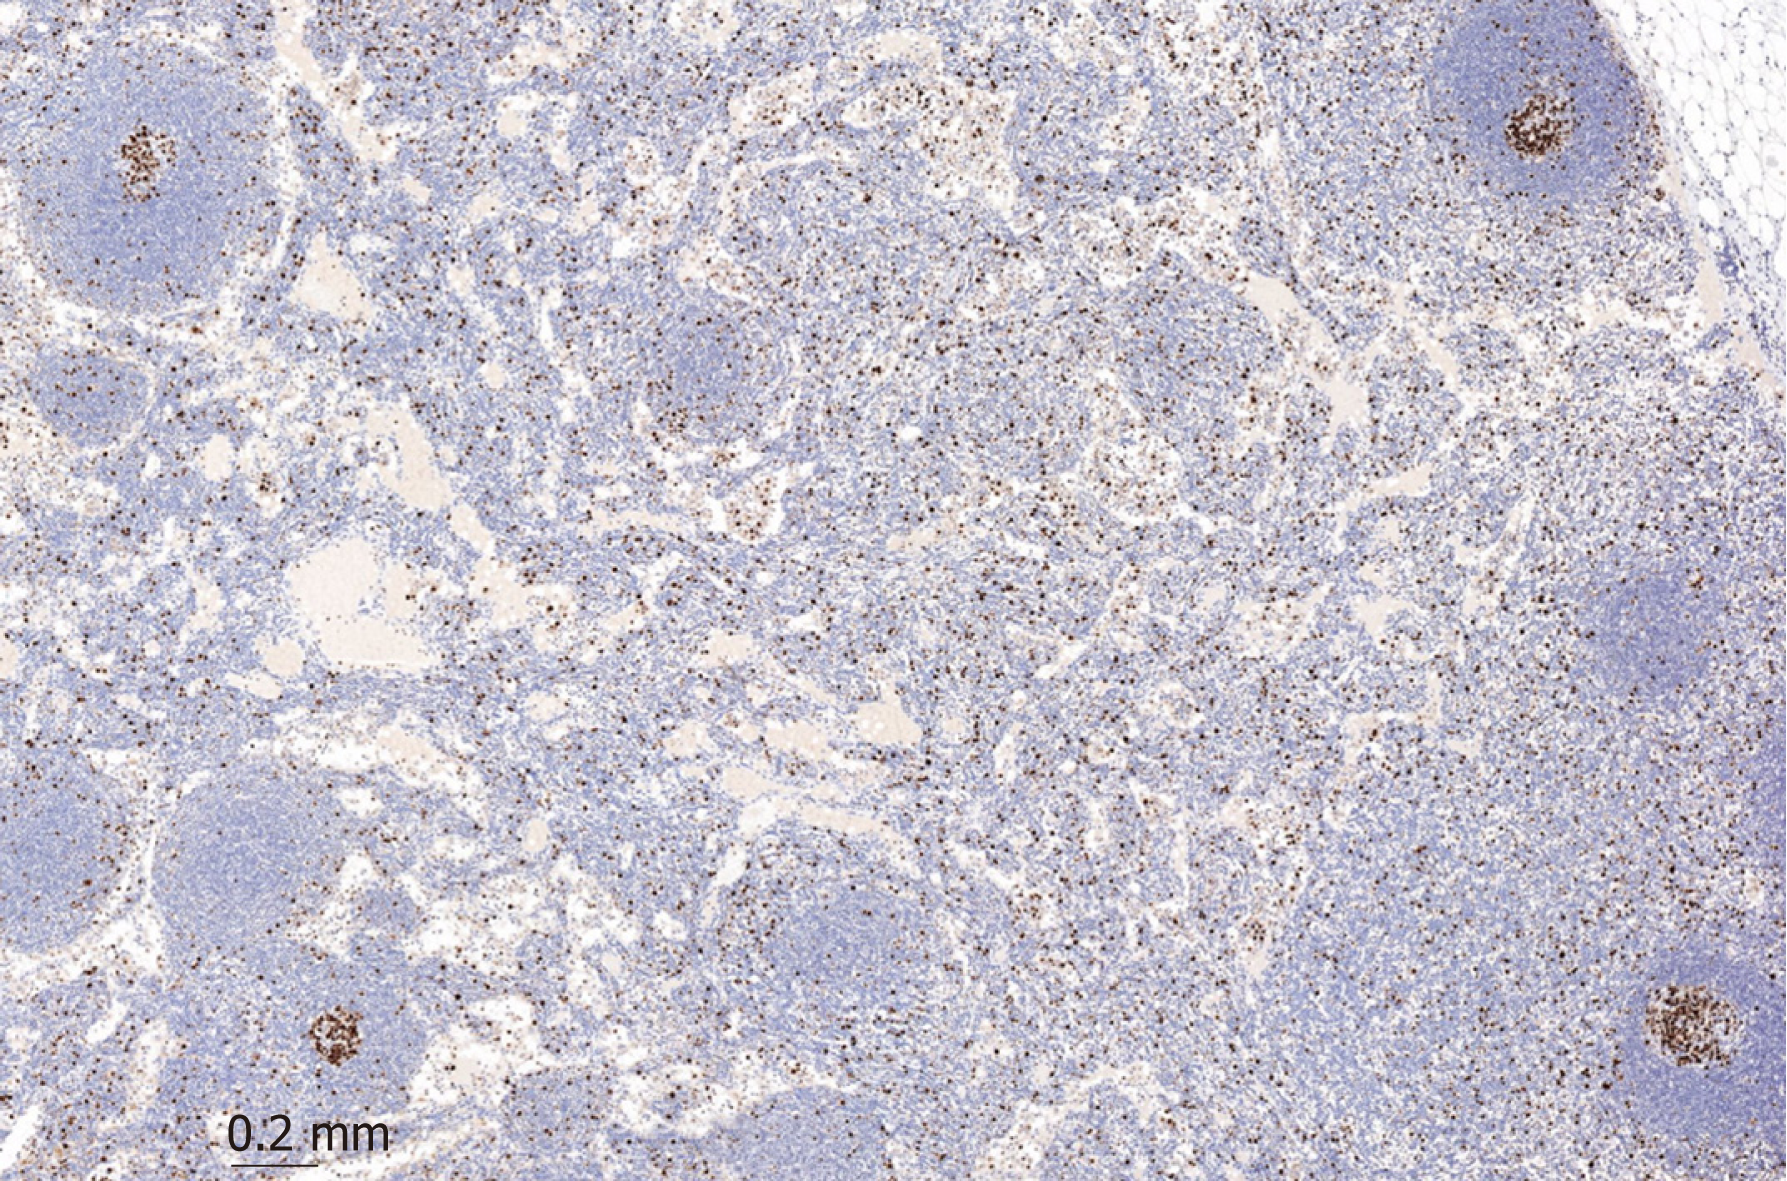
Figure 4 Biopsy of a lymph node after nivolumab treatment.
Activation of a lymph node including increased Ki-67 positive interfollicular population.
- Citation: Passler M, Taube ET, Sehouli J, Pietzner K. Pseudo- or real progression? An ovarian cancer patient under nivolumab: A case report. World J Clin Oncol 2019; 10(7): 247-255
- URL: https://www.wjgnet.com/2218-4333/full/v10/i7/247.htm
- DOI: https://dx.doi.org/10.5306/wjco.v10.i7.247


